RSI Alerts New Version MTF
- Indikatoren
-
Eadvisors Software Inc.
 Estratégias de negociação automatizadas para o mercado financeiro.
Robôs de Negociação e indicadores.
[Automated trading strategies]
Contate o Desenvolvedor: eadvisorsbr@yahoo.com - Version: 110.219
- Aktivierungen: 5
Der von J. Welles Wilder entwickelte Relative Strength Index (RSI) ist ein Momentum-Oszillator, der die Geschwindigkeit und Veränderung von Kursbewegungen misst. Der RSI oszilliert zwischen null und 100.
Wir haben dem bekannten RSI-Indikator mehrere Arten von Warnungen und einen Signalintervallfilter hinzugefügt, die in Ihre Expert Advisors integriert werden können.
Er funktioniert in ALLEN Timeframes und Instrumenten.
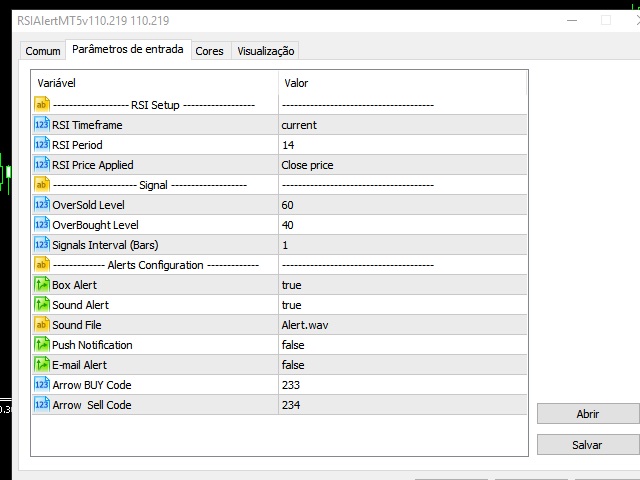
Produkt Eigenschaften
- E-Mail-Warnung
- Ton-Alarm
- Push-Benachrichtigung (Alarme können an Ihr Mobiltelefon gesendet werden)
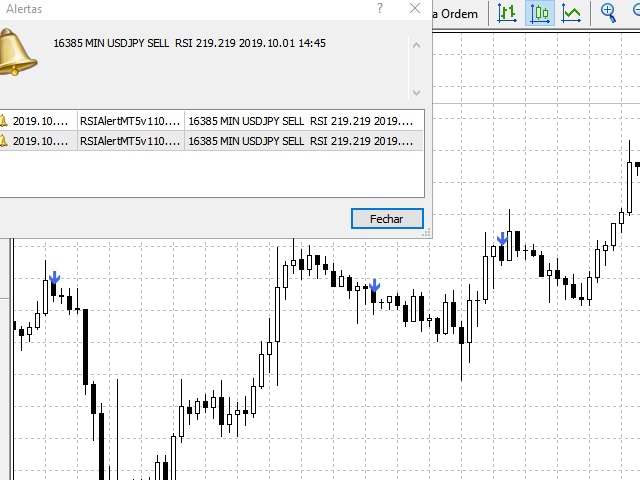
- Zeichen im Chart
- Alarm-Box
- Intervall zwischen den Signalen (Bars)
- Multitimeframe-Signale
Indikator-Parameter
- Push-Benachrichtigung - Diese Option ermöglicht es Ihrem MetaTrader 4, Alarme an Ihr Smartphone (IOS oder Android) zu senden.
- E-Mail-Benachrichtigung - Konfigurieren Sie Ihre Benachrichtigungen so, dass sie an Ihre E-Mail-Adresse gesendet werden.
- SignOnChart - Aktivieren Sie das Zeichnen von Alarmen auf Ihrem Chart.
- Tonalarm - Aktivieren Sie den Tonalarm im Cross- oder Level-Modus.
- Alert Box - Aktivieren Sie eine einfache Alert Box bei Ereignissen.
- UpLevelAlert / DwLevelAlert - Konfigurieren Sie den Maximal- und Minimalbereich des Indikatorpegels, der Sie warnen soll.
- LevelAlert - Aktivieren Sie den Alarm beim Überschreiten der oben konfigurierten Level.
- SoundFile - Datei, die Sie im Alarmmodus abspielen möchten.
- RSI Price - Preistyp, der im Indikator verwendet wird.