• Aperçu
  • Avis
  • Commentaires
  • Nouveautés

Volume Weighted MACD

MACD pondéré en fonction du volume

La MACD pondérée en volume (VW-MACD) a été créée par Buff Dormeier et décrite dans son livre Investing With Volume Analysis. Il représente la convergence et la divergence des tendances des prix pondérés en fonction des volumes.

L'inclusion du volume permet au VW-MACD d'être généralement plus réactif et fiable que le MACD traditionnel.


Qu'est-ce que la MACD (Moving Average Convergence Divergence) ?

Moyenne mobile Convergence Divergence a été créé par Gerald Appel en 1979. Le MACD standard trace la différence entre une moyenne exponentielle à court terme et une moyenne exponentielle à long terme. Lorsque la différence (la ligne MACD) est positive et en hausse, cela suggère que la tendance des prix est à la hausse. Lorsque la ligne MACD est négative, cela suggère que la tendance des prix est à la baisse.

Une moyenne exponentielle lisse de cette différence est calculée pour former la ligne de signal MACD. Lorsque la ligne MACD est au-dessus de la ligne de signal MACD, cela montre que l'élan de MACD augmente. De même, lorsque le MACD est en dessous de la ligne de signal MACD, l'élan du MACD chute. Cette différence entre la ligne MACD et la ligne de signal MACD est fréquemment tracée sous forme d'histogramme pour mettre en évidence l'écart entre les deux lignes.


Quelle est la différence entre MACD et VW-MACD ?

La MACD pondérée en volume remplace les deux moyennes mobiles exponentielles pour calculer la différence MACD avec les deux moyennes mobiles pondérées en volume correspondantes. Ainsi, VW-MACD oppose une tendance à court terme pondérée en fonction du volume à la tendance à long terme pondérée en fonction du volume.

La ligne de signal est laissée sous forme de moyenne mobile exponentielle car la ligne VW-MACD est déjà pondérée en fonction du volume.


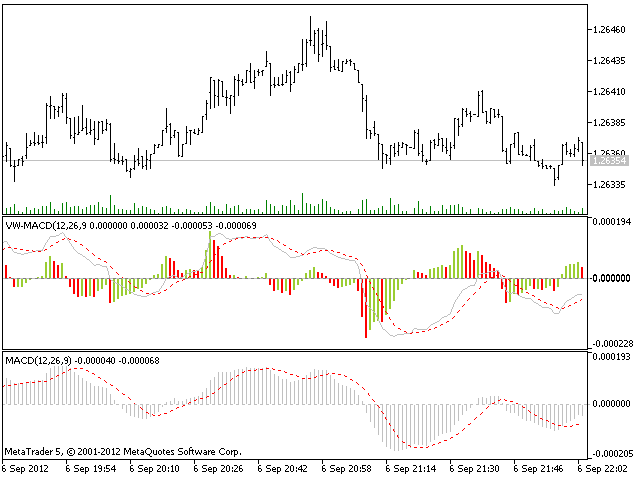
MACD pondéré en fonction du volume pour MetaTrader 5

L'indicateur VW-MACD pour MetaTrader 5 affiche 4 sorties :
  • Ligne MACD sous forme de ligne continue grise ;
  • Ligne de signal sous forme de ligne rouge en pointillés ;
  • Histogramme MACD sous forme de barre verte ;
  • Histogramme MACD vers le bas sous forme de barre rouge.
L'histogramme VW-MACD est amplifié d'un facteur afin d'avoir une meilleure visibilité de tous les changements.
Produits recommandés
COSMOS4U Volume MT5
COSMOS4U - D. Vezeris & Co, L.P.
1 (1)
COSMOS4U Volume indicator facilitates your trade decisions. It gives confirmation of the running movement and market trends. It highlights current and past accumulation and distribution volumes, comparing them to moving average volume and the highest volume. In addition, it identifies and marks nuances as well as convergence and divergence patterns of bears and bulls in order to provide the market trend and price ranges. The supported features are as follows: Fast Volume Moving Average Slow Volu
The Volume+ and VSA Signals indicator for MT5 is based on the Volume Spread Analysis (VSA) methodology to provide the signals. The signals are displayed at closing of bars on the main window or subwindow in the form of symbols. The symbols are not repainting.  The indicator produces a signal on an individual bar and this signal is not buy or sell signal. When a minor trend goes in the opposite direction of a major trend, there are sequences of major trend-following signals that give a higher pro
This indicator anticipates price reversals analyzing bullish and bearish pressure in the market. The buying pressure is the sum of all the accumulation bars over a certain number of days, multiplied by the volume. The selling pressure is the sum of all of the distribution over the same number of bars, multiplied by the volume. [ Installation Guide | Update Guide | Troubleshooting | FAQ | All Products ] The indicator ratio gives you a measure of the buying pressure as a percentage of the total ac
Volumes Direction MT5
William Oswaldo Mayorga Urduy
VOLUMES DIRECTION MT5 Normalement, l'indicateur de volume a un changement de couleur par défaut lorsque le volume actuel est plus élevé que le précédent, c'est important mais pas très utile. Pour cette raison, cet indicateur a été créé pour qu'en plus du volume normal, lorsque la bougie est haussière ou baissière, il les peint d'une couleur différente, par défaut bleu pour haussier et rouge pour baissier, mais ces couleurs peuvent être personnalisées selon le Le goût du commerçant. N'
Wapv Price and volume
Eduardo Da Costa Custodio Santos
L'indicateur de prix et de volume WAPV pour MT5 fait partie de l'ensemble d'outils (Wyckoff Academy Wave Market) et (Wyckoff Academy Price and Volume). L'indicateur de prix et de volume WAPV pour MT5 a été créé pour faciliter la visualisation intuitive du mouvement du volume sur le graphique. Avec lui, vous pouvez observer les moments de pic de volume et les moments où le marché n'a aucun intérêt professionnel Identifiez les moments où le marché évolue par inertie et non par mouvement de "smart
Weis Waves
Flavio Javier Jarabeck
3.15 (26)
The original author is David Weis, an expert in the Wyckoff Method. The Weis Wave is a modern adaptation of the 1930's Wyckoff Method, another expert in Tape Reading techniques and Chart Analysis. Weis Waves takes market volume and stacks it into waves according to price conditions giving the trader valuable insights about the market conditions. If you want to learn more about this subject you can find tons of videos in YouTube. Just look for "The Wickoff Method", "Weis Wave" and "Volume Spread
FREE
Do you use volume in your reading of the market? Certainly many traders use it, and do not imagine operating without it. The Color Histogram Volume Set indicator allows the user to choose the value that he considers interesting to monitor. When you pass this you will have visual confirmation and if you want you will also have the audible alert that is given by the indicator. Of course, there are other ways to try to find a high volume, such as assessing whether the volume
WAPV Weis Wave Chart Forex
Eduardo Da Costa Custodio Santos
Le Weis Wave Chart Forex pour MT5 est un indicateur de prix et de volume. La lecture du prix et du volume a été largement diffusée par Richard Demille Wyckoff sur la base des trois lois qu'il a créées : l'offre et la demande, la cause et l'effet et l'effort contre le résultat. En 1900 R.Wyckoff utilisait déjà le wave chart dans ses analyses. De nombreuses années plus tard, vers 1990, David Weis a automatisé le diagramme d'onde de R. Wyckoff et aujourd'hui nous vous apportons l'évolution du diagr
Segmented Volume MT5
Eduardo Da Costa Custodio Santos
L'indicateur de volume segmenté MT5 a été créé pour faciliter ceux qui négocient en utilisant l'analyse des prix et des volumes, VSA, VPA, la méthode Wyckoff et le système Smart Money. Le volume segmenté fonctionne sur n'importe quel marché (Crypto, CFD, Forex, Futures, Actions...) et fonctionne à n'importe quel moment du graphique. Voyez à quel point votre interprétation est facile : #Vert : Volume bien supérieur à la moyenne du marché #Rose foncé : Volume supérieur à la moyenne #Bleu : Volume
Heatmap Volume Profile
Olexandr Savchuk
4.25 (4)
A Heatmap with a Volume Profile is like a thermal imager or x-ray machine. It will help you to estimate the relative distribution of volume during the price movement and to understand  the relationship between volume and price. Indicator Volume Profile "Volumos Maxima" is a powerful tool for analyzing this relationship. After simple experimentation with heatmap, you can find that each trading instrument has its own “ characteristic ” way of distributing volume. And this will help you to make a b
Volume Analysis Trader looks at volume using a fixed average of volume. This averaging helps spot when volume is rising or declining. Also I have added volume spikes which are when volume suddenly is above the average. These help spot market reversals. This will hep a trader look for the following in their trading: Rising volume during a rally shows trend is strong. Falling volume on a rally shows trend is weakening. As a rule of thumb on daily charts if current volume is higher than yester
BoxChart MT5
Evgeny Shevtsov
5 (7)
The market is unfair if only because 10% of participants manage 90% of funds. An ordinary trader has slim changes to stand against these "vultures". This problem can be solved. You just need to be among these 10%, learn to predict their intentions and move with them. Volume is the only preemptive factor that faultlessly works on any timeframe and symbol. First, the volume appears and is accumulated, and only then the price moves. The price moves from one volume to another. Areas of volume accumu
Key level wedge MT5
Presley Annais Tatenda Meck
The   Key level wedge MT5   indicator automatically draws rising wedge pattern and falling wedge pattern for you on the chart. This pattern is really good when used as a confirmation entry at key support & resistance, supply & demand and reversal zones. Advantages  The   Key level wedge MT5   block DOES NOT RE-PAINT, giving you confidence when a signal appears and also helps when looking back.  The   Key level wedge MT5   includes an on/off button on the chart to easily keep the charts cle
Was: $249  Now: $99   Market Profile defines a number of day types that can help the trader to determine market behaviour. A key feature is the Value Area, representing the range of price action where 70% of trading took place. Understanding the Value Area can give traders valuable insight into market direction and establish the higher odds trade. It is an excellent addition to any system you may be using. Inspired by Jim Dalton’s book “Mind Over Markets”, this indicator is designed to suit the
This is a crossover using two Volume Weighted Average Price (VWAP) lines. VWAP is calculating the sum of price multiplied by volume, divided by total volume. the average is then a simple moving average of the average price over the given period. This indicator can be used as a dual baseline, or as a crossover on different lengths. It can change on the crossover or if the price is above/below the lines. Use the crossover as signals for entering a trade in the long or short direction. Parameters:
The professional tool of stock traders in now available on MetaTrader 5 . The Actual depth of market chart indicator visualizes the depth of market in the form of a histogram displayed on a chart, which refreshes in the real-time mode. Meet new updates according to user requests! Now Actual Depth of Market indicator displays the current ratio of volume of buy and sell requests (B/S ratio). It shows the share of volume of each type of requests in the entire flow of requests as well as the absol
KT Volume Profile MT5
KEENBASE SOFTWARE SOLUTIONS
3 (2)
KT Volume Profile shows the volume accumulation data as a histogram on the y-axis providing an ability to find out the trading activity over specified time periods and price levels. Point of Control (POC) in a Volume Profile POC represents a price level that coincides with the highest traded volume within the whole volume profile histogram. POC is mostly used as a support/resistance or as an essential price level where market retest before going in a specific direction. Features Very easy
The Volume Weighted ATR indicator is a helpful tool for measuring market activity. It is based on the idea of the Volume-Weighted ATR. Combining these two elements helps identify potential turning points or breakout opportunities. The indicator for the classification of the activity of the market uses the moving average and its multiples. Accordingly, where the VWATR bar is located (relative to the moving average), it is labelled as ultra-low, low, average, high, very high or ultra high. The Vo
FREE
Value Chart Candlesticks
Flavio Javier Jarabeck
4.67 (9)
The idea of a Value Chart indicator was presented in the very good book I read back in 2020 , " Dynamic Trading Indicators: Winning with Value Charts and Price Action Profile ", from the authors Mark Helweg and David Stendahl. The idea is simple and the result is pure genius: Present candlestick Price analysis in a detrended way! HOW TO READ THIS INDICATOR Look for Overbought and Oversold levels. Of course, you will need to test the settings a lot to find the "correct" one for your approach.
FREE
This indicator allows you to enjoy the two most popular products for analyzing request volumes and market deals at a favorable price: Actual Depth of Market Chart Actual Tick Footprint Volume Chart This product combines the power of both indicators and is provided as a single file. The functionality of Actual COMBO Depth of Market AND Tick Volume Chart is fully identical to the original indicators. You will enjoy the power of these two products combined into the single super-indicator! Below is
Order Book, known also as Market Book, market depth, Level 2, - is a dynamically updated table with current volumes of orders to buy and to sell specific financial instument at price levels near Bid and Ask. MetaTrader 5 provides the means for receiving market book from your broker, but in real time only, without access to its history. The indicator OrderBook Cumulative Indicator accumulates market book data online and visualizes them on the chart. In addition, the indicator can show the market
Description The indicator uses market profile theory to show the most relevant trading zones, on a daily basis. The zones to be shown are LVN (low volume nodes) and POC (point of control). An LVN zone is one which represents price areas with the least time or volume throughout the day. Typically, these areas indicate a supply or demand initiative, and in the future, they can turn into important breakout or retracement zones. A POC zone is one which represents price areas with the most time or vo
One of the Best Volume Indicators, with the addition of a Moving Average for weighting volume over time average. If the "Current Candle" Volume is X% greater than the Moving Average value, we will have a sign of increasing volume. It can be a sign of Beginning, Continuity, Reversal or Exhaustion of the Movement. Fully configurable and all options open, you can color and set ALL values as you see fit. The 'Volume Break' shows volume bars in the same color as the candlestick, in addition
The indicator measures and displays the difference in the number of "Bid" and "Ask"  prices changes in the form of digital, analog and graphic indicators. Designed for market research and for determine the moments of position closing during scalping trade with H1 or less timeframe. Use with bigger timeframe is not prohibited, but it is not informative because of a large number of accumulated values. Theory "Bid" and "Ask" prices do not change simultaneously for most symbols. Often you can see h
True Weis Wave
Atila Goncalves Firmino
A version based on David Waves' description in his book 'Trade About to Happen' of his adaptation of the Wyckoff wave chart. The indicator directionally accumulates volume, adding to each brick or candle close, with color indication for up and down. it can be used it with tick or real volume, it also changes color when the accumulated value of the previous wave is exceeded, being the trade signal. Yellow color is used for doji candlestick, it will continue with accumulation without zero the sum
GRat Clusters  is an indicator that shows various data in the form of clusters on a price chart: volume, delta, ratio of sales and purchases, etc. It allows you to visually see the market profile in real time and on history at a given depth. Capabilities 1.8 types of cluster data: volume, delta, purchases   and sales , volume and delta, imbalance between sales and purchases , volume profile, delta profile, buy and sell profile. 2. A cluster period can be either any available in MT5 timeframe or
VWAP Simple
Deibson Carvalho
4.03 (33)
The Volume Weighted Average Price is similar to a moving average, except volume is included to weight the average price over a period.    Volume-Weighted Average Price [VWAP] is a dynamic, weighted average designed to more accurately reflect  a security’s true average price over a given period . Mathematically, VWAP is the summation of money (i.e., Volume x Price) transacted divided by the total volume over any time horizon, typically from market open to market close. VWAP reflects the capital
FREE
Market Marker MT5
Evgeny Shevtsov
3.8 (5)
The indicator displays peak levels of activity formed by the maximum volume, tracks the correlation of the candles on all timeframes (from the highest to the lowest one). Each volume level is a kind of key trading activity. The most important cluster is inside a month, week, day, hour, etc. Indicator operation features A volume level receives Demand status if the nearest volume level located to the left and above has been broken upwards. A volume level receives Supply status if the nearest vol
White Weis Volume Ticks
Ricardo Almeida Branco
5 (3)
White Weis Volume This indicator shows the sum of the volume in each wave, bulish or bearish, as idealized by David Weis , but it brings an important addition , which is the marking of the bar with the highest volume of the wave (White Bar)! In coding the indicator, it was sought to optimize the code to require minimal processing during use and not to overload mt5. The indicator can be used for pre-trading analysis and study, where the trader analyzes possible points of support and resi
Tik Tok
Ivan Simonika
The Tik Tok indicator was created on the basis of the original extreme search indicators, the indicator is well suited for determining a reversal or a big sharp jerk in one direction, thanks to it you will know when this happens it will notify you when a blue dot for buying red for sale appears. It basically uses the process of detecting the rate of change in price growth and allows you to find entry and exit points from the market. fundamental technical indicator that allows you to assess th
Les acheteurs de ce produit ont également acheté
Tout d'abord, il convient de souligner que ce système de trading est un indicateur non repeint, non redessiné et non retardé, ce qui le rend idéal pour le trading manuel et automatisé. Le "Système de Trading Smart Trend MT5" est une solution de trading complète conçue pour les traders débutants et expérimentés. Il combine plus de 10 indicateurs premium et propose plus de 7 stratégies de trading robustes, ce qui en fait un choix polyvalent pour différentes conditions de marché. Stratégie de suivi
Atomic Analyst MT5
Issam Kassas
4.82 (11)
Tout d'abord, il convient de souligner que cet indicateur de trading n'est ni repainting, ni redrawing et ne présente aucun délai, ce qui le rend idéal à la fois pour le trading manuel et automatisé. L'Analyste Atomique est un indicateur d'action sur les prix PA qui utilise la force et le momentum du prix pour trouver un meilleur avantage sur le marché. Équipé de filtres avancés qui aident à éliminer les bruits et les faux signaux, et à augmenter le potentiel de trading. En utilisant plusieur
FX Volume MT5
Daniel Stein
4.94 (17)
Obtenez votre mise à jour quotidienne du marché avec des détails et des captures d'écran via notre Morning Briefing ici sur mql5 et sur Telegram ! FX Volume est le PREMIER et SEUL indicateur de volume qui fournit un VRAI aperçu du sentiment du marché du point de vue d'un courtier. Il fournit des informations impressionnantes sur la façon dont les acteurs institutionnels du marché, comme les courtiers, sont positionnés sur le marché des changes, bien plus rapidement que les rapports COT. Voir c
Quantum Trend Sniper
Bogdan Ion Puscasu
5 (37)
Présentation       Quantum Trend Sniper Indicator   , l'indicateur révolutionnaire MQL5 qui transforme la façon dont vous identifiez et négociez les inversions de tendance ! Développé par une équipe de traders expérimentés avec une expérience commerciale de plus de 13 ans,       Indicateur Quantum Trend Sniper       est conçu pour propulser votre parcours de trading vers de nouveaux sommets grâce à sa manière innovante d'identifier les inversions de tendance avec une précision extrêmement élevée
Trend Screener Pro MT5
STE S.S.COMPANY
4.89 (61)
Indicateur de tendance, solution unique révolutionnaire pour le trading et le filtrage des tendances avec toutes les fonctionnalités de tendance importantes intégrées dans un seul outil ! Il s'agit d'un indicateur multi-période et multi-devises 100 % non repeint qui peut être utilisé sur tous les symboles/instruments : forex, matières premières, crypto-monnaies, indices et actions. Trend Screener est un indicateur de suivi de tendance efficace qui fournit des signaux de tendance fléchés avec des
Tout d'abord, il convient de souligner que cet outil de trading est un indicateur non repeint, non redessiné et non retardé, ce qui le rend idéal pour le trading professionnel. L'indicateur Smart Price Action Concepts est un outil très puissant à la fois pour les nouveaux et les traders expérimentés. Il regroupe plus de 20 indicateurs utiles en un seul, combinant des idées de trading avancées telles que l'analyse du trader Inner Circle et les stratégies de trading Smart Money Concepts. Cet in
Top indicator for MT5   providing accurate signals to enter a trade without repainting! It can be applied to any financial assets:   forex, cryptocurrencies, metals, stocks, indices .  Watch  the video  (6:22) with an example of processing only one signal that paid off the indicator! MT4 version is here It will provide pretty accurate trading signals and tell you when it's best to open a trade and close it. Most traders improve their trading results during the first trading week with the help of
FX Power MT5 NG
Daniel Stein
5 (4)
Obtenez votre mise à jour quotidienne du marché avec des détails et des captures d'écran via notre Morning Briefing ici sur mql5 et sur Telegram ! FX Power MT5 NG est la nouvelle génération de notre très populaire indicateur de force des devises, FX Power. Et qu'est-ce que ce compteur de force de nouvelle génération offre ? Tout ce que vous avez aimé de l'original FX Power PLUS Analyse de la force de l'OR/XAU Des résultats de calcul encore plus précis Périodes d'analyse configurables individuel
RelicusRoad Pro MT5
Relicus LLC
4.82 (22)
Maintenant 147 $ (augmentant à 499 $ après quelques mises à jour) - Comptes illimités (PCS ou Mac) Manuel d'utilisation RelicusRoad + Vidéos de formation + Accès au groupe Discord privé + Statut VIP UNE NOUVELLE FAÇON DE REGARDER LE MARCHÉ RelicusRoad est l'indicateur de trading le plus puissant au monde pour le forex, les contrats à terme, les crypto-monnaies, les actions et les indices, offrant aux traders toutes les informations et tous les outils dont ils ont besoin pour rester renta
Auto Order Block with break of structure based on ICT and Smart Money Concepts Futures Break of Structure ( BoS )             Order block ( OB )            Higher time frame Order block / Point of Interest ( POI )    shown on current chart           Fair value Gap ( FVG ) / Imbalance   ,  MTF      ( Multi Time Frame )    Volume Imbalance     ,  MTF          vIMB Gap’s Equal High / Low’s     ,  MTF             EQH / EQL Liquidity               Current Day High / Low           HOD /
XQ Indicator MetaTrader 5
Marzena Maria Szmit
5 (1)
Step into the realm of Forex trading with confidence and precision using XQ, a cutting-edge Forex indicator designed to elevate your trading game to unprecedented heights. Whether you're a seasoned trader or just stepping into the world of currency exchange, XQ Forex Indicator empowers you with the insights and signals needed to make informed trading decisions. The signal conditions are a combination of three indicators, and XQ Forex Indicator only display  medium and long-term trends . The ind
Blahtech Supply Demand MT5
Blahtech Limited
4.57 (14)
Was: $299  Now: $99   Supply Demand uses previous price action to identify potential imbalances between buyers and sellers. The key is to identify the better odds zones, not just the untouched ones. Blahtech Supply Demand indicator delivers functionality previously unavailable on any trading platform. This 4-in-1 indicator not only highlights the higher probability zones using a multi-criteria strength engine, but also combines it with multi-timeframe trend analysis, previously confirmed swings
Advanced Supply Demand MT5
Bernhard Schweigert
4.53 (15)
La meilleure solution pour tout commerçant débutant ou expert ! Cet indicateur est un outil de trading unique, de haute qualité et abordable car nous avons intégré un certain nombre de fonctionnalités propriétaires et une nouvelle formule. Avec cette mise à jour, vous pourrez afficher des zones à double horaire. Vous pourrez non seulement afficher un TF plus élevé, mais afficher les deux, le graphique TF, PLUS le TF supérieur : AFFICHAGE DES ZONES NICHÉES. Tous les traders Supply Demand vont ado
ICT, SMC, SMART MONEY CONCEPTS, SMART MONEY, Smart Money Concept, Support and Resistance, Trend Analysis, Price Action, Market Structure, Order Blocks, BOS/CHoCH,   Breaker Blocks ,  Momentum Shift,   Supply&Demand Zone/Order Blocks , Strong Imbalance,   HH/LL/HL/LH,    Fair Value Gap, FVG,  Premium  &   Discount   Zones, Fibonacci Retracement, OTE, Buy Side Liquidity, Sell Side Liquidity, BSL/SSL Taken, Equal Highs & Lows, MTF Dashboard, Multiple Time Frame, BigBar, HTF OB, HTF Market Structure
L'indicateur de Carré Gann est un puissant outil d'analyse du marché basé sur l'article "Formule Mathématique pour les Prédictions de Marché" écrit par W.D. Gann. Cet outil utilise des concepts mathématiques et des théories de Gann pour réaliser une analyse précise du marché. Il utilise les carrés de 144, 90, 52 et aussi le carré de 9. De plus, il intègre la méthode du  pour le carré de 9 et sa relation avec les canaux et le modèle en étoile de ce carré. Manuel d'Utilisateur et Application : Ava
AW Trend Predictor MT5
AW Trading Software Limited
4.76 (54)
La combinaison des niveaux de tendance et de panne dans un seul système. Un algorithme d'indicateur avancé filtre le bruit du marché, détermine la tendance, les points d'entrée, ainsi que les niveaux de sortie possibles. Les signaux indicateurs sont enregistrés dans un module statistique, qui vous permet de sélectionner les outils les plus appropriés, montrant l'efficacité de l'historique des signaux. L'indicateur calcule les marques Take Profit et Stop Loss. Manuel et instruction ->   ICI   / v
Le profit de la structure du marché change à mesure que le prix s'inverse et recule. L'indicateur d'alerte d'inversion de la structure du marché identifie le moment où une tendance ou un mouvement de prix approche de l'épuisement et est prêt à s'inverser. Il vous avertit des changements dans la structure du marché qui se produisent généralement lorsqu'un renversement ou un recul majeur est sur le point de se produire. L'indicateur identifie initialement les cassures et la dynamique des prix,
The Volume by Price Indicator for MetaTrader 5 features Volume Profile and Market Profile TPO (Time Price Opportunity). Get valuable insights out of currencies, equities and commodities data. Gain an edge trading financial markets. Volume and TPO histogram bar and line charts. Volume Footprint charts. TPO letter and block marker charts including split structures. Versatile segmentation and compositing methods. Static, dynamic and flexible ranges with relative and/or absolute visualizations. Lay
Présentation       Quantum Breakout PRO   , l'indicateur révolutionnaire MQL5 qui transforme la façon dont vous négociez les zones d'évasion ! Développé par une équipe de traders expérimentés avec une expérience commerciale de plus de 13 ans,       Évasion quantique PRO       est conçu pour propulser votre parcours commercial vers de nouveaux sommets grâce à sa stratégie de zone de discussion innovante et dynamique. Quantum Breakout Indicator vous donnera des flèches de signalisation sur le
TrendLine PRO MT5
Evgenii Aksenov
4.78 (49)
The Trend Line PRO indicator is an independent trading strategy. It shows the trend change, the entry point to the transaction, as well as automatically calculates three levels of Take Profit and Stop Loss protection Trend Line PRO is perfect for all Meta Trader symbols: currencies, metals, cryptocurrencies, stocks and indices Advantages of Trend Line PRO Never redraws its signals The possibility of using it as an independent strategy It has three automatic levels Take Profit and Stop Loss lev
Owl Smart Levels MT5
Sergey Ermolov
4.47 (36)
Version MT4   |  FAQ L' indicateur Owl Smart Levels est un système de trading complet au sein d'un seul indicateur qui comprend des outils d'analyse de marché populaires tels que les fractales avancées de Bill Williams , Valable ZigZag qui construit la structure d'onde correcte du marché et les niveaux de Fibonacci qui marquent les niveaux exacts d'entrée. sur le marché et les endroits où prendre des bénéfices. Description détaillée de la stratégie Mode d'emploi de l'indicateur Conseiller-Assis
Gartley Hunter Multi
Siarhei Vashchylka
5 (5)
Gartley Hunter Multi - An indicator for searching for harmonic patterns simultaneously on dozens of trading instruments and on all classic timeframes: (m1, m5, m15, m30, H1, H4, D1, Wk, Mn). Manual (Be sure to read before purchasing) | Version for MT4 Advantages 1. Patterns: Gartley, Butterfly, Shark, Crab. Bat, Alternate Bat, Deep Crab, Cypher 2. Simultaneous search for patterns on dozens of trading instruments and on all classic timeframes 3. Search for patterns of all possible sizes. Fr
Trend Line Map Pro MT5
STE S.S.COMPANY
4.67 (9)
Trend Line Map indicator is an addons for   Trend Screener Indicator . It's working as a scanner for all signals generated by Trend screener ( Trend Line Signals ) . It's a Trend Line Scanner based on Trend Screener Indicator.  If you don't have Trend Screener Pro Indicator,   the Trend Line Map Pro will not work.     LIMITED TIME OFFER : Trend Line Map Indicator is available for only 50 $ and lifetime. ( Original price 125$ ) By accessing to our MQL5 Blog,  you can find all our premium indica
TrendDecoder Premium MT5
Christophe, Pa Trouillas
5 (1)
Identifiez les ranges et les tendances fortes  |  Obtenez les premiers signaux   |    Obtenez des TP et des sorties   clairs   |    Repérer les niveaux Fibo que le prix va tester   |  Indicateur qui ne retrace pas, non retardé - idéal pour le trading manuel et automatisé - adapté à tous les actifs et à toutes les unités de temps - 50% discount   pour le lancement - puis retour à >>   149 $ Après votre achat,   contactez-moi sur ce canal  pour obtenir les réglages recommandés. Version MT4 :   cli
MetaBands M5
Vahidreza Heidar Gholami
4.67 (3)
MetaBands uses powerful and unique algorithms to draw channels and detect trends so that it can provide traders with potential points for entering and exiting trades. It’s a channel indicator plus a powerful trend indicator. It includes different types of channels which can be merged to create new channels simply by using the input parameters. MetaBands uses all types of alerts to notify users about market events. Features Supports most of the channel algorithms Powerful trend detection algorith
TPSpro TRENDPRO  - is a trend indicator that automatically analyzes the market and provides information about the trend and each of its changes, as well as giving signals for entering trades without redrawing! The indicator uses each candle, analyzing them separately. referring to different impulses - up or down impulse. Exact entry points into transactions for currencies, crypto, metals, stocks, indices!  -  Version MT4                  DETAILED DESCRIPTION        /       TRADING SETUPS       
Dessine automatiquement les niveaux de support et de résistance PLUS les écarts des bougies de propulsion sur votre graphique, afin que vous puissiez voir où le prix est susceptible de se diriger ensuite et/ou de s'inverser potentiellement. Cet indicateur est conçu pour être utilisé dans le cadre de la méthodologie de trading de position enseignée sur mon site web (The Market Structure Trader) et affiche des informations clés pour le ciblage et les entrées potentielles. MT4 Version:  https://
Golden Spikes Detector
Batsirayi L Marango
5 (1)
Golden Spikes Detector Cet indicateur est basé sur une stratégie avancée principalement pour les pics de trading sur les indices Boom et Crash. Des algorithmes complexes ont été mis en œuvre pour détecter uniquement les entrées à forte probabilité. Il alerte sur les entrées potentielles d’achat et de vente. Pour échanger des pics sur le courtier Deriv ou Binary, prenez uniquement les alertes Buy Boom et Sell Cash. Il a été optimisé pour être chargé sur une période de 5 minutes, bien qu'une analy
IX Power MT5
Daniel Stein
5 (2)
IX Power   apporte enfin la précision imbattable de FX Power aux symboles non-Forex. Il détermine avec précision l'intensité des tendances à court, moyen et long terme de vos indices, actions, matières premières, ETF et même crypto-monnaies préférés. Vous pouvez   analyser tout ce que   votre terminal a à offrir. Essayez-le et découvrez comment   votre timing s'améliore considérablement   lors de vos transactions. Caractéristiques principales d'IX Power Résultats de calcul précis à 100 %,
Smart Peak Bottom
Xiaoyu Huang
5 (2)
Il s'agit d'un indicateur clair pour juger des hauts et des bas, et cela fonctionne bien pour le marché oscillant. Prix promotionnel 49$ → 59$ caractéristiques bon pour juger des hauts et des bas Pas de redessin, pas de dérive Calcul rapide, pas de décalage Mode de rappel riche Plusieurs paramètres et couleurs peuvent être ajustés paramètre "======== Principal ========" HighLowPeriod1 = 9 HighLowPeriod2 = 60 HighLowPeriod3 = 34 HighLowEMAPeriod = 4 MASignalPeriod = 5 "======== Notifier ==
Plus de l'auteur
La Moyenne Mobile Pondérée par le Volume (VW-MA) est une moyenne mobile pondérée par le volume. Les moyennes mobiles standard utilisent les prix et ignorent simplement les volumes échangés. L'indicateur de moyenne mobile pondérée en fonction du volume répond à cela. Notez que contrairement au marché boursier, le marché des changes n'est pas centralisé. Les commandes et les volumes ne sont pas partagés entre les courtiers. Par conséquent, les volumes utilisés dans la moyenne mobile pondérée
Le Twiggs Money Flow Index a été créé par Collin Twiggs. Il est dérivé de l'indice Chaikin Money Flow mais utilise de vraies plages au lieu de hauts moins bas pour éviter les pics dus aux écarts. Il utilise également une moyenne mobile exponentielle de lissage pour empêcher les pics de volumes de modifier les résultats. La moyenne mobile exponentielle est celle décrite par Welles Wilder pour plusieurs de ses indicateurs. Lorsque l'indice Twiggs Money Flow est supérieur à 0, les joueurs s'accu
L'indice de flux monétaire est un indicateur à plusieurs périodes qui affiche l'indice de flux monétaire de n'importe quelle période. Il vous aide à vous concentrer sur les flux d'argent à long terme avant d'utiliser les flux d'argent de la période actuelle. Vous pouvez ajouter autant d'indices de flux monétaires - Plusieurs périodes que vous le souhaitez. Référez-vous aux captures d'écran pour voir les indices de flux d'argent M30 / H1 / H4 dans la même fenêtre par exemple.
Nouvel Indicateur d'Enthousiasme de la Tendance (TEI), l'outil ultime pour maximiser les profits sur les marchés. Cet indicateur innovant combine la puissance de l'analyse des tendances avec l'excitation du sentiment du marché, offrant aux traders un avantage unique sur les marchés financiers en constante évolution. Le TEI utilise des algorithmes avancés pour analyser la tendance sous-jacente d'un instrument financier et l'enthousiasme des traders pour identifier les opportunités de profit
Le Golden Pattern est une configuration à 3 chandeliers basée sur le nombre d'or de la séquence de Fibonacci. Le nombre d'or est de 1,618. Ses variations incluent 0,618, 2,618 et 3,618. Dans cet indicateur, les résultats sont les meilleurs avec 2,618. Le modèle Golden est composé d'une bougie normale, suivie d'une bougie plus grande, avec un prix de clôture au moins 2,618 fois la taille de la première bougie. Le motif doré haussier est constitué de bougies haussières, tandis que le mo
Filtrer:
Aucun avis
Répondre à l'avis
Version 2.0 2022.02.15
L'indicateur a été recompilé en version 64 bits.