• 미리보기
  • 리뷰
  • 코멘트 (5)
  • 새 소식

Square of 9 for all

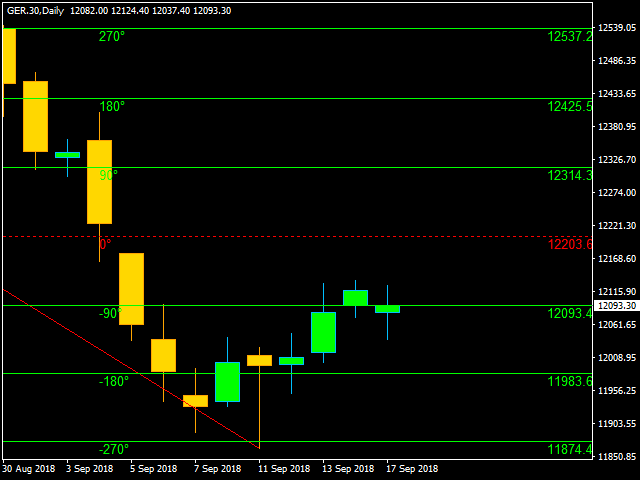
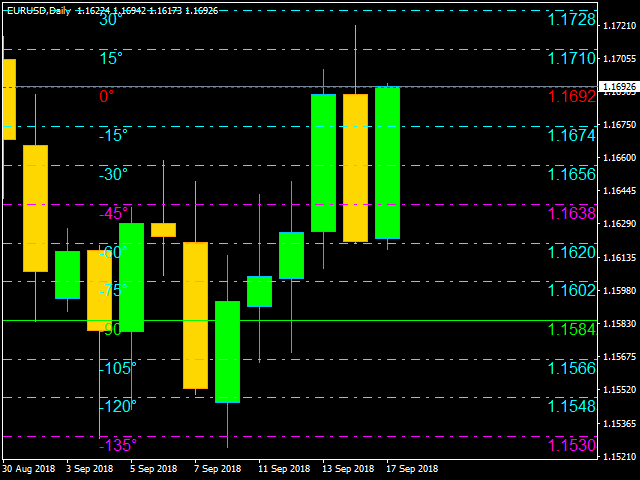
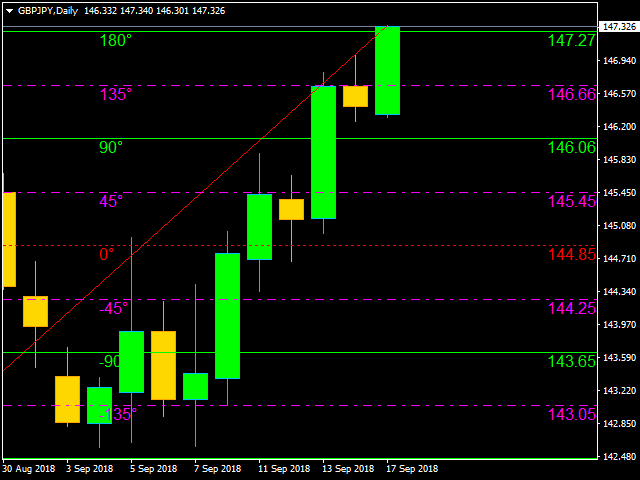
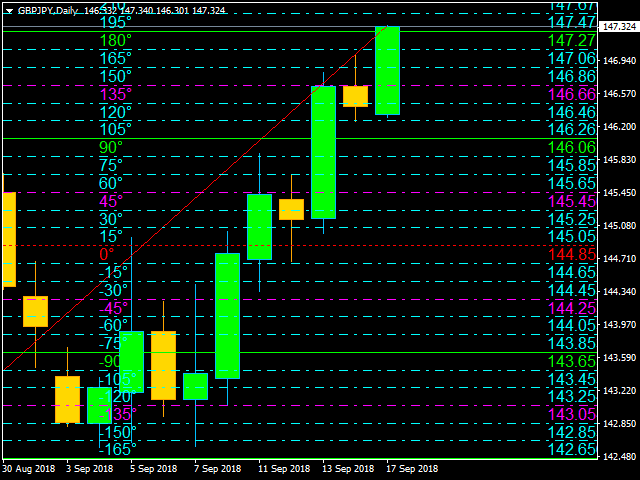
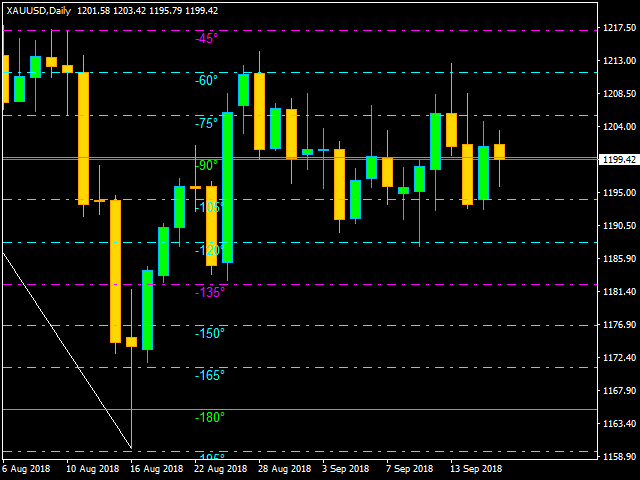
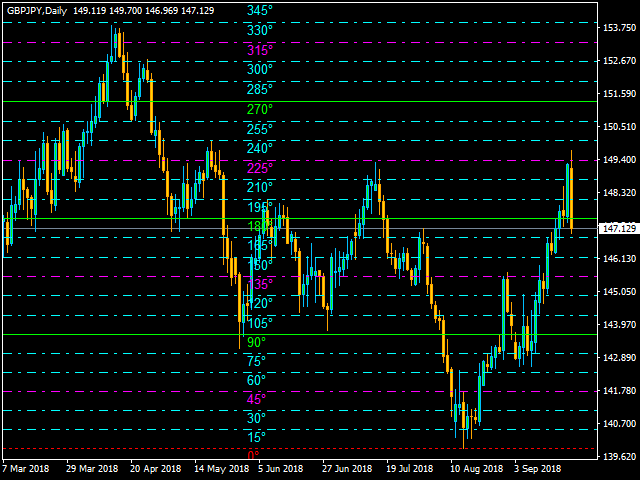
Welcome all to the famous Gann's "Square Of 9"!!

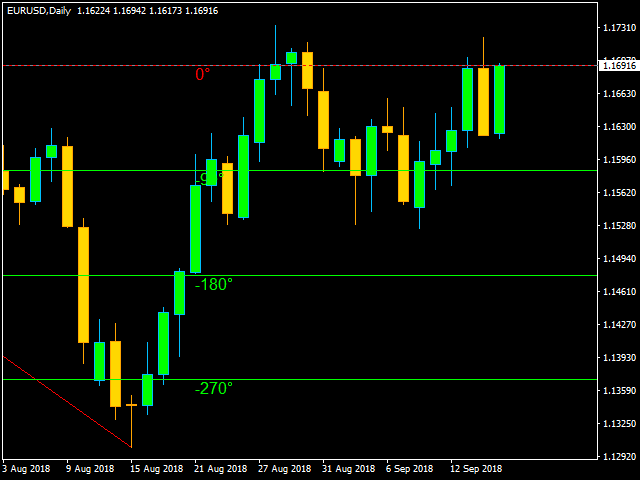
This method was used by one of the best traders in the history, a person who made his way among the top traders. An "Holy Grail" for whoever wants to learn trading. The "Square of 9" was used by this genius to find the market's future supports and future resistances. Nowadays is possible to find them with just a click, thanks to softwares. At the time Gann was using just his set of square and goniometer!! Gann describes, partially, the tecnique on the book "45 years in wall street". "One of the greatest discoveries I ever made was how to figure the percentage of high and low prices on the averages and individual stocks. The percentage of extreme high and low levels indicate future resistance levels"(45 y. in W.S., page 30). When Gann was trading, the prices had a lesser value than today. This means that the "magic goniometer" has to adapt itself to nowaday market. The adjustement is done using a variable named K, which will modify the "Square of 9" formula referring to market's price itself. With this indicator is possible to use the "Key variable" automatically or changing it manually setting "Allow Automatic K" on false. P.N.: The lesser is the price value, the more you have to improve the K value. The K value has to be reduced dividing it to ten or improved it multiplying it to ten. Gann suggests to use the Square of 9 on the last movement of the market. With this indicator you'll be able to analyze either the last swing or the previous because, in most of the cases, the current swing (last one) is still forming. For this reason the indicator will draw also the movement that is analyzing, basing on Swing Settings. You can use the median price, a weighted price on the most recent point (Weighted price), the swing's minimum price (minimum), the swing's maximum price (maximum) or set a starting price (0°) manually. The "Square of 9" levels used by Gann were, in particular, the last that you can find on the input parameters (90°180°270°360°).

Input Parameters:

  • Deviation: Deviation to calculate the swing;
  • Wave To Analyze: Choose the swing to analyze, you can choose between the last or the previous one;
  • Wave Color: Choose the swing color;
  • Wave Style: Choose the swing width;
  • Square of 9 0°price: Choose median, weighted price, swing's minimum, swing's maximum or set it manually;
  • Set 0° By User: Choose your favourite 0° price (starting price for square of 9);
  • Time To Show: Choose your favourite timeframe to analyze for Square of 9;
  • Allow Automatic K: if true, the K will be automatic; if false K will be set manually by the user;
  • K value: Insert K value if you choose false on Allow Automatic K;
  • Font Type: Choose your favourite Font type;
  • Levels Font Size: Choose your favourite Font size for levels;
  • Values Font Size: Choose your favourite Font size for prices;
  • 0°Visible: Choose to see or not 0 level;
  • 0° color: Choose your favourite color for 0 level;
  • 0° Style: Choose your favourite style for 0 level;
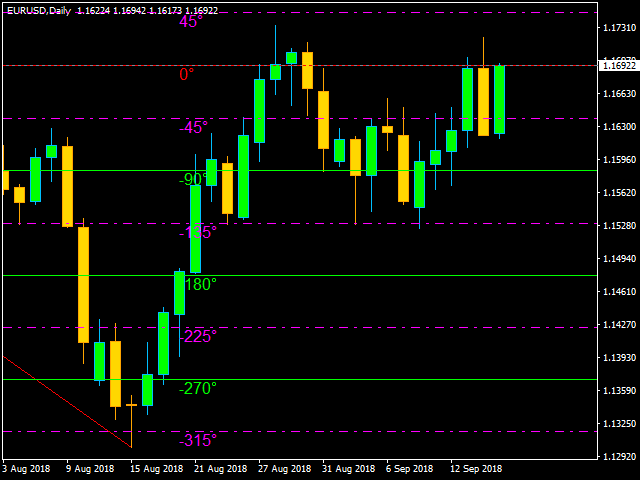
  • Show 18°36°54°etc.: Choose to see or not 18°36°54°etc. levels;
  • 18°36°54°etc.Color: Choose your favourite color for 18°36°54°etc. levels;
  • 18°36°54°etc.Style: Choose your favourite style for 18°36°54°etc. levels;
  • Show 15°30°60°etc.: Choose to see or not 15°30°60°etc. levels;
  • 15°30°60°etc.Color: Choose your favourite color for 15°30°60°etc. levels;
  • 15°30°60°etc.Style: Choose your favourite style for 15°30°60°etc. levels;
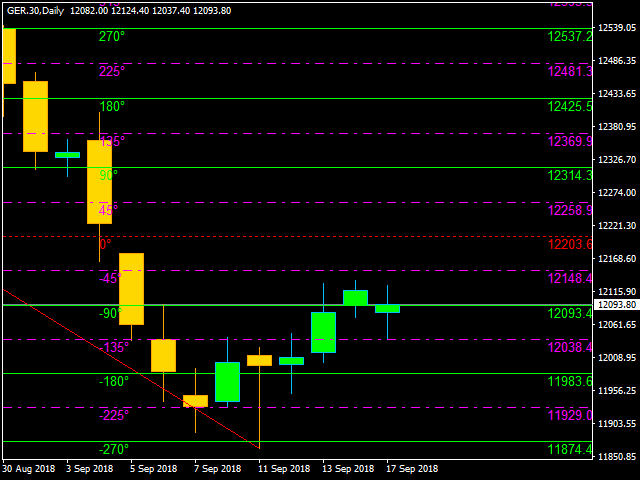
  • Show 45°135°225°315°: Choose to see or not 45°135°225°315° levels;
  • 45°135°225°315°Color: Choose your favourite color for 45°135°225°315° levels;
  • 45°135°225°315° Style: Choose your favourite style for 45°135°225°315° levels;
  • Show 90°180°270°360°: Choose to see or not 90°180°270°360° levels;
  • 90°180°270°360°Color: Choose your favourite color for 90°180°270°360° levels;
  • 90°180°270°360° Style: Choose your favourite style for 90°180°270°360° levels;


추천 제품
The Sextet Scalper Pro  is an MT4 indicator that gives signals when new waves are starting in a trend. The trends are calculated using the original " The Sextet " indicator method. You get a free EA to trade with The Sextet Scalper Pro: Free EA . Default settings were optimized on GBPUSD H1 from 2017. EA could be tested on free demo version of The Sextet Scalper Pro, before purchase. Key Features: Uses The Sextet Trend Detection Method which is already a good strategy in itself for detecting l
30 USD
Monster Harmonic Indicator
Paul Geirnaerdt
4.65 (31)
Monster Harmonics Indicator is a harmonic pattern indicator. It recognizes Gartley, Bat, Crab, Butterfly, Cypher, White Swan, Black Swan, Shark and several other patterns. Projected patterns that are not yet completed are recognized, too. Monster even shows the PRZ (Potential Reversal Zone). Users can add their own user defined patterns to Monster. Besides the current pattern, Monster also shows all patterns in the symbols history. Monster will provide alerts for developing patterns. Introduced
79 USD
ZhiBiCCI MT4
Qiuyang Zheng
5 (1)
[ZhiBiCCI] indicators are suitable for all cycle use, and are also suitable for all market varieties. [ZhiBiCCI] Green solid line is a reversal of bullish divergence. The green dotted line is a classic bullish divergence. [ZhiBiCCI] The solid line to the red is a reverse bearish divergence. The red dotted line is a classical bearish divergence. [ZhiBiCCI] can be set in the parameters (Alert, Send mail, Send notification), set to (true) to send instant signals to the alarm window, email, in
58 USD
Power Renko MT4
Pierce Vallieres
Power Renko is an indicator which plots Renko bricks underneath the chart using a histogram. You can select the brick size and the timeframe of the Renko bricks as well as whether or not to use the close price or the high/low price of the candles. Renko bricks are based on price alone, not time, therefor the Renko bricks will not be aligned with the chart's time. They are extremely useful for trend trading and many different strategies can be formed from them. Buffers are provided allowing you t
30 USD
Chart Patterns Detect 15 patterns (Ascending Triangle, Descending Triangle, Rising Wedge, Falling Wedge, Bullish Flag, Bearish Flag, Bullish Rectangle, Bearish Rectangle Symmetrical triangle, Head and Shoulders, Inverted Head and Shoulders, Triple top, Triple Bottom, Double Top, Double Bottom) Use historical data to calculate the probability of each pattern to succeed (possibility to filter notification according to the chance of success) gives graphic indication about the invalidation level and
58 USD
Noize Absorption Index - is the manual trading system that measures the difference of pressure between bears forces and bulls forces. Green line - is a noize free index that showing curent situation. Zero value of index shows totally choppy/flat market.Values above zero level shows how powerfull bullish wave is and values below zero measures bearish forces.Up arrow appears on bearish market when it's ready to reverse, dn arrow appears on weak bullish market, as a result of reverse expectation. S
199 USD
ATeam Divergence
Hoang Ngoc Thach
The CCI Divergence is a reasonably useful indicator in itself, but it is even more effective when used with divergence pattern trading. The CCI Divergence indicator signal is one of the most potent signals among the indicators that exist in the market. Here is new version for Divergence Indicator using CCI method, with more improvements. Divergences indicate a potential investment point because the directional moment does not confirm the price. A bullish divergence occurs when the underlying
49 USD
Infinity Trend Pro
Yaroslav Varankin
1 (1)
This is a trend indicator without redrawing Developed instead of the binary options strategy (by the color of the Martingale candlestick) Also works well in forex trading When to open trades (binary options) A signal will appear in the place with a candle signaling the current candle It is recommended to open a deal for one candle of the current timeframe M1 and M5 When a blue dot appears, open a deal up When a red dot appears, open a trade down. How to open trades on Forex. When a signal is rec
1 000 USD
Forex Gump
Andrey Kozak
2.83 (6)
Forex Gump is a fully finished semi-automatic trading system. In the form of arrows, signals are displayed on the screen for opening and closing deals. All you need is to follow the instructions of the indicator. When the indicator shows a blue arrow, you need to open a buy order. When the indicator shows a red arrow, you need to open a sell order. Close orders when the indicator draws a yellow cross. In order to get the most effective result, we recommend using the timeframes H1, H4, D1. There
147 USD
Insider Scalper Binary This tool is designed to trade binary options. for short temporary spends. to make a deal is worth the moment of receiving the signal and only 1 candle if it is m1 then only for a minute and so in accordance with the timeframe. the accuracy of this tool is about to 80% for better results, you need to select well-volatile charts.... recommended currency pairs eur | usd, usd | jpy .... the indicator is already configured, you just have to add it to the chart and tra
103 USD
Genius Arrows
Mhmd Syamnd Mhmd
2 (1)
Metatrader 4의 Genius Arrows 지표는 차트에 정확한 매수 및 매도 화살표를 인쇄하는 완벽한 FX 거래 시스템입니다. 지표는 기본 MT4 차트 창에 녹색 및 빨간색 화살표로 표시됩니다. 표시등에 표시된 대로 신호를 따르기만 하면 됩니다! 거래 신호: 녹색 화살표는 매수 신호입니다. 빨간색 화살표는 매도 신호입니다. Genius Arrows 표시기는 거래 진입 및 종료 모두에 사용하거나 다른 전략 및 시스템에 대한 추세 확인 신호 표시기로 사용할 수 있습니다. 이 표시기는 모든 통화 쌍(메이저, 마이너 및 엑조틱)에서 동일하게 잘 작동하며 올바르게 사용하면 유망한 결과를 보여줍니다. 지표 예시 차트(EUR/USD H1) 아래 그림은 거래 차트에서 Genius Arrows mt4 지표가 작동하는 모습을 보여줍니다. 거래 팁: 자신이 좋아하는 거래 항목, 손절매 및 이익 실현 방법을 자유롭게 사용하여 Super Arrow Fore
30 USD
RTrends
Nikolay Likhovid
The RTrends indicator does two things: first, it automatically draws the layout of the price chart by plotting trend lines and, secondly, it produces bearish and bullish signals. The layout reflects the fractal nature of the market. Trends from different time horizons are applied simultaneously on the chart. Thus, from a single chart a trader can see trend lines of higher timeframes. The lines, depending on the horizon, differ in color and width: the older the horizon, the thicker the line is. T
60 USD
Trade with Gann on your side!! MASTER CIRCLE 360 CIRCLE CHART, originally created by Gann admitted that this is “The Mother of all charts”. It is one of the last studies that this great trader left for us. The numeric tab le is apparently quite simple like all the tables and is based on square numbers, the SQUARE OF 12 and is by evolution, one of the most important square numbers. Here we can find CYCLE, PRICE AND TIME thanks to angles and grades, to show past and future support and resistance.
149.99 USD
5 signal in 1  Product     TimeFrame   Recommend   1m-5m recommend  signal   TF  5m    Banks Pro Binary Option is Indicator for binary option Can Use Manaul Trade or Robot on Platform  Mt2Trading  https://www.mt2trading.com/?ref=104    Time Trading   good work  EU session    Recommend  Curency   EUR  GBP USD        careful   AUD JPY      Recommend  Martingale 2-5 Step   Recommend  set profit  2%-5%/Day Setting Brake  News Event High volatility   recommend  15-30 min Have Problem Contract
120 USD
To get access to MT5 version please click here . - This is the exact conversion from TradingView: "Stochastic Momentum Index" By "UCSgears". - This is a popular version of stochastic oscillator on tradingview. - This is a light-load processing and non-repaint indicator. - Buffers are available for the lines on chart. - You can message in private chat for further changes you need. Thanks for downloading
40 USD
Based on MACD indicator waves with standard parameters Applies Fibonacci levels to the last two MACD waves, positive and negative respectively, if at the moment the MACD indicator runs out of negative Wave - the color is green, if at the moment the MACD indicator runs out of positive Wave - the color is red. The Wave termination criterion is two ticks with a different MACD sign. Applies trend lines on the last four MACD Waves. Works well with the expert Figures MACD   https://www.mql5.com/ru/mar
30 USD
Trendiness Index
Libertas LLC
5 (3)
"The trend is your friend" is one of the best known sayings in investing, because capturing large trendy price movements can be extremely profitable. However, trading with the trend is often easier said than done, because many indicators are based on price reversals not trends. These aren't very effective at identifying trendy periods, or predicting whether trends will continue. We developed the Trendiness Index to help address this problem by indicating the strength and direction of price trend
49 USD
The  DYJ  CandleShape   contains 80 candlestick Patterns, such as MORNING STAR, DOJI STAR, HARAMI CROSS,INVERT HAMMER,ENGULFING..... candlestick is a valid form of market technical analysis.  The recommended short stoploss is near the highest price of the first three to five candles The recommended long   stoploss   is near the lowest price of the first three to five candles Input InpCandShapeMaxBars  = 100. InpAlert                   = true -- Enable. Alert    InpColorBull             = clrGold
100 USD
MT4 지표. 세 가지 수준의 피보나치 지원 및 저항 수준이 자동으로 그려집니다. 그들은: 월 수준: 중간 난초 주간 레벨: 오렌지 레드 데이라인 레벨: 청록색 색상은 매개변수로 조정할 수 있습니다. MT5 Version: https://www.mql5.com/EN/market/product/80068 이 지표는 주로 더 나은 거래 분석을 위해 미래 지원 및 저항 수준을 분석하는 데 사용됩니다. 지원 수준이 여러 번 효과적으로 지원되면 시장은 이전 고점을 돌파하고 유효 추세 돌파는 길 것입니다. 하락 후 시장은 여러 번 압력 수준을 초과 할 수 없으며 하락하고 이전 저가를 다시 돌파하고 효과적인 추세는 숏 포지션을 돌파합니다. 시장이 역사적 고가 또는 저가 영역에 도달하면 차트에 두 수준의 피보나치 선만 그려질 수 있으며 지표는 시장의 특정 공간을 기다려야 하기 때문에 일일 수준 프롬프트가 표시되지 않는 것이 정상입니다. 그리기 전에 후퇴하기 위
40 USD
캔들의 종가를 예측하는 지표입니다. 지표는 주로 D1 차트에서 사용하기 위한 것이. 이 지표는 전통적인 외환 거래와 바이너리 옵션 거래 모두에 적합합니다. 지표는 독립형 거래 시스템으로 사용하거나 기존 거래 시스템에 추가로 사용할 수 있습니다. 이 표시기는 현재 양초를 분석하여 양초 본체 내부의 특정 강도 요인과 이전 양초의 매개변수를 계산합니다. 따라서 지표는 시장 움직임의 추가 방향과 현재 양초의 종가를 예측합니다. 이 방법 덕분에 지표는 단기 및 중장기 거래 모두에 적합합니다. 지표를 사용하면 시장 상황을 분석하는 동안 지표가 생성할 잠재적 신호의 수를 설정할 수 있습니다. 표시기 설정에는 이를 위한 특별한 매개변수가 있습니다. 또한 인디케이터는 새로운 신호에 대해 차트의 메시지 형태, 이메일 및 PUSH 알림 형태로 알릴 수 있습니다. 구매 후 저에게 꼭 써주세요! 나는 당신에게 지표와 거래에 대한 나의 추천을 줄 것입니다! 또한 보너스를 받으세요!
65 USD
Semaphore and ABC Pattern
Stoyan Roev
4.83 (6)
The indicator places Semaphore points on the maximum and minimum of a higher, medium and lower period. It includes A,B,C Triangles for easier spotting of reversal chart pattern which occurs very frequently and has a very high success ratio. Both Semaphore and A,B,C Triangles have Alerts and Push notifications to a mobile device when they occur on the chart. These indicators are very useful for breakout trading and spotting support/resistance levels which gives good opportunities for positions.
39 USD
PZ Trend Trading
PZ TRADING SLU
4.75 (4)
Trend Trading is an indicator designed to profit as much as possible from trends taking place in the market, by timing pullbacks and breakouts. It finds trading opportunities by analyzing what the price is doing during established trends. [ Installation Guide | Update Guide | Troubleshooting | FAQ | All Products ] Trade financial markets with confidence and efficiency Profit from established trends without getting whipsawed Recognize profitable pullbacks, breakouts and early reversals The ind
125 USD
Golden Hunter MT4
Rodrigo Arana Garcia
4 (4)
$75에 마지막 사본 ---> 다음: $99 !!!  MT5 버전 Golden Hunter 는 수동으로 시장을 거래하는 트레이더를 위해 개발되었습니다. 3가지 지표로 구성된 매우 강력한 도구입니다. 강력한 진입 전략: 통화 쌍의 변동성을 측정하고 시장 추세를 식별하는 지표로 구성됩니다. LSMA: 가격 데이터를 평활화하고 단기 추세 파악에 유용합니다. Heikin Ashi: 지표가 차트에 연결되면 일본 캔들은 Heikin Ashi 캔들로 변경됩니다. 이러한 유형의 양초는 가격 정보를 부드럽게 하여 강력한 추세를 파악할 수 있도록 합니다. 형질 다시 칠하지 마십시오 이 표시기는 새 데이터가 도착해도 값을 변경하지 않습니다 스프레드가 매우 낮고 변동성이 큰 거래 쌍(EURUSD, GBPUSD, BTCUSD…). 범위(범위) 쌍을 사용하는 것은 권장되지 않습니다 기간 M5 거래 시간 시장에서 더 많은 움직임이 있고 스프레드가 낮은 시간대에 거래하는 것이 좋습
75 USD
Trend IM
Yvan Musatov
Tired of choosing indicator settings, losing precious time? Tired of uncertainty in their optimality? Scared by the unknown in their profitability? Then the Trend IM indicator is just for you. The indicator will save you a lot of time that can be spent on more useful activities, such as relaxing, but at the same time, the efficiency will increase many times over. It uses only one parameter for setting, which sets the number of bars for calculation. Trend IM is a reversal indicator and is part
99 USD
Lyne
Maksim Kalachev
About the Lyne indicator Lyne is a Metatrader 4 (MT4) indicator, the essence of which is to transform the accumulated historical data. The Lyne indicator makes it possible to detect various features and patterns in price dynamics that are invisible to the naked eye. Based on this information, traders can anticipate further price movement and adjust their strategy accordingly. This indicator has proven itself in the scalping strategy. The indicator works without repainting.
30 USD
Master scalping M1
Nataliia Marchuk
Master Scalping M1 is an innovative indicator that uses an algorithm to quickly and accurately determine the trend.The indicator calculates the time of opening and closing positions, the indicator's algorithms allow you to find the ideal moments to enter a deal (buy or sell an asset), which increase the success of transactions for most traders. Benefits of the indicator: Easy to assemble, does not overload the chart with unnecessary information. Can be used as a filter for any strategy. Works on
30 USD
HMA Trend Professional MT4
Pavel Zamoshnikov
4.57 (7)
Improved version of the free HMA Trend indicator (for MetaTrader 4) with statistical analysis. HMA Trend is a trend indicator based on the Hull Moving Average (HMA) with two periods. HMA with a slow period identifies the trend, while HMA with a fast period determines the short-term movements and signals in the trend direction. The main differences from the free version: Ability to predict the probability of a trend reversal using analysis of history data. Plotting statistical charts for analyz
30 USD
The   Strategy Tester   product is an indicator where you can both test and run strategies. There are 64 strategies in total in this indicator. It uses 3 indicators. You can test tens of thousands of strategies by changing the parameter settings of these indicators. You can run 6 strategies at the same time. With this product, you will now create your own signals. Recommendations and Features Used indicators:   Rsi, Bears power, Stochastic It works on all   time frame   Recommended time frame
49 USD
Trend Divergence Finder – индикатор, позволяющий выявлять дивергенции цены и графика выбранного индикатора. С помощью Trend Divergence Finder вы сможете подобрать тот индикатор, который наиболее эффективен для Вас, и использовать его с наглядным отображением на графике. В индикатор включены 9 базовых индикаторов : 1.        RSI 2.        MACD 3.        MOMENTUM 4.        RVI 5.        STOCHASTIC 6.        CCI 7.        Standard Deviation 8.        Derivative 9.        William Blau Присутст
69 USD
Binary Option Signal
Yaroslav Varankin
Indicator for binary options arrow is easy to use and does not require configuration works on all currency pairs, cryptocurrencies buy signal blue up arrow sell signal red down arrow tips do not trade during news and 15-30 minutes before their release, as the market is too volatile and there is a lot of noise it is worth entering trades one or two candles from the current period (recommended for 1 candle) timeframe up to m 15 recommended money management fixed lot or fixed percentage of the depo
100 USD
이 제품의 구매자들이 또한 구매함
RelicusRoad Pro
Relicus LLC
4.94 (87)
지금 $147($602 할인) - 무제한 계정 - 다음 업데이트 시 가격 인상 - 5스타 리뷰를 남기는 것을 잊지 마세요 RelicusRoad 사용 설명서 + 교육 비디오 + 비공개 Discord 그룹 액세스 + VIP 상태 시장을 보는 새로운 방법 RelicusRoad는 외환, 선물, 암호화폐, 주식 및 지수에 대한 세계에서 가장 강력한 거래 지표로서 거래자에게 수익성을 유지하는 데 필요한 모든 정보와 도구를 제공합니다. 우리는 초보자부터 고급까지 모든 거래자가 성공할 수 있도록 기술적 분석 및 거래 계획을 제공합니다. 미래 시장을 예측할 수 있는 충분한 정보를 제공하는 핵심 거래 지표입니다. 우리는 차트에서 말이 안 되는 여러 지표 대신 완전한 솔루션을 믿습니다. 타의 추종을 불허하는 매우 정확한 신호, 화살표 + 가격 조치 정보를 표시하는 올인원 표시기입니다. 강력한 AI를 기반으로 하는 RelicusRoad는 누락된 정보와 도구를 제공하여 교육하고 성공적인
147 USD
Ultimate Sniper Dashboard
Hispraise Chinedum Abraham
4.78 (18)
299달러로 할인! 추후 가격이 인상될 수 있습니다! 아래 설명을 읽어보세요! Ultimate Sniper Dashboard를 위한 최고의 엔트리 시스템: ULTIMATE DYNAMIC LEVELS. (내 제품을 확인하십시오) Ultimate Sniper Dashboard는 MT4 다중 통화 테스트 제한으로 인해 라이브 시장에서만 작동합니다. Ultimate-Sniper 대시보드를 소개합니다! HA-Sniper와 MA-Sniper를 모두 포함하는 최고의 제품입니다. 그리고 많은 특수 모드. Ultimate Sniper Dashboard는 절대 야수입니다! 초보자 또는 전문가 트레이더를 위한 최고의 솔루션! 다시 움직임을 놓치지 마세요! 단순함과 핍을 좋아하는 트레이더를 위해 특별한 제품을 준비했습니다. 본질적으로 단순한 대시보드는 여러 사용자 지정 알고리즘을 기반으로 28개의 통화 쌍을 살펴보는 모든 작업을 수행합니다. 단 하나의 차트로 전문가처럼 시장을 읽을 수 있습니다. 움직이기
299 USD
Advanced Supply Demand
Bernhard Schweigert
4.94 (285)
현재 33% 할인! 초보자나 전문 트레이더를 위한 최고의 솔루션! 이 보조지표는 우리가 다수의 독창적 기능과 새로운 공식을 통합한 독특하고 고품질이며 저렴한 거래 도구입니다. 이 업데이트를 통해 이중 시간대를 표시할 수 있습니다. 더 높은 TF를 표시할 수 있을 뿐만 아니라 차트 TF와 더 높은 TF 모두를 표시할 수 있습니다: 중첩 영역 표시. 모든 Supply Demand 트레이더들이 좋아할 것입니다. :) 중요한 정보 공개 Advanced Supply Demand의 잠재력을 극대화하려면 다음을 방문하십시오. https://www.mql5.com/ko/blogs/post/720245   진입 또는 목표의 명확한 트리거 포인트를 정확히 찾아냄으로 해서 거래가 어떻게 개선될지 상상해 보십시오. 새로운 알고리즘을 기반으로 매수자와 매도자 간의 잠재적인 불균형을 훨씬 더 쉽게 분간할 수 있습니다. 왜냐하면 가장 강한 공급영역과 가장 강한 수요 영역과 과거에 어떻게 진행 되었는지를(이
148 USD
Advanced Currency Strength28 Indicator
Bernhard Schweigert
4.92 (613)
현재 26% 할인 초보자 또는 전문가 트레이더를 위한 최고의 솔루션! 이 지표는 우리가 독점 기능과 새로운 공식을 통합했기 때문에 독특하고 고품질이며 저렴한 거래 도구입니다. 단 하나의 차트로 28 Forex 쌍의 통화 강도를 읽을 수 있습니다! 새로운 추세 또는 스캘핑 기회의 정확한 트리거 포인트를 정확히 찾아낼 수 있기 때문에 거래가 어떻게 개선될지 상상해 보십시오. 사용 설명서: 여기를 클릭  https://www.mql5.com/en/blogs/post/697384 그것이 첫 번째, 원본입니다! 쓸모없는 지망생 클론을 사지 마십시오. 더 스페셜  강력한 통화 모멘텀을 보여주는 하위 창의 화살표 GAP가 거래를 안내합니다! 기본 또는 호가 통화가 과매도/과매도 영역(외부 시장 피보나치 수준)에 있을 때 개별 차트의 기본 창에 경고 표시가 나타납니다. 통화 강도가 외부 범위에서 떨어질 때 풀백/반전 경고. 교차 패턴의 특별 경고 추세를 빠르게 볼 수 있는
148 USD
현재 20% 할인 ! 초보자 또는 전문가 트레이더를 위한 최고의 솔루션! 이 대시보드 소프트웨어는 28개의 통화 쌍에서 작동합니다. 2가지 주요 지표(Advanced Currency Strength 28 및 Advanced Currency Impulse)를 기반으로 합니다. 전체 Forex 시장에 대한 훌륭한 개요를 제공합니다. 고급 통화 강도 값, 통화 이동 속도 및 모든(9) 시간대의 28 Forex 쌍에 대한 신호를 보여줍니다. 추세 및/또는 스캘핑 기회를 정확히 파악하기 위해 차트의 단일 지표를 사용하여 전체 시장을 볼 수 있을 때 거래가 어떻게 개선될지 상상해 보십시오! 잠재적인 거래를 식별하고 확인하면서 강력한 통화와 약한 통화를 더욱 쉽게 식별할 수 있도록 이 지표에 기능을 내장했습니다. 이 표시기는 통화의 강세 또는 약세가 증가 또는 감소하는지 여부와 모든 시간대에서 수행되는 방식을 그래픽으로 보여줍니다. 추가된 새로운 기능은 현재 시장 조건 변화에 적
199 USD
Ultimate Dynamic Levels
Hispraise Chinedum Abraham
4.86 (7)
現在、ホリデーディスカウントで399ドル! 今後値上がりする可能性があります。以下の説明をお読みください。 Ultimate Dynamic Levelsの紹介 - Ultimate Sniper DashboardのBESTエントリーインジケーター! 極めてローリスクなタイムリーエントリーと高RR!!! アルティメットスナイパーダッシュボードはこちら。 初心者はもちろん、プロのトレーダーにとっても最も重要な能力は、いつどこで相場が転換するかを正確に判断し、いかに安全に参入し、利益を得て退場するかを見極めることです。 アルティメット・ダイナミック・レベルズ・インディケーターは、相場が転換する可能性が最も高い場所を簡単に教えてくれるので、極めてローリスクなトレードを自信を持って行うことができ、同時にチャートをクリーンでシンプルに保ちながら、$$$を稼ぐことができるのです! アルティメット・ダイナミック・レベルズ・インディケーターは、複数の時間枠で重要な隠れたレベルを一度に見つけるユニークで強力なアルゴリズムを持っています。また、他の典型的なSRインジケーターのように、レベ
199 USD
Entry Points Pro
Yury Orlov
4.72 (214)
다시 색을 칠하지 않고 거래에 진입할 수 있는 정확한 신호를 제공하는 MT4용 지표입니다. 외환, 암호화폐, 금속, 주식, 지수 등 모든 금융 자산에 적용할 수 있습니다. 매우 정확한 추정값을 제공하고 매수와 매도의 가장 좋은 시점을 알려줍니다. 하나의 시그널로 수익을 내는 지표의 예와 함께 비디오 (6:22)시청하십시오! 대부분의 거래자는 Entry Points Pro 지표의 도움으로 첫 거래 주 동안 트레이딩 결과를 개선합니다. 저희의   Telegram Group 을 구독하세요! Entry Points Pro 지표의 좋은점. 재도색이 없는 진입 신호 신호가 나타나고 확인되면(시그널 캔들이 완성된 경우) 신호는 더 이상 사라지지 않습니다. 여타 보조지표의 경우 신호를 표시한 다음 제거되기 때문에 큰 재정적 손실로 이어집니다. 오류 없는 거래 게시 알고리즘을 통해 트레이드(진입 또는 청산)를 할 이상적인 순간을 찾을 수 있으며, 이를 통해 이를 사용하는 모든 거래자의
125 USD
GOLD Impulse with Alert
Bernhard Schweigert
이 지표는 Advanced Currency IMPULSE with ALERT  +   Currency Strength Exotics  의 2가지 제품의 슈퍼 조합입니다. 그것은 모든 시간 프레임에 대해 작동하며 8개의 주요 통화와 하나의 기호에 대한 강약의 충동을 그래픽으로 보여줍니다! 이 표시기는 금, 이국적인 쌍, 상품, 지수 또는 선물과 같은 기호에 대한 통화 강도 가속을 표시하는 데 특화되어 있습니다. 금, 은, 오일, DAX, US30, MXN, TRY, CNH 등의 진정한 통화 강도 가속(충동 또는 속도)을 표시하기 위해 9번째 줄에 모든 기호를 추가할 수 있습니다. 새로운 기본 알고리즘을 기반으로 구축되어 잠재적인 거래를 훨씬 더 쉽게 식별하고 확인할 수 있습니다. 이는 통화의 강세 또는 약세가 가속되는지 여부를 그래픽으로 표시하고 가속 속도를 측정하기 때문입니다. 자동차의 속도계처럼 생각하면 됩니다. 가속화할 때 Forex 시장에서 동일한 일이 분명히
149 USD
Please send me Direct message on MQL5 CHAT after purchasing the Indicator for Training and Installation Support There are some additional files that is important to use with the Indicator . So be sure to contact me after purchasing the Indicator So that I can add you for training and support . If you find any difficulty with installation then send me Direct message here So that I can connect with you via Anydesk or Teamview for the product installation. " Smart Order Block Indicator " to find
249 USD
Currency Strength Exotics
Bernhard Schweigert
5 (23)
현재 20% 할인! 초보자 또는 전문가 트레이더를 위한 최고의 솔루션! 이 표시기는 Exotic Pairs Commodities, Indexes 또는 Futures와 같은 기호에 대한 통화 강도를 표시하는 데 특화되어 있습니다. 금, 은, 석유, DAX, US30, MXN, TRY, CNH 등의 진정한 통화 강도를 보여주기 위해 9번째 줄에 모든 기호를 추가할 수 있습니다. 이것은 독특하고 고품질이며 저렴한 거래 도구입니다. 우리는 많은 독점 기능과 새로운 공식을 통합했습니다. 새로운 추세 또는 스캘핑 기회의 정확한 트리거 포인트를 정확히 찾아낼 수 있기 때문에 거래가 어떻게 개선될지 상상해 보십시오. 사용 설명서: 여기를 클릭 https://www.mql5.com/en/blogs/post/708876 모든 시간대에 작동합니다. TREND를 빠르게 확인할 수 있습니다! 새로운 기본 알고리즘을 기반으로 설계되어 잠재적인 거래를 더욱 쉽게 식별하고 확인할 수 있습니다.
128 USD
Cycle Sniper
Elmira Memish
4.63 (30)
NEW YEAR SALE PRICE FOR LIMITED TIME!!! Please contact us after your purchase and we will send you the complimentary indicators to complete the system. Cycle Sniper is not a holy grail but when you use it in a system which is explained in the videos, you will feel the difference. If you are not willing to focus on the charts designed with Cycle Sniper and other free tools we provide, we recommend not buying this indicator. We recommend watching the videos about the indiactor and system before
200 USD
Supply and Demand Dashboard PRO
Bernhard Schweigert
4.79 (19)
현재 20% 할인! 이 대시보드는 여러 기호와 최대 9개의 타임프레임에서 작동하는 매우 강력한 소프트웨어입니다. 주요 지표(최상의 리뷰: 고급 공급 수요)를 기반으로 합니다.   Advanced Supply Demand 대시보드는 훌륭한 개요를 제공합니다. 다음과 같이 표시됩니다.  영역 강도 등급을 포함하여 필터링된 공급 및 수요 값, 영역에 대한/및 영역 내 Pips 거리, 중첩된 영역을 강조 표시하고 모든 (9) 시간 프레임에서 선택한 기호에 대해 4가지 종류의 경고를 제공합니다. 그것은 당신의 개인적인 필요에 맞게 고도로 구성 가능합니다! 당신의 혜택! 모든 트레이더에게 가장 중요한 질문: 시장에 진입하기에 가장 좋은 수준은 무엇입니까? 최고의 성공 기회와 위험/보상을 얻으려면 강력한 공급/수요 영역 내 또는 그 근처에서 거래를 시작하십시오. 손절매를 위한 최적의 장소는 어디입니까? 가장 안전하려면 강력한 수요/공급 구역 아래/위에 정
199 USD
Full Forex Market View Dashboard
Opengates Success International
5 (2)
전체 외환 시장 보기 대시보드 표시기 이것은 거래자에게 시장에서 일어나는 일에 대한 전체 보기를 제공하기 위해 만들어진 사용자 지정 지표입니다. 실시간 데이터를 사용하여 시장에 액세스하고 성공적인 거래에 필요한 모든 정보를 표시합니다. 설치: 이 지표를 창 차트에 첨부하기 전에 MT4의 Market Watch 패널로 이동하여 필요하지 않거나 거래하지 않는 모든 통화 쌍을 숨기고 나머지는 그대로 두십시오. 그 이유는 FFMV 대시보드가 MT4의 Market Watch에 나타나는 모든 통화 쌍을 표시하기 때문입니다. 최대 30개 이하의 통화 쌍을 표시할 수 있습니다. MT4의 Market Watch에서 그 이상이면 FFMV 대시보드의 글꼴과 이미지가 흐려지고 변형됩니다! 제대로 표시되지 않습니다. 용법:      솔로 트레이딩      바구니 거래의 경우(방법에 대한 스크린샷 참조)      다중 주문 거래에도 사용할 수 있습니다.      자신의 거래
650 USD
Weis Wave with Alert
Panagiotis Diamantopoulos
4.78 (18)
20% Off from 499$ to 399$, offer end 31/3/2023    https://youtu.be/RjSSW0byp-I ** NEW PLUTUS SIGNALS and ALL IN ONE ** Wychoff's UpThrust + Spring, Fake Breaks and Plutus  trading signals added (for more info visit  http://www.tradethevolumewaves.com  ) Different Wave Types, choose what your cumulative Histogram diplays: Volume, Pips, Progressive Volume Rate, Time or Emphasized Volume Waves  **IF YOU PURCHASE DO NOT FORGET TO CONTACT ME BECAUSE THERE IS MORE: Two Hrs Webinar + Training Room
399 USD
CyberZingFx Volume Plus
Afsal Meerankutty
4.93 (15)
Advanced version of CyberZingFx Volume Plus, the ultimate MT4 indicator for traders seeking highly accurate buy and sell signals. With an additional strategy and price action dot signals that enhances its effectiveness, this indicator offers a superior trading experience for professionals and beginners alike. The CyberZingFx Volume Plus Advanced version combines the power of volume analysis and historical price data with an additional strategy, resulting in even more precise and reliable signals
135 USD
Scalper Inside PRO
Alexey Minkov
4.67 (42)
This is an innovative indicator that uses an exclusive algorithm to quickly and accurately determine the trend. The indicator automatically calculates the opening and closing time of positions, as well as detailed statistics of the indicator's performance for a certain period of history, which allows you to choose the best trading tool for your trade. You can also connect your custom arrow indicators to Scalper Inside Pro to check and calculate their statistics and profitability. Scalper Inside
139 USD
Gann Dynamic Square
Naveen Saroha
5 (1)
INTRODUCING WORLD'S FIRST MT4 & MT5  Gann Dynamic Square, Circle and Equilateral Triangle  To Analyze Market Geometric Relationship. Gann Dynamic Square  has some of the most impressive features you will ever find in Gann & Geometric Analysis world. The Gann Dynamic Square is a tool to draw offset Square,Equilateral Triangle & Circle.Most charting software or MT4/MT5 market indicators don't have these features. You will be able draw your Geometric shapes like a professional geometric analys
399 USD
Volume by Price MT4
Brian Collard
5 (14)
The Volume by Price Indicator for MetaTrader 4 features Volume Profile and Market Profile TPO (Time Price Opportunity). Get valuable insights out of currencies, equities and commodities data. Gain an edge trading financial markets. Highest quality real-time and historical price data distributions. Versatile range selection methods. Drag and drop with time/price option. Unlimited segmentation. Session filtering with built-in presets for New York, London, Tokyo, Sydney and São Paulo. Composites w
149.95 USD
PZ Day Trading
PZ TRADING SLU
3.67 (3)
This indicator detects price reversals in a zig-zag fashion, using only price action analysis and a donchian channel. It has been specifically designed for short-term trading, without repainting or backpainting at all. It is a fantastic tool for shrewd traders aiming to increase the timing of their operations. [ Installation Guide | Update Guide | Troubleshooting | FAQ | All Products ] Amazingly easy to trade It provides value on every timeframe It provides suitable SL and TP levels It impl
125 USD
Blahtech Supply Demand
Blahtech Limited
4.62 (34)
Supply Demand uses previous price action to identify potential imbalances between buyers and sellers. The key is to identify the better odds zones, not just the untouched ones. Blahtech Supply Demand indicator delivers functionality previously unavailable on any trading platform. This 4-in-1 indicator not only highlights the higher probability zones using a multi-criteria strength engine, but also combines it with multi-timeframe trend analysis, previously confirmed swings and engulfing detector
142 USD
Introduction to EFW Analytics EFW Analytics was designed to accomplish the statement "We trade because there are regularities in the financial market". EFW Analytics is a set of tools designed to maximize your trading performance by capturing the repeating fractal geometry, known as the fifth regularity in the financial market. The functionality of EFW Analytics consists of three parts. Firstly, Equilibrium Fractal Wave Index is an exploratory tool to support your trading logic to choose which r
200 USD
Best Currency Strength Indicator
Tumelo Rakotsoane
4.54 (46)
Advanced Currency Strength Indicator The Advanced Divergence Currency Strength Indicator. Not only it breaks down all 28 forex currency pairs and calculates the strength of individual currencies across all timeframes , but, You'll be analyzing the WHOLE forex market in 1 window (In just 1 minute) . This indicator is very powerful because it reveals the true movements of the market.  It is highly recommended to  analyze charts knowing the performance of individual currencies or the countries ec
149 USD
XQ Forex Indicator MT4
Marzena Maria Szmit
The signal conditions are a combination of three indicators, and XQ Forex Indicators only display  medium and long-term trends . The indicator's efficacy has been improved with the addition of a filter that blocks out false signals. The XQ Forex Indicator can be used on FX pairs, CFDs, and Cryptocurrencies . There are two type of signals:  Buy or Sell and Big Long or Big Short It is possible to enable sending emails when a major trend-change signal is detected, as well as to display the alerts
199 USD
TPA True Price Action indicator reveals the true price action of the market makers through 100% non-repainting signals (except early signals mode) strictly at the close of a candle! TPA shows entries and re-entries, every time the bulls are definitely stronger than the bears and vice versa. Not to confuse with red/green candles. The shift of power gets confirmed at the earliest stage and is ONE exit strategy of several. There are available now two free parts of the TPA User Guide for our custo
168 USD
PZ Divergence Trading
PZ TRADING SLU
5 (3)
Tricky to find and scarce in frequency, divergences are one of the most reliable trading scenarios. This indicator finds and scans for regular and hidden divergences automatically using your favourite oscillator. [ Installation Guide | Update Guide | Troubleshooting | FAQ | All Products ] Easy to trade Finds regular and hidden divergences Supports many well known oscillators Implements trading signals based on breakouts Displays suitable stop-loss and take-profit levels Configurable oscill
125 USD
Laguerre Scrat
Davit Beridze
In case you get Laguerre S crat indicator, you will get Laguerre Scrat Ea as a Gift. To get E a  and det a iled m anu al PDF cont a ct me PM. Def ault settings  are for usd/c ad H4 For St able Long term Profits here is users group:  https://t.me/+9L48ZYJ-81ZmZGQy    Laguerre Scrat is a trading system based on 4 indicator combinations in the shape of one indicator. Laguerre indicator (upgraded), CCI, Bollinger bands and market volatility factor. It generates arrows in the indicator window and nut
130 USD
MetaBands M4
Vahidreza Heidar Gholami
MetaBands uses powerful and unique algorithms to draw channels and detect trends so that it can provide traders with potential points for entering and exiting trades. It’s a channel indicator plus a powerful trend indicator. It includes different types of channels which can be merged by the user to create new channels simply by using the input parameters. MetaBands uses all types of alerts to notify the user about market events. Features Supports most of the channel algorithms Powerful trend det
129 USD
TrendfollowerSR
Paul Reymkhe
4.91 (117)
Take Your Trading Experience To the Next Level ! and get the exclusive TFSR-Analyzer for free !    So you have all these outstanding features  on up to 20 symbols and all timeframes in a smart and clear Design. Correct identification of the trends  in stock investments are pivotal and TrendFollowerSR ensures this perspective while displaying the correct trend on multiply timeframes to help you go long way as much as possible. The latest technology of the Indicator enables to track whether if
149 USD
NO REPAINT ADVANCED CHART PATTERN INDICATOR By definition, a price ( chart)  pattern is a recognizable configuration of price movement that is identified using a series of  trendlines  and/or curves. When a price pattern signals a change in trend direction, it is known as a reversal pattern; a continuation pattern occurs when the trend continues in its existing direction following a brief pause. Advanced Chart Pattern Tracker is designed to find the MOST ACCURATE patterns. A special script is ad
130 USD
MTF Supply Demand Zones
Georgios Kalomoiropoulos
4.8 (20)
자동화된 수요 및 공급 구역의 차세대. 모든 차트에서 작동하는 새롭고 혁신적인 알고리즘. 모든 구역은 시장의 가격 움직임에 따라 동적으로 생성됩니다. 두 가지 유형의 경고 --> 1)가격이 영역에 도달할 때 2)새로운 영역이 형성될 때 당신은 더 이상 쓸모없는 지표를 얻을 수 없습니다. 입증된 결과로 완벽한 거래 전략을 얻을 수 있습니다.     새로운 기능:     가격이 공급/수요 영역에 도달하면 경고     새로운 공급/수요 구역이 생성되면 알림     푸시 알림 알림     핍의 영역 너비 레이블     기동특무부대에 한 번 더 시간이 주어집니다. 따라서 현재보다 위의 2개의 시간 프레임 대신 현재보다 높은 3개의 시간 프레임을 볼 수 있습니다.     Alerts/Zones/MTF 기능을 활성화/비활성화하는 버튼 당신이 얻는 이점:     거래에서 감정을 제거하십시오.     거래 항목을 객
149 USD
제작자의 제품 더 보기
Trade with Gann on your side!! MASTER CIRCLE 360 CIRCLE CHART, originally created by Gann admitted that this is “The Mother of all charts”. It is one of the last studies that this great trader left for us. The numeric tab le is apparently quite simple like all the tables and is based on square numbers, the SQUARE OF 12 and is by evolution, one of the most important square numbers. Here we can find CYCLE, PRICE AND TIME thanks to angles and grades, to show past and future support and resistance.
149.99 USD
Swing Reader MT5v
Francesco Rubeo
Read Elliott wave principle automatically. With the Swing Reader, you can easily read the Elliott Wave Principle through an automatic system. With swing, we mean a ZigZag market that is created by a breakout of its standard deviation. You can set the deviation manually, or you can let the indicator do it automatically (setting the deviation to zero). Advantages you get Never repaints. Points showing a horizontal line, in which statistically a long wave ends. Candles showing a vertical line in
99.99 USD
MM Deepness Arrows
Francesco Rubeo
5 (2)
Easily access to a deep knowledge of the market movement with "M.M. Deepness Arrows"!! This indicator will give you advices on buys and sells after having analized the deepness of the market. The entrance "trigger" will be given after studying each candles' max and min avoiding, this way, the misleading data released by the opening and closure prices (given by the brokers). Thanks to the use of these arrows you'll be able to easily understand if i'ts the right time to buy or sell. If you want th
74.99 USD
Gann s Eighth
Francesco Rubeo
This indicator will let you have at disposal Gann's Eighth, with few clicks!! Gann's Eighth were used by this great Trader to obtain the maximum fluctuation price and the possible inversion points of it. Gann have always given importance to the number 8 in his studies, an it is the reason why we find the retracement points as 0.25(10/8=1.25). Other than the number 8, also the numer 3 had is own importance in Gann, number founded in the eighth division, infact we have three eighth describing the
49.99 USD
Currencies Cleaner  panel will give you an overview of all the most traded market's currencies in a single click. First of all the panel will refresh all your charts, opening them four times in all timeframes needed. 1 - CURRENCIES It uses a complex algorithm to study the movement of 17 different indicators. It means that the algorithm not only "reads" the actual value of an indicator, but also creates a probability of success using the position of this value on the indicator and the last move
FREE
Currencies Cleaner panel will give you an overview of all the most traded market's currencies in a single click. First of all the panel will refresh all your charts, opening them four times in all timeframes needed. 1 - CURRENCIES It uses a complex algorithm to study the movement of 17 different indicators. It means that the algorithm not only "reads" the actual value of an indicator, but also creates a probability of success using the position of this value on the indicator and the last movem
199.99 USD
Stay updated with Multicurrency Overview!! The algorithm of this EA releases an average of the movement percentage of all the Forex currencies linked to a single currency, isolating it, letting us to comprehend its real and specific trend. Above on the left, a panel show us efficiently the trend of the currency, in the timeframe actually used. The second panel will keep you updated on macroeconomic news. P.N.:The news time is based on your pc clock time, this way you won't have any problem r
30 USD
This software will give you the possibility to do different things (both in live markets and in strategy tester) . You'll have at your disposal 5 operative panels, each one of these have buttons that let you interact easily at market: 1. Opened Orders Manager (screenshot 1): 6 buttons: Close all buy orders. Close all sell orders. Close all orders. Close all profitable buy orders. Close all profitable sell orders. Hedge orders. 2. Stop Orders Manager (screenshot 1): 2 informative sections: Nume
99.99 USD
Louisiana
Francesco Rubeo
This software will give you the possibility to preset your management strategy (both in live markets and in strategy tester). You will have at your disposal 8 operative buttons. 4 for Buy positions (from left to right): Buy at market. Buy limit. Buy stop. Set buying time. 4 for Sell positions: Sell at market. Sell limit. Sell stop. Set selling time. After you have decided one of the 4 options you can easily preset: Lot size. Stop loss, both in points and average volatility (D1 timeframe). Ta
49.99 USD
Swing Reader
Francesco Rubeo
5 (2)
Read Elliott wave principle automatically. With the Swing Reader, you can easily read the Elliott Wave Principle through an automatic system. With swing, we mean a ZigZag market that is created by a breakout of its standard deviation. You can set the deviation manually, or you can let the indicator do it automatically (setting the deviation to zero). Advantages you get Never repaints. Points showing a horizontal line, in which statistically a long wave ends. Candles showing a vertical line in
99.99 USD
AR Dashboard
Francesco Rubeo
Easily and rapidly access to the average range of all the markets with "A.R. Dashboard"!! This professional multi-timeframe indicator will show you the average range of all desired markets (till 50) with one click!!  Choose the number of bars to calculate the average range and this indicator will show you, automatically, this average range in points of the chosen markets for each timeframe. You'll have at your disposal two panels: AR Dashboard : Main panel. Notifications Settings : Here you can
30 USD
This indicator will allow you to evaluate single currency linear regression. WHAT IS LINEAR REGRESSION?(PIC.3) Linear regression is an attempt to model a straight-line equation between two variables considering a set of data values. The aim of the model is to find the best fit that can serve the two unknown values without putting the other at a disadvantage. In this case, the two variables are price and time, the two most basic factors in the Forex market. Linear regression works in such a wa
89.99 USD
Create your Dashboard with few clicks! With the  Custom Dashboard Wizard you'll be able to create your dashboard also without any programming knowledge. This indicator/panel will give you the possibility to add/remove the values of the Metatrader4 standard indicators in any time frame you like, with any value you like and in any market you like, just be careful about writing the market name exactly as it's written on the list of your Market Watch. The main panel will be composed of three columns
99.99 USD
With this indicator you'll have a general reading of the market's range using Gann's calculating modes. Gann's swing is used to have a quick reading to the market latest movements at first glance. The foundation of this swing calculation is in the count of candles in relation to the break-up and break-down of the price. When the price breaks-up the last maximum, the swing will get traced if a certain number of candles is exceeded from the last minimum. It can be used a "pure Gann" or not: If set
69.99 USD
필터:
리뷰 없음
리뷰 답변
버전 1.1 2019.04.29
Added K editor to easily change square of 9 settings without accessing on input parameters