Join our fan page
- Views:
- 19905
- Rating:
- Published:
- Updated:
-
Need a robot or indicator based on this code? Order it on Freelance Go to Freelance
The market is often accelerates and decelerates its movements, so it's not easy to draw the straight lines of support and resistance levels.
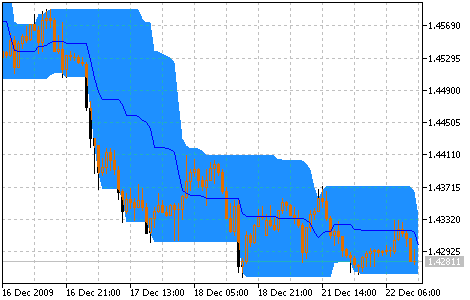
The Price Channel Indicator draws the price channel, its upper and lower boundaries are determined by maximal and minimal prices for a certain period.

Price Channel indicator
Translated from Russian by MetaQuotes Ltd.
Original code: https://www.mql5.com/ru/code/44
 Parabolic SAR
The Parabolic SAR Indicator was developed for analyzing the trending markets.
 Moving Average of Oscillator (OsMA)
The Moving Average of Oscillator (OsMA) is the difference between the oscillator and its smoothed value.
 Price and Volume Trend (PVT)
The Price and Volume Trend Indicator(PVT), like On Balance Volume (OBV), represents the cumulative sum of trade volumes calculated considering close price changes.
 Price Rate of Change (ROC)
The Price Rate of Change (ROC) reflects this ondulatory movement like an oscillator, measuring the difference in prices in a certain period. ROC grows if prices grow and drops along with them. The more the price change is, the more ROC changes.