Fibo RSI Channels
- Indikatoren
- Version: 1.21
- Aktualisiert: 26 März 2020
- Aktivierungen: 5

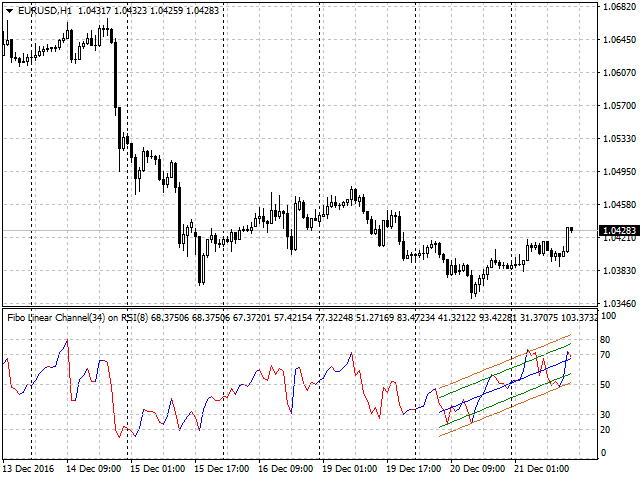
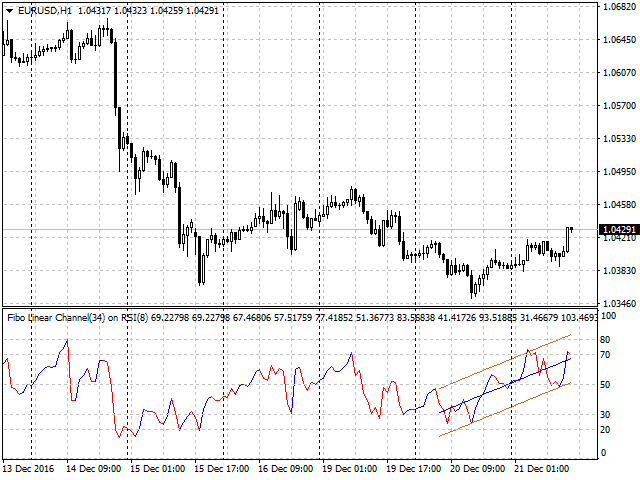
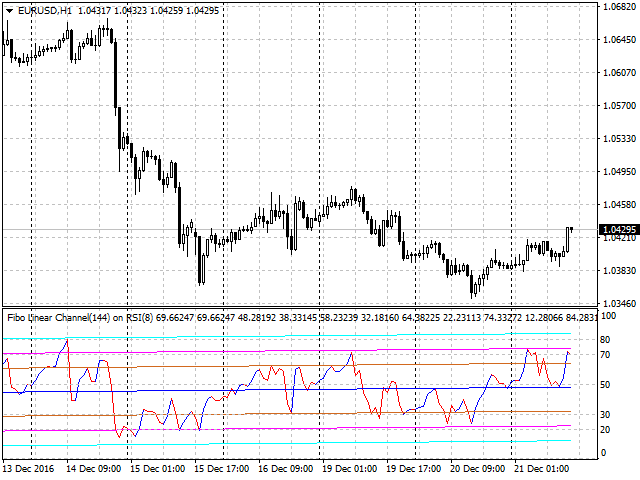
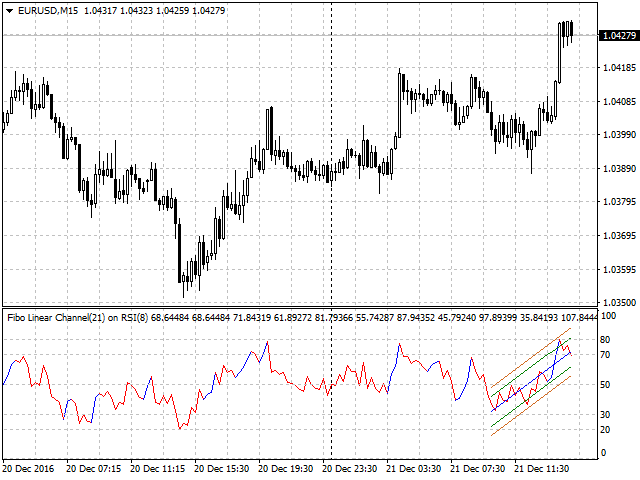
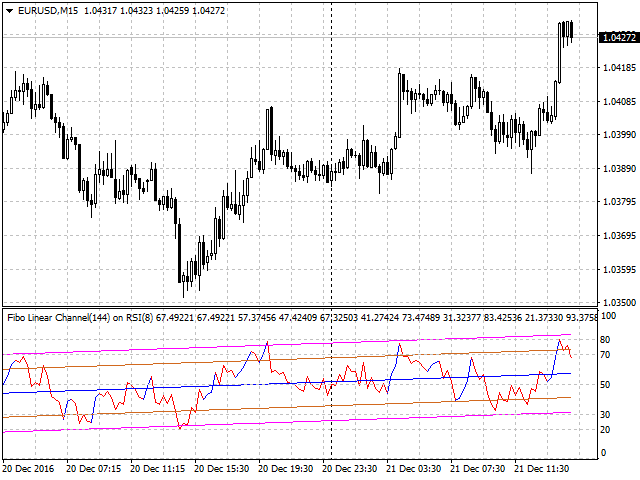
Farbiger Indikator der linearen Kanäle auf der Grundlage der Fibonacci-Folge für den RSI. Er wird verwendet, um Handelsentscheidungen zu treffen und die Marktstimmung zu analysieren. Die Grenzen des Kanals/der Kanäle stellen starke Unterstützungs-/Widerstandsniveaus dar, da sie die Fibonacci-Proportionsniveaus sind.
Der Benutzer kann über die Eingabeparameter die Anzahl der angezeigten Linien der Kanalgrenzen auf dem Chart auswählen.
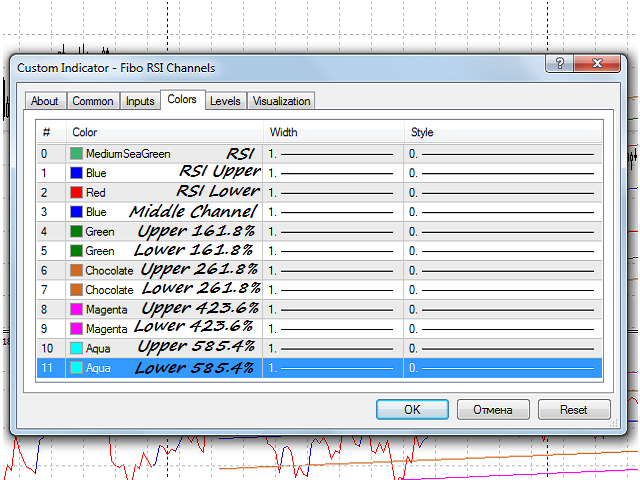
In den Screenshots sind verschiedene Optionen für die Verwendung des Indikators dargestellt. Die Mitte des Kanals wird in Blau dargestellt. Die Kanalgrenzen werden paarweise für jede entsprechende Fibonacci-Erweiterung in individueller Farbe angezeigt.
Zweck
Der Indikator kann für den manuellen oder automatisierten Handel innerhalb eines Expert Advisors verwendet werden. Die Werte des Indikatorpuffers vom Typ Double können für den automatisierten Handel verwendet werden:
- Die Linie des RSI-Indikators - Puffer 0.
- Die Linie des bullischen RSI - Puffer 1.
- Die Linie des bärischen RSI - Puffer 2.
- Mittlere Linie des Kanals - Puffer 3.
- Obere 161,8% Begrenzungslinie - Puffer 4.
- Untere 161,8% Begrenzungslinie - Puffer 5.
- Obere 261,8% Begrenzungslinie - Puffer 6.
- Untere 261,8%-Grenzlinie - Puffer 7.
- Obere Grenzlinie 423,6% - Puffer 8.
- Untere Grenzlinie 423,6% - Puffer 9.
- Obere Grenzlinie 585,4% - Puffer 10.
- Untere 585,4%-Grenzlinie - Puffer 11.
Die Werte der Puffer, die sich auf die linearen Kanäle beziehen, dürfen nicht gleich Null sein.
Die Werte der Puffer, die sich auf den RSI-Indikator beziehen, dürfen nicht gleich EMPTY_VALUE sein.
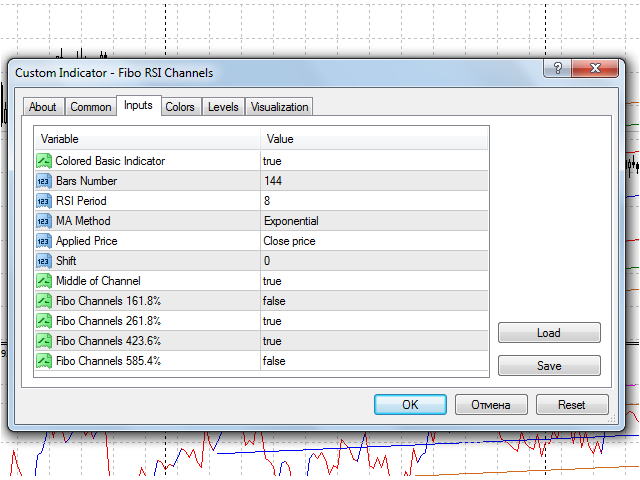
Eingabeparameter
- Colored Basic Indicator - Farbgebung für bullish und bearish RSI:
- true - ja.
- falsch - nein.
- Bars_Number - Anzahl der Bars für die Berechnung des Indikators.
- RSI Periode - Periode für die Berechnung des RSI.
- MA-Methode - MA-Mittelungsmethode.
- Angewandter Preis - für die Berechnung verwendeter Preis.
- Shift - Verschiebung des Indikators im Verhältnis zum Preisdiagramm.
- Mitte des Kanals - Anzeige der Mitte des Kanals auf dem Chart:
- true - ja.
- falsch - nein.
- Fibo-Kanäle 161,8% ....... Fibo-Kanäle 585,4% - Anzeige der 161,8% ........ 585,4%-Kanalgrenzen auf dem Diagramm an:
- true - ja.
- falsch - nein.


Great idea to apply Fib to RSI. If Fib channel is applied to RSI signal line the right way - one can find turning points easier. I bought this thing but still I think its more reliable to apply to RSI a free FIb channel available in metatrader. Its simply more accurate as this one plots a channel in a way similar to linear regression channel. So better to do it manually.