
Color Bollinger Bands
- Indikatoren
-
Jinsong Zhang
 MT5 Articles List - Traders' Blogs: https://www.mql5.com/en/blogs/post/90
 - Version: 1.1
- Aktualisiert: 20 November 2021
。。。。。。。。。。。。。。。。。。。。。。。。。。。。。。。。。。。。。。。。。。。
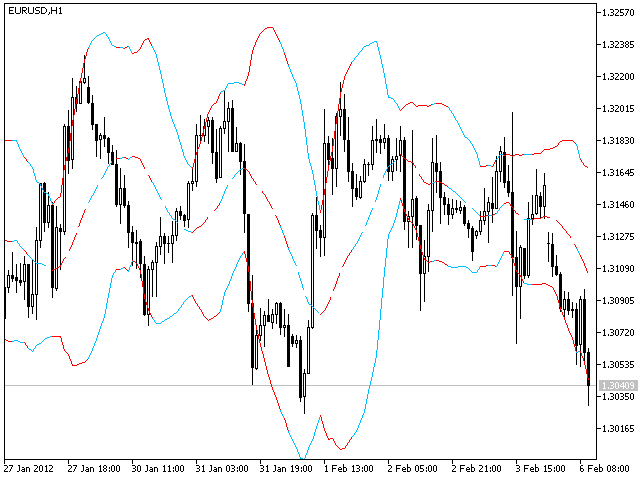
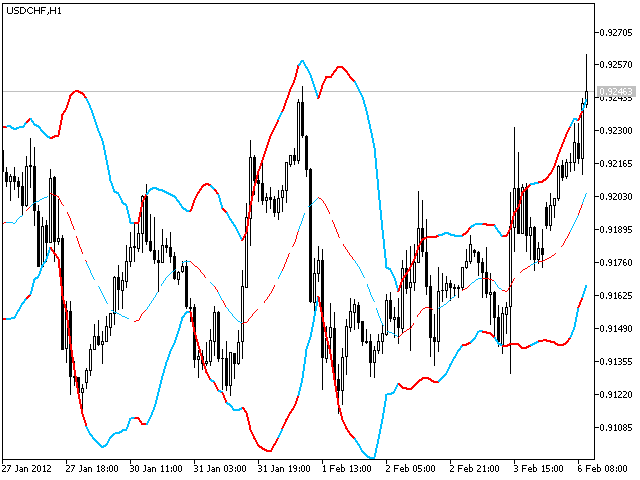
Dieser Indikator basiert auf dem Bollinger Bands Indikator. Er hilft dem Benutzer klar zu erkennen, ob sich das Band ausdehnt oder zusammenzieht.
Die Methode der Verwendung ist die gleiche wie die traditionelle Brin Kanal-Index.
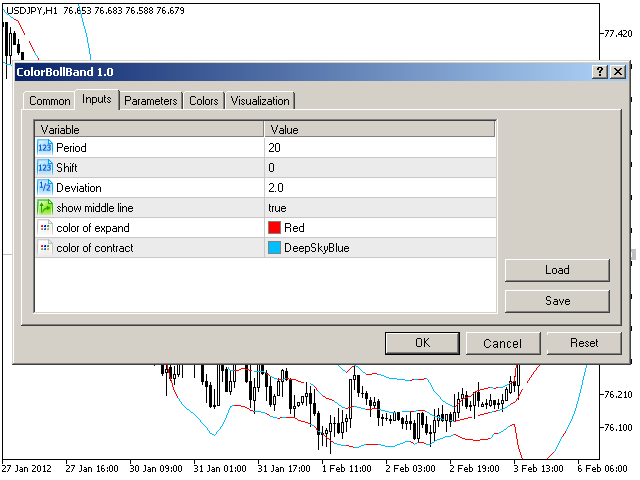
Die Benutzer können verschiedene Farbbereiche verwenden, um die Waldkanalindikatoren in der Expansions- oder Kontraktionsphase zu verteilen.
-------------------------------------------------------------------------------------------


He mejorado mi operativa considerablemente con este indicador. Es fantástico. Lo recomiendo un 100%. Muchas gracias MQL5.