
Color Bollinger Bands
- Indicadores
-
Jinsong Zhang
 MT5 Articles List - Traders' Blogs: https://www.mql5.com/en/blogs/post/90
 - Versión: 1.1
- Actualizado: 20 noviembre 2021
。。。。。。。。。。。。。。。。。。。。。。。。。。。。。。。。。。。。。。。。。。。
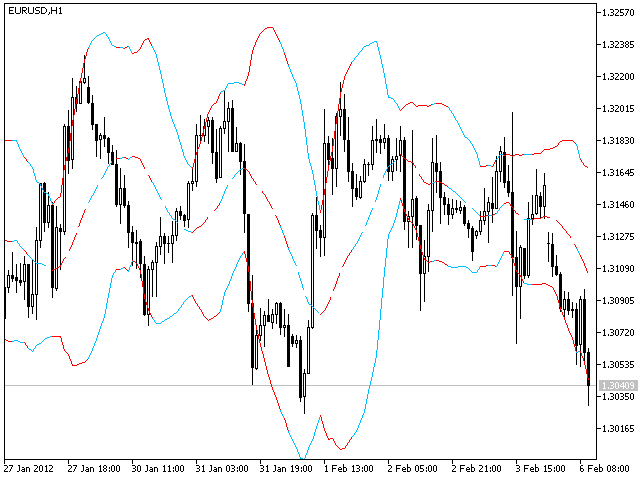
Este indicador se basa en el indicador de Bandas de Bollinger. Ayuda al usuario saber claramente la Banda se expande o contrae.
El método de uso es el mismo que el tradicional índice de canal Brin.
Los usuarios pueden utilizar diferentes áreas de color para distribuir los indicadores de canal forestal en expansión o contracción etapa.
-------------------------------------------------------------------------------------------


He mejorado mi operativa considerablemente con este indicador. Es fantástico. Lo recomiendo un 100%. Muchas gracias MQL5.