FVG iFVG Alert Indicator MT4
- Indikatoren
- Version: 1.30
- Aktivierungen: 5
FVG & iFVG Alert Indikator für MT4
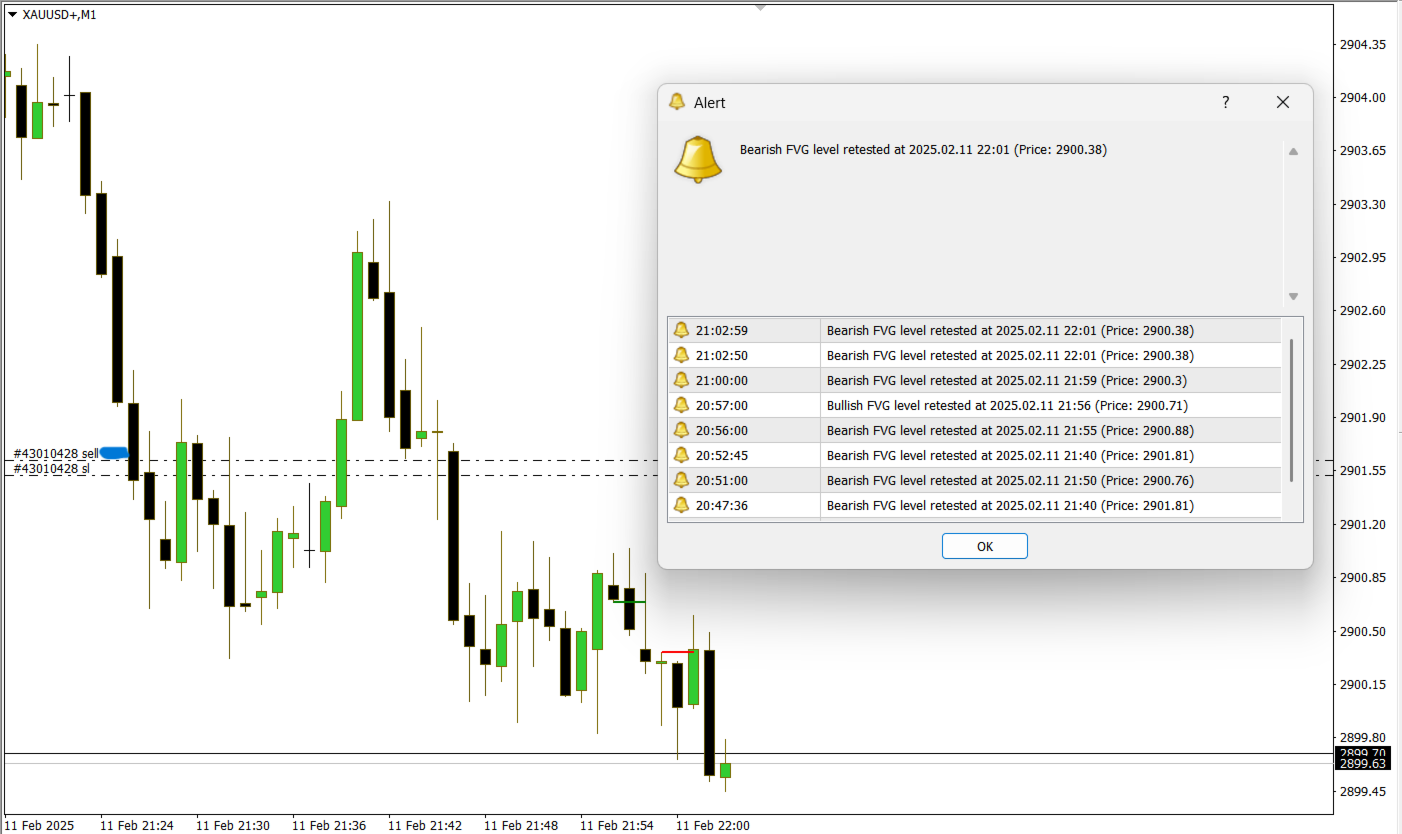
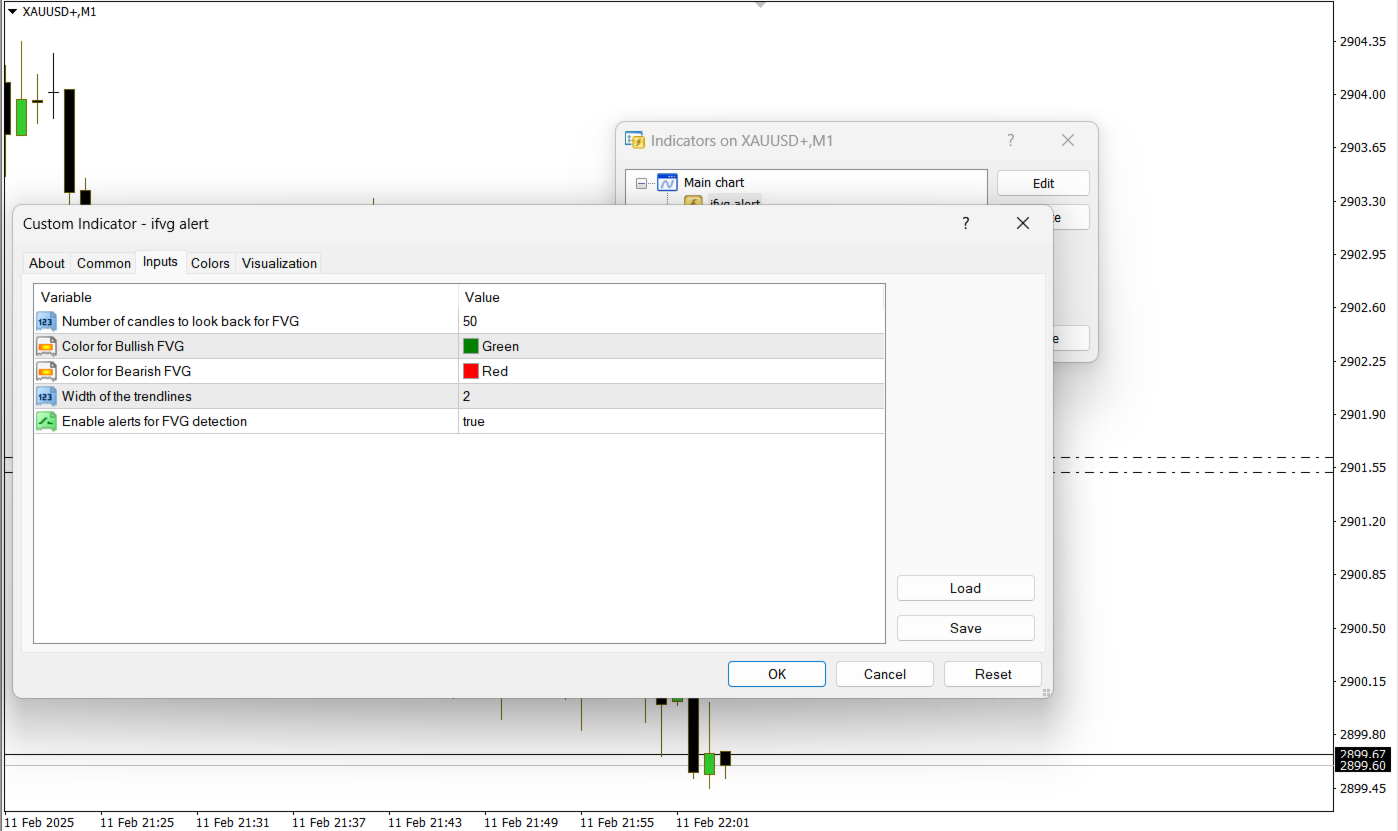
- er ist so kodiert, dass er die frischesten, unberührten FVG erkennt, sowohl bullish als auch bearish, er zeichnet Linien für die FVG und macht sie deutlich
- Wenn der Kurs diese Niveaus erreicht, gibt er bei Kerzenschluss eine Warnung aus, dass der Kurs möglicherweise dieses FVG durchbricht oder es erneut testet
- Der Kurs kann sich halten und wird dann zum FVG oder er kann sich umkehren und zu einem iFVG werden
- gut geeignet, um Sie darauf hinzuweisen, wann Sie sich das Diagramm ansehen und dann je nach Handelssystem ausführen sollten