Price Break
- Indikatoren
-
Miguel Antonio Rojas Martinez
 Mql language programmer.
I have automated various strategies to different customers in order to make operations easier when the Forex market operates - Version: 1.20
- Aktualisiert: 17 November 2021
- Aktivierungen: 15
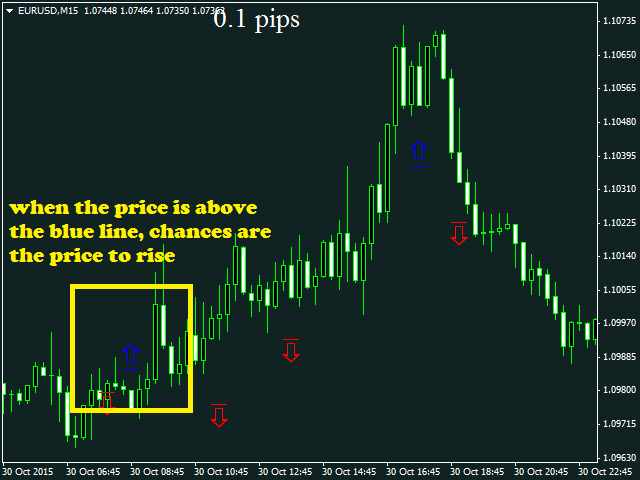
Der "Price Break"-Indikator ist ein mächtiges Werkzeug für jeden Händler. Wenn der Kurs die vom Indikator angezeigten Niveaus durchbricht, besteht eine 77%ige Chance, dass er sich in dieselbe Richtung bewegt.
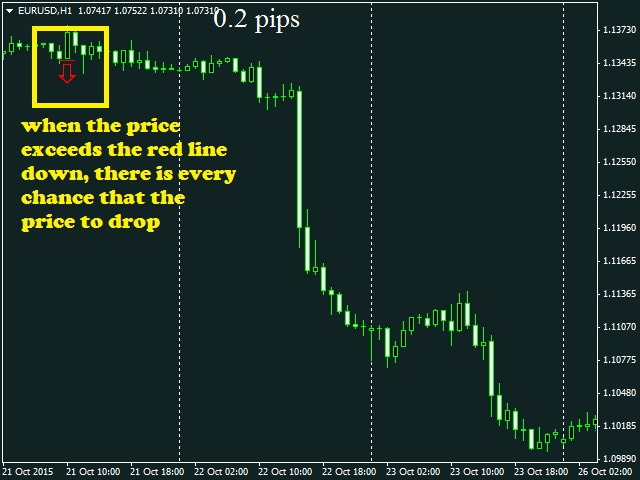
Wenn er die blaue Linie überschreitet, gibt es viele Möglichkeiten für einen Kursanstieg. Wenn er hingegen die rote Linie unterschreitet, bedeutet dies, dass es viele Möglichkeiten für einen Kursrückgang gibt.
Wir sollten immer das letzte Signal des Indikators berücksichtigen, d.h. wir sollten uns nur auf den letzten blauen Pfeil und den letzten roten Pfeil verlassen.
Der Indikator hat nur einen Eingang.
- SPACES: Wenn Sie diesen Wert erhöhen, wird die Eingabe verfeinert, aber natürlich gibt es dann auch weniger Signale; standardmäßig sollten Sie den Wert 3 verwenden.
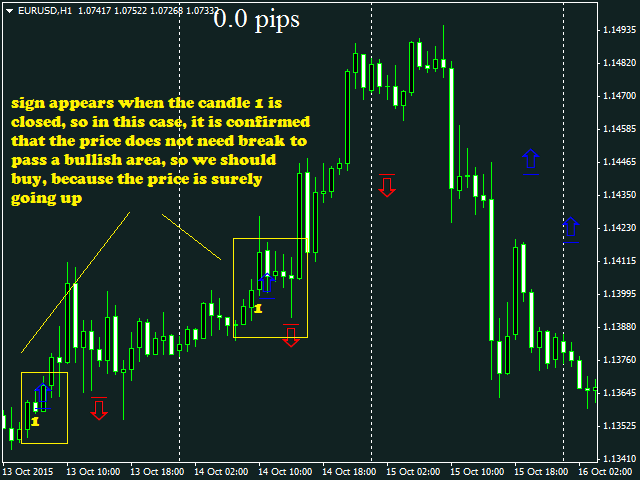
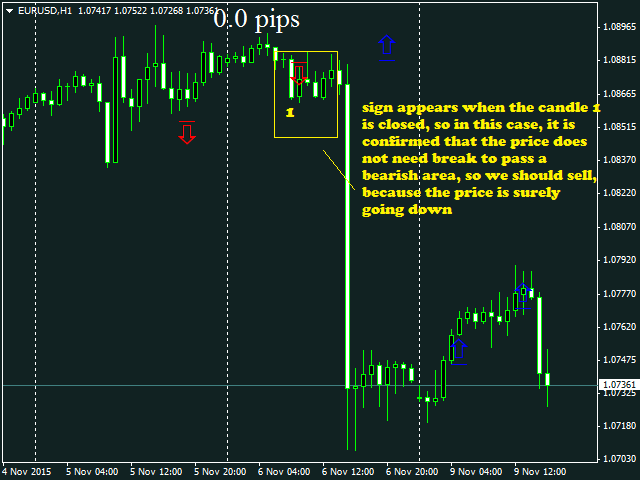
Die Strategie besteht darin, auf jedem dieser Niveaus einen schwebenden Auftrag zu platzieren und ihn zu aktualisieren, sobald der Indikator ein neues Signal (Pfeil) erzeugt. Wenn der Indikator genau auf dem Preis steht, kann keine Pending Order gesetzt werden. Führen Sie den Kauf oder Verkauf sofort aus.
Señor Rojas, le escribo desde España. Le felicito por este brillante indicador, lo estoy usando y estoy asombrado de lo bien que va y lo preciso que es. No obstante me gustaría hacerle una pregunta que sólo el creador del indicador me puede responder con exactitud y me sería de gran ayuda para su mejor aprovechamiento. Cuando aparece una flecha encima de una vela que cierra en sentido contrario, o sea una flecha roja de venta, encima de una vela que cierra en compra ¿debo cambiar de direccion, o seguir como estaba? Le acompaño un gráfico para mejor comprensión. Gracias por su tiempo Mr. Rojas, I am writing to you from Spain. I congratulate you for this brilliant indicator, I am using it and I am amazed at how well it works and how accurate it is. However, I would like to ask you a question that only the creator of the indicator can answer me exactly and it would be of great help for me to make the best use of it. When an arrow appears above a candle that closes in the opposite direction, i.e. a red sell arrow, above a candle that closes as a buy, should I change direction or continue as I was? I am enclosing a chart for better understanding. Thank you for your time