Miguel Antonio Rojas Martinez / Verkäufer
Veröffentlichte Produkte
Visualisieren Sie Ihre Charts in MetaTrader 5 anders. Das Produkt eignet sich gut zum Vergleichen von Kursen, da der Indikator High, Close, HLC, etc. zeichnet. Er ist nützlich, wenn er mit anderen Indikatoren (wie dem MACD) verwendet wird. Dieser einfache Indikator färbt den gesamten Bereich unter dem Diagramm ein, so dass Sie den Markt mit größerer Klarheit sehen können. Sie sehen den aktuellen Preis, die Trends und das Marktverhalten.
Parameter des Indikators: Angewandter_Preis : Mit dieser O
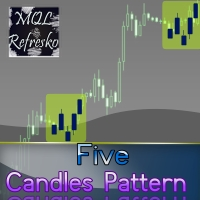
Der "Five Candle Pattern"-Indikator ist eine neue Art, den Markt zu sehen, denn mit ihm können wir die Ausbildung oder das Muster der letzten 4 oder 5 Kerzen vergleichen und/oder suchen und sie in derselben Grafik identifizieren, um Ihr Verhalten zu einem früheren Zeitpunkt zu sehen. Der Indikator erstellt ein Muster aus diesen 4 oder 5 Kerzen und sucht rückwärts, identifiziert und markiert die gleiche Formation oder das gleiche Muster. Anhand dieser Informationen können Sie die derzeitige Strat
Dieser Indikator funktioniert nur 5 Ziffern Brokers. Es ist unmöglich, über die Studie des Forex-Marktes oder eines anderen Marktes zu sprechen, ohne die Marktstatistiken zu berücksichtigen. In diesem Fall, unser Indikator "Preis-Statistiken" haben wir eine neue Art und Weise zu studieren unser Diagramm, was Informationen über den Preis in einem Bereich von Pips Sie wollen zum Beispiel studieren, können wir wissen, wie oft der Preis schließt oder öffnet sich in Räume 10, 20, 30, 50, 100 Pips ode
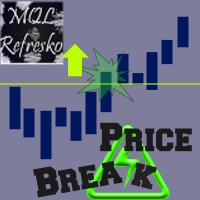
Der "Price Break"-Indikator ist ein mächtiges Werkzeug für jeden Händler. Wenn der Kurs die vom Indikator angezeigten Niveaus durchbricht, besteht eine 77%ige Chance, dass er sich in dieselbe Richtung bewegt. Wenn er die blaue Linie überschreitet, gibt es viele Möglichkeiten für einen Kursanstieg. Wenn er hingegen die rote Linie unterschreitet, bedeutet dies, dass es viele Möglichkeiten für einen Kursrückgang gibt. Wir sollten immer das letzte Signal des Indikators berücksichtigen, d.h. wir soll
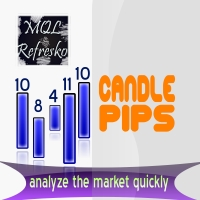
Der "Candle Pips"-Indikator ist ein Werkzeug, das uns hilft, die Größe der Kerzen auf unserer Plattform schnell zu erkennen; dies ist nicht nur eine große Hilfe für jeden Händler, der den Markt gründlich studieren möchte, sondern auch für verschiedene Strategien, die auf der Größe der Kerzen basieren. Der Indikator zeigt den Wert in Pips jeder Kerze in unserem aktuellen Diagramm an, gerundet auf eine ganze Zahl.
Der Indikator zeigt die Informationen auch als Histogramm am unteren Rand des Diagra

Manager Trade ist ein Tool, das Ihnen helfen wird, Ihre Trades auf einfache Weise zu verwalten. Es handelt sich um ein Panel, das auf seiner ersten Registerkarte Schaltflächen und Eingaben enthält, die schön und intuitiv sind und es Ihnen ermöglichen, Operationen viel schneller zu platzieren. Auf der zweiten Registerkarte werden alle Aufträge des Kontos aufgelistet, so dass Sie jeden einzelnen mit einem einzigen Mausklick schließen können.
Die wichtigsten Funktionen Platzieren Sie direkte und s
Mit diesem Werkzeug können Sie Ihr Diagramm besser analysieren. Mit "Fadenkreuz Prozent" können Sie Entfernungen im Diagramm prozentual berechnen (auf sehr einfache Weise, wenn der Zeiger in Form eines Fadenkreuzes angebracht ist: CRTL + F). Das Dienstprogramm erlaubt es, die Kursbewegungen nicht nur in Punkten zu messen und/oder zu berechnen, sondern ein professionelles Maß zu verwenden, nämlich den Prozentsatz. Das Ergebnis wird in zwei Teilen des Bildschirms angezeigt, einer davon neben der P
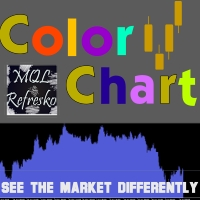
Visualisieren Sie Ihre Charts in MetaTrader 5 anders. Das Produkt eignet sich gut zum Vergleichen von Kursen, da der Indikator High, Close, HLC, etc. zeichnet. Er ist nützlich, wenn er mit anderen Indikatoren (wie dem MACD) verwendet wird. Dieser einfache Indikator färbt den gesamten Bereich unter dem Diagramm ein, so dass Sie den Markt mit größerer Klarheit sehen können. Sie sehen den aktuellen Preis, die Trends und das Marktverhalten.
Parameter des Indikators Angewandter_Preis : Über diese Op

Der "Five Candle Pattern"-Indikator ist eine neue Art, den Markt zu sehen, denn mit ihm können wir die Ausbildung oder das Muster der letzten 4 oder 5 Kerzen vergleichen und/oder suchen und sie in derselben Grafik identifizieren, um Ihr Verhalten zu einem früheren Zeitpunkt zu sehen. Der Indikator erstellt ein Muster aus diesen 4 oder 5 Kerzen und sucht rückwärts, identifiziert und markiert die gleiche Formation oder das gleiche Muster. Anhand dieser Informationen können Sie die derzeitige Strat
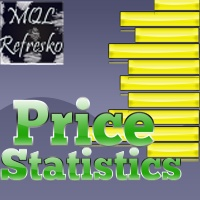
Dieser Indikator funktioniert nur 5 Ziffern Brokers. Es ist unmöglich, über die Studie des Forex-Marktes oder eines anderen Marktes zu sprechen, ohne die Marktstatistiken zu berücksichtigen. In diesem Fall, unser Indikator "Preis-Statistiken" haben wir einen neuen Weg, um unser Diagramm zu studieren, so dass Informationen über den Preis in einem Bereich von Pips, die Sie zum Beispiel studieren wollen, können wir wissen, wie oft der Preis schließt oder öffnet sich in Räume 10, 20, 30, 50, 100 Pip
Der "Price Break"-Indikator ist ein mächtiges Werkzeug für jeden Händler. Wenn der Kurs die vom Indikator angezeigten Niveaus durchbricht, besteht eine etwa 77%ige Chance, dass er sich in dieselbe Richtung bewegt. Wenn er die blaue Linie überschreitet, gibt es viele Möglichkeiten für einen Kursanstieg. Wenn er hingegen die rote Linie unterschreitet, besteht eine hohe Wahrscheinlichkeit, dass der Kurs fällt. Wir sollten immer das letzte Signal des Indikators berücksichtigen, d.h. wir sollten uns
Der "Candle Pips MT5"-Indikator ist ein Werkzeug, das uns hilft, die Größe der Kerzen auf unserer Plattform schnell zu sehen; dies ist nicht nur eine große Hilfe für jeden Händler, der den Markt gründlich studieren will, sondern auch für verschiedene Strategien, die auf der Größe der Kerzen basieren. Der Indikator zeigt den Wert in Pips jeder Kerze in unserem aktuellen Diagramm an, gerundet auf eine ganze Zahl.
Der Indikator zeigt die Informationen auch als Histogramm am unteren Rand des Diagra
Mit diesem Werkzeug können Sie Ihr Diagramm besser analysieren. Mit "Fadenkreuz Prozent" können Sie Entfernungen im Diagramm prozentual berechnen (auf sehr einfache Weise, wenn der Zeiger in Form eines Fadenkreuzes angebracht ist: CRTL + F). Das Dienstprogramm erlaubt es, die Kursbewegungen nicht nur in Punkten zu messen und/oder zu berechnen, sondern ein professionelles Maß zu verwenden, nämlich den Prozentsatz. Das Ergebnis wird in zwei Teilen des Bildschirms angezeigt, einer davon neben der P
Veröffentlichte Signale
1. DX1
- Wachstum
- 17%
- Abonnenten
- 0
- Wochen
- 76
- Trades
- 7319
- Win
- 56%
- Profit-Faktor
- 1.08
- Max. Rückgang
- 7%