Candle Pips
- Indikatoren
-
Miguel Antonio Rojas Martinez
 Mql language programmer.
I have automated various strategies to different customers in order to make operations easier when the Forex market operates - Version: 2.5
- Aktualisiert: 16 November 2021
- Aktivierungen: 10
Der "Candle Pips"-Indikator ist ein Werkzeug, das uns hilft, die Größe der Kerzen auf unserer Plattform schnell zu erkennen; dies ist nicht nur eine große Hilfe für jeden Händler, der den Markt gründlich studieren möchte, sondern auch für verschiedene Strategien, die auf der Größe der Kerzen basieren.
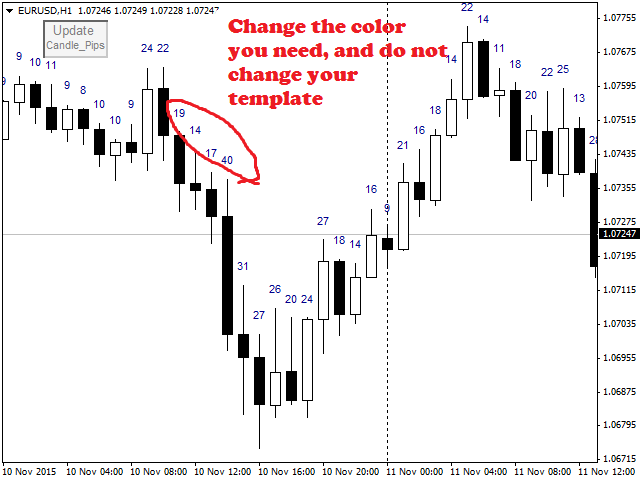
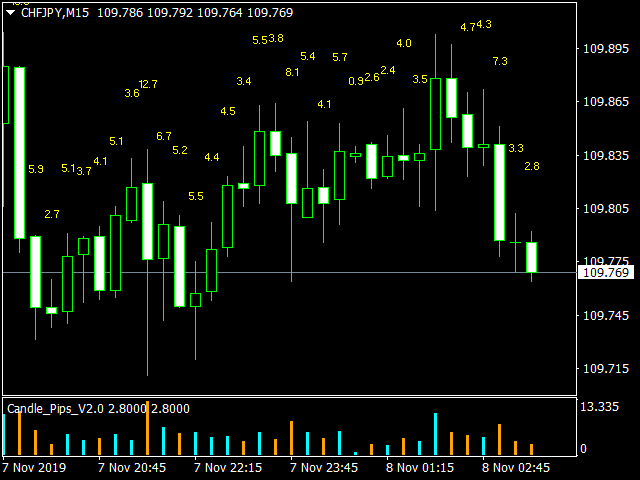
Der Indikator zeigt den Wert in Pips jeder Kerze in unserem aktuellen Diagramm an, gerundet auf eine ganze Zahl.
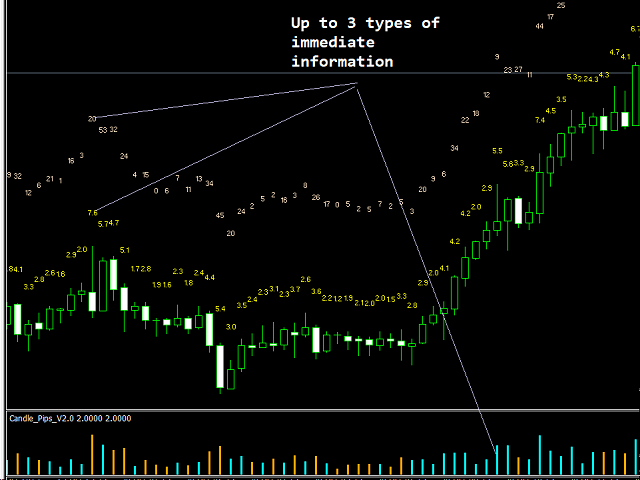
Der Indikator zeigt die Informationen auch als Histogramm am unteren Rand des Diagramms an.
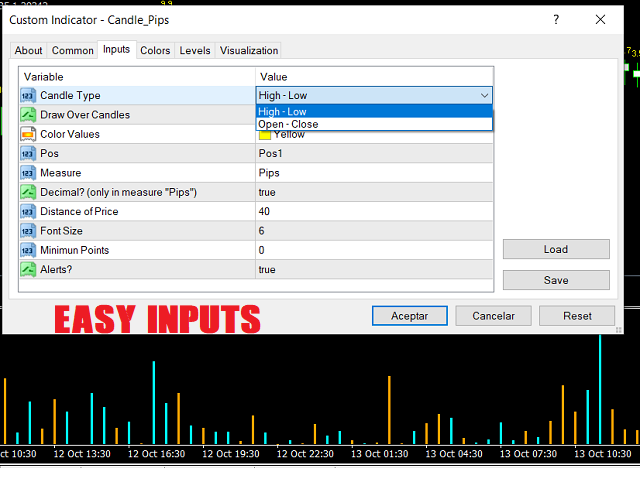
Er hat einfache Eingaben:
- Kerzentyp: Mit diesem Eintrag können Sie auswählen, welchen Teil der Kerze wir messen wollen. Wenn Sie "High__Low" wählen, erhalten wir den vollen Wert der Kerze, den Abstand zwischen dem Maximum und dem Minimum jeder Kerze. Wenn Sie "Open__Close" wählen, erhalten Sie nur den Wert des Kerzenkörpers, ohne die Dochte.
- Color_Values: in diesem Eintrag, ändern Sie die Farbe, mit der das Messergebnis jeder Kerze angezeigt wird, auf diese Weise müssen Sie Ihre Vorlage nicht ändern.
- Abstand_des_Preises: hier können Sie den Abstand des Ergebnisses konfigurieren, das die Größe der Kerze anzeigt, in Bezug auf den Höchststand derselben.
- Dezimal: Mit dieser Option wählen Sie aus, ob Sie (True, False) das Messergebnis mit einer ganzzahligen, ungefähren Ziffer oder das tatsächliche Ergebnis mit der Dezimalstelle sehen möchten.
- Pos: Mit dieser Option können wir die Einstellung eines zweiten Indikators "Candle Pips" in der gleichen Grafik, und damit sehen die 2 Optionen Preis "High__Low" und "Open__Close", der Standardwert ist 0, die Einstellung eines neuen Indikators sollte es als Wert 1 haben.
- Measure: Erlaubt uns zu wählen, ob die Information in Pips oder Punkten angezeigt wird.
- Font_Size: Ermöglicht die Einstellung der Schriftgröße der angezeigten Informationen
- Minimum Punkte: Erlaubt die Einstellung der Größe der angezeigten Kerzen, 0 ist gleichbedeutend mit der Anzeige aller Kerzen
- Alerts ?: Mit dieser Option werden Sie gewarnt, wenn die aktuelle Kerze die Mindestpunktzahl erreicht hat.
- Schaltfläche Anzeigen/Ausblenden: Mit dieser Option wählen Sie aus, ob Sie die numerischen Informationen über die Kerzen anzeigen möchten oder nicht (Wahr, Falsch).

Indicator is great but I would love to be able to not have the indicator window at the bottom and only have the numbers above the candles. If there is a way to do that please tell me, otherwise add it please and it would be perfect!