Elder MACD XOver
- Indicadores
-
Financial Trading Seminars Inc.
 Dr. Alexander Elder
Dr. Alexander Elder is a professional trader based in New York City. He is the author of 11 books, including Trading for a Living (1996) and - Versión: 2.0
- Actualizado: 17 noviembre 2021
- Activaciones: 5
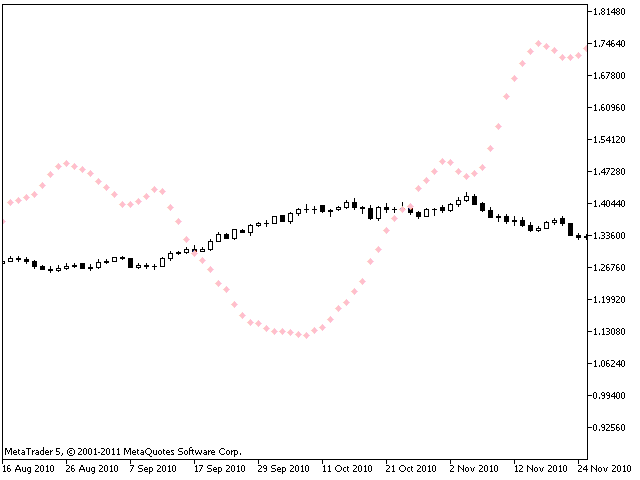
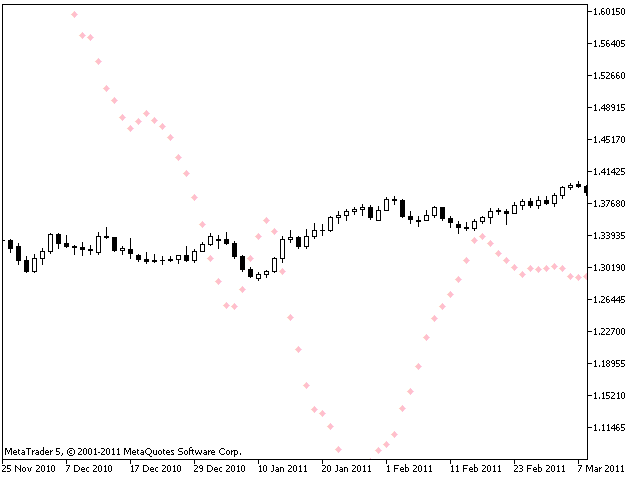
El indicador MACD XOver fue desarrollado por John Bruns para predecir el punto de precio en el que el histograma MACD invertirá la dirección de su pendiente.
El indicador se traza con un día de antelación en el futuro, lo que permite, si su estrategia depende del histograma MACD, predecir su punto de inversión para mañana (o la siguiente barra en cualquier marco temporal). Si el precio de cierre de mañana está por encima del valor de este indicador, entonces el histograma MACD subirá. Si el precio de cierre mañana está por debajo del valor de este indicador, entonces el histograma MACD marcará hacia abajo. Esto es especialmente útil en los gráficos de los plazos más largos y cuando se utiliza el sistema de impulso cuyo color depende en parte de la pendiente del histograma MACD.
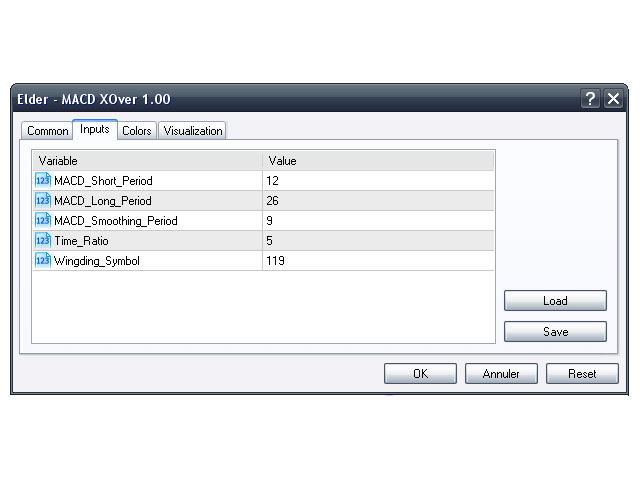
Utilice los mismos valores que el MACD Combo que desea anticipar. Si utiliza los valores por defecto, acepte los valores siguientes.
Parámetros: