Woltec
- インディケータ
- バージョン: 1.10
- アップデート済み: 2 2月 2022
- アクティベーション: 20

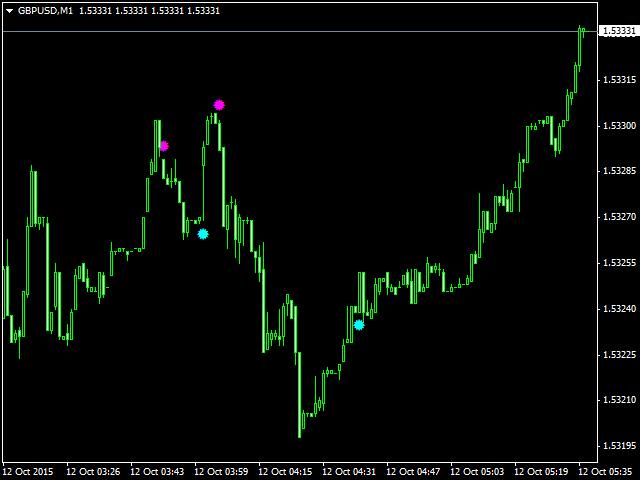
The indicator has been developed for scalping. The indicator is based on a mathematical calculation that determines the percent range of the price channel, which is generally formed at the time of the accumulation of positions. Once the price moves beyond its borders, a signal is generated in the form of dots. The indicator has a minimum of settings - the frequency of signals. Smaller values produce more signals.
Parameters:
- Multiplier - the frequency of signals (with lower values signals are more frequent).
- Notification - notification type: popup alert, Email, Push.
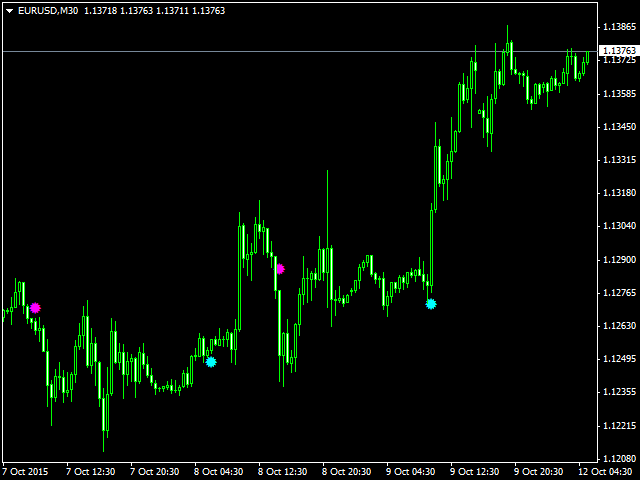
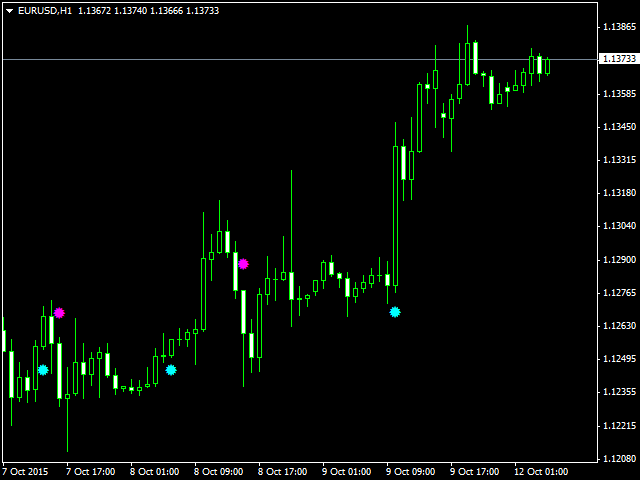
excellent results for M30 EUR/USD
Thanks sir..