Squeeze Momentum Indicato

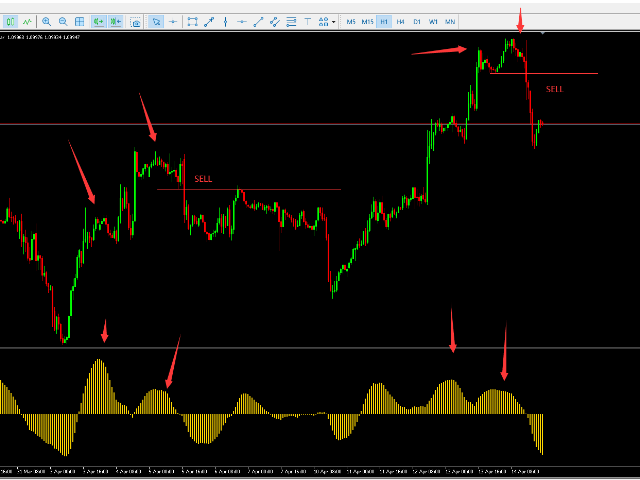
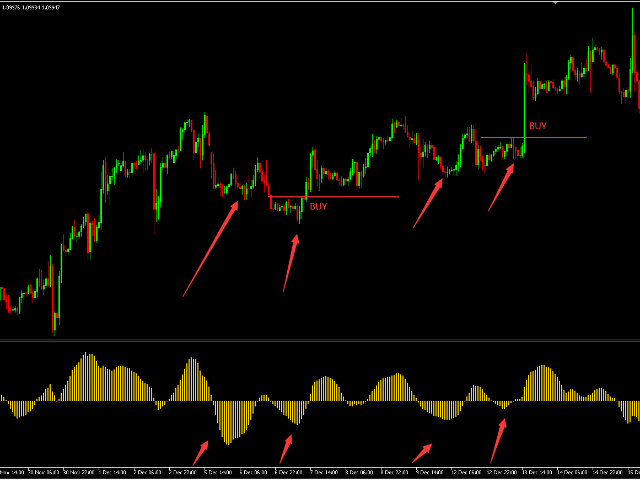
SQZ使用了自适应算法,能够很好的根据市场自我调整,如果你学习过机器学习的入门模型,应该了解线性回归模型,它能够很好的预测短期趋势,当然这只是SQZ指标的一部分。这是一个用于识别短期趋势反转的指标,能够非常好的用于追踪起爆点。当价格出现HH(更高的高点),指标出现LH(更低的高点)的时候,出现结构下破做空。当价格出现LL(更低的低点),指标出现HL(更高的低点)的时候,出现结构上破做多。另外,零轴上方代表多头,下方代表空头。如截图所示,在一个多头趋势中,我们等待指标价格出现背离,入场做多,止损设置在最新低点的下方+1-2个ATR值,你必须要警惕价格机构可能会利用你过窄的止损来获取流动性。同理,在一个空头趋势中我们等待出现双顶入场做空。在多头持有过程中,如果指标一直在0轴上方运行,我们可以继续持有,直到趋势动能减弱。

推荐产品
Volume flow Profile
Israr Hussain Shah
大师版是一款专业级的分析工具,旨在通过成交量和资金流向的视角来可视化市场结构。与标准的成交量指标不同,该工具直接在图表上显示每日成交量分布,让您准确看到价格发现发生的位置以及“聪明钱”的定位。 此大师版专为清晰度和速度而设计,具有独特的自动主题同步系统,加载后即刻美化您的图表布局。 主要特点: 真实资金流向计算: 超越标准的跳动量。启用“Use Money Flow”时,成交量按价格加权,揭示了特定价格水平的实际资金投入。 价值区域 (VA) 可视化: 自动计算价值区域(默认为成交量的70%)。 VA填充: 为价值区域背景着色,以便即时识别控制区域。 关键水平: 清晰标记控制点 (POC)、价值区域高点 (VAH) 和价值区域低点 (VAL)。 专业标记系统: 扫描概况结构以识别关键交易区域: HVN (高成交量节点): 接受和盘整区域(支撑/阻力)。 LVN (低成交量节点): 拒绝区域或“快速通过”区域。 所有标记均向右绘制延长线,便于监控。 Delta 背离(左侧直方图): 左侧直方图可视化每个级别的买卖压力对比。这有助于识别隐藏的背离——即价格可能上涨,但卖家在这些水平上激进打
Here   our more valuable tools SMC Trend Trading   ,  Easy SMC Trading  ,  Institutional SMC Architect Volume Analysis Tools  ,  Volume flow Profile  ,  Market volume profile  , FVG with Volume  , Liquidity Heatmap Profile  ,  Volume Spread Analysis 2. Key Features Dynamic Filtering : The core feature. As soon as the current price crosses a historical liquidity level, that level disappears. This reduces chart clutter and prevents you from trading off "dead" support/resistance. Liquidity Heatma
Here   our more valuable tools SMC Trend Trading   ,  Easy SMC Trading  ,  Institutional SMC Architect Volume Analysis Tools  ,  Volume flow Profile  ,  Market volume profile  , FVG with Volume  , Liquidity Heatmap Profile  ,  Volume Spread Analysis The    Liquidity Heatmap   is a sophisticated institutional trading tool designed to reveal where over-leveraged traders are trapped. By calculating estimated liquidation levels based on volume spikes and leverage, this indicator draws a dynamic "h
Blahtech Market Profile MT5
Blahtech Limited
5 (10)
Was: $249  Now: $99   Market Profile defines a number of day types that can help the trader to determine market behaviour. A key feature is the Value Area, representing the range of price action where 70% of trading took place. Understanding the Value Area can give traders valuable insight into market direction and establish the higher odds trade. It is an excellent addition to any system you may be using. Inspired by Jim Dalton’s book “Mind Over Markets”, this indicator is designed to suit the
BoxChart MT5
Evgeny Shevtsov
5 (7)
The market is unfair if only because 10% of participants manage 90% of funds. An ordinary trader has slim changes to stand against these "vultures". This problem can be solved. You just need to be among these 10%, learn to predict their intentions and move with them. Volume is the only preemptive factor that faultlessly works on any timeframe and symbol. First, the volume appears and is accumulated, and only then the price moves. The price moves from one volume to another. Areas of volume accumu
该指标建立当前报价,可以与历史报价进行比较,并在此基础上进行价格走势预测。指示器有一个文本字段,用于快速导航到所需日期。 选项: 符号 - 选择指标将显示的符号; SymbolPeriod - 选择指标从中获取数据的时段; IndicatorColor - 指示器颜色; HorisontalShift - 由指标绘制的报价移动指定的柱数; Inverse - true 反转引号,false - 原始视图; ChartVerticalShiftStep - 图表垂直移动(键盘上的向上/向下箭头); 接下来是文本字段的设置,您可以在其中输入日期,您可以通过按“回车”立即跳转到该日期。 接下来是文本字段的设置,您可以在其中输入日期,您可以通过按“回车”立即跳转到该日期。
Boom Crash SMC
Israr Hussain Shah
Here   our more valuable tools SMC Trend Trading   ,  Easy SMC Trading  ,  Institutional SMC Architect Volume Analysis Tools  ,  Volume flow Profile  ,  Market volume profile  , FVG with Volume  , Liquidity Heatmap Profile  ,  Volume Spread Analysis Deriv boom and crash index spike killer system you can use it only on m5 timeframe  follow the structure and get signal with alert on phone open trade set sl tp and enjoy easy analysis and trading made simple 
Market Profile Suite
Muhammad Minhas Qamar
Developed by MMQ —  Market Profile Suite   Was: $79 Now: $59 A comprehensive Market Profile indicator for MetaTrader 5 that visualizes price distribution through TPO (Time Price Opportunity) analysis. The implementation draws from concepts presented in Jim Dalton's "Mind Over Markets," providing traders with tools to understand market structure, value areas, and volume distribution across multiple timeframes and session configurations. Links [ Documentation  |  Video  | More ] Feature Highlight
What if you could finally SEE where the market really wants to go? Most traders watch price. Pros watch VOLUME — where the money was actually traded. Volume Profile Fibo Confluence puts that reading right in front of you, in plain language, no jargon. WHAT YOU SEE ON YOUR CHART • The POC, the most-traded price: the market's natural magnet • The value area (VAH / VAL): the "house" where price spends its time • Automatic Fibonacci retracement + the golden pocket • Low-volume nodes
AstraQuant Smart Liquidity AI AstraQuant Smart Liquidity AI is a professional MetaTrader 5 indicator designed for traders who want a cleaner and more structured way to understand market behavior. Instead of depending on simple arrows or basic crossover systems, the indicator focuses on liquidity sweeps, momentum behavior, volatility conditions, and multi-timeframe alignment to help traders read the market with better clarity. Many traders struggle because charts become overloaded with indicators
Volume Profile Canvas
Mauro Italo Gaspari
Volume Profile Canvas - Professional Volume Profile Indicator for MetaTrader 5 DESCRIPTION Volume Profile Canvas is a professional volume profile indicator for MetaTrader 5 that renders directly on the chart using a high-performance Canvas engine. It calculates and displays the volume distribution across price levels, identifying the Point of Control (POC), Value Area High (VAH) and Value Area Low (VAL) in real time. This is a pure analysis tool. It does not trade. It gives you an instant vi
Here   our more valuable tools SMC Trend Trading   ,  Easy SMC Trading  ,  Institutional SMC Architect Volume Analysis Tools  ,  Volume flow Profile  ,  Market volume profile  , FVG with Volume  , Liquidity Heatmap Profile  ,  Volume Spread Analysis The Trading Guide MT5 Indicator is a powerful psychological trading assistant designed to keep traders disciplined, focused, and emotionally balanced. This innovative indicator displays real-time motivational messages, trading rules, and analysis
FREE
Footprint 是一款用于分析订单流 (Order Flow) 和成交量的指标。 它有助于在聚类层面识别市场结构,寻找活动增加的关键区域,并直接在图表上使用过滤器,无需不断打开设置窗口。 Footprint 指标功能 Bid x Ask, Delta 聚类图表; 图表上的控制面板; 用于调整过滤器的滑块; Absorption; Initiative; Stacked Imbalances; Big Trades; dPOC / Dynamic Point of Control; Delta; 侧边市场轮廓 (Market Profile); 累计 Delta (Cumulative Delta)。 核心优势 在密集的 Tick 流上快速计算和渲染数据; 图表内管理 — 主要模式和过滤器可直接在图表上切换,无需打开设置; 通过过滤突出显示重要的价格水平和聚类; 视觉信号高亮:吸收、主动性、失衡和大单交易; 按日、周或当前可见范围显示的侧边轮廓; 包含总成交量、Delta 和累计 Delta 的面板。 Footprint 帮助您确定: 重要成交量集中的位置; 主动性压力出现的位置;
VOLUME PROFILE SAF-XII 专业级 MT5 市场轮廓(成交量概况)分析仪 —— 网格交易者的梦幻指标 什么是成交量概况 (Volume Profile)? 成交量概况是一种专业的机构级工具。与传统的随时间显示成交量的指标不同,它显示的是 特定价格水平 上的交易活动。它揭示了交易发生在 哪里 ,帮助您识别: 价值区 (VAH/VAL) :大部分交易发生的价格区间。 控制点 (POC) :成交量最高的核心价格水平。 流动性失衡 :每个层级的多空主导力量对比。 支撑/阻力 :基于实际交易活动形成的天然价格位。 三种操作模式 —— 真正的“设置后即忘” VP_MANUAL(波段交易与关键位分析) 用户通过拖动垂直线自定义分析范围。 仅在移动线条时重新计算。 适用场景 :新闻前夕分析、财报发布、特定日期范围。 VP_AUTO(头寸与动量交易) 随新柱线自动向后滚动。 使用自定义回溯周期(默认 100 根柱线)。 适用场景 :动量策略、突破交易。 VP_SESSION(日内交易与机构流向) 锚定逻辑交易时段(伦敦、纽约、亚洲盘开盘)。 适用场景 :日内交易、基于时段的机构化策略
SMC Venom 模型 BPR 指標是針對在智慧貨幣 (SMC) 概念內工作的交易者的專業工具。它會自動辨識價格圖表上的兩種關鍵模式: FVG (公平價值缺口)是三根蠟燭的組合,其中第一根和第三根蠟燭之間存在缺口。它在水平之間形成一個沒有成交量支撐的區域,這通常會導致價格調整。 BPR (平衡價格區間)是兩種 FVG 模式的組合,形成一個「橋樑」 - 當價格以低成交量活動移動時,突破並返回到水平的區域,從而在蠟燭之間產生間隙。 這些模式可協助交易者透過分析圖表上的交易量和價格動態(大型市場參與者和普通參與者之間的互動)來識別關鍵的支撐/阻力位、突破區域和切入點。 此指標以矩形和箭頭的形式可視化模式,也支援靈活的警報設定。 主要特點: 模式顯示模式:選擇顯示 BPR 模式(看漲和看跌)或 FVG 模式(看漲和看跌)。 可以隱藏所有圖表分析模式。 以條數過濾:BPR 結構中 FVG 之間的最小/最大距離。 訊號的附加視覺化: 箭頭有 9 種類型可供選擇(標準、細、分形等)或手動輸入 Wingdings 代碼,其表格可以選擇性地顯示在圖表上。 設定顏色、尺寸及其縮放時相對於價格的動態
Infinity Liquidity - Premium MT5 Liquidity Sweep & Smart Money Indicator Infinity Liquidity is a premium MetaTrader 5 liquidity indicator designed for traders who want a cleaner, smarter, and more professional way to read market structure, liquidity sweeps, smart money zones, buy and sell opportunities, volatility conditions, and high-probability trading areas directly on the MT5 chart. This indicator is built for traders who trade forex, gold, XAUUSD, indices, crypto, commodities, and other liq
Gioteen Volatility Index (GVI) - your ultimate solution to overcoming market unpredictability and maximizing trading opportunities. This revolutionary indicator helps you in lowering your losing trades due to choppy market movements. The GVI is designed to measure market volatility, providing you with valuable insights to identify the most favorable trading prospects. Its intuitive interface consists of a dynamic red line representing the volatility index, accompanied by blue line that indicate
Volume Profile for MetaTrader 5 Price movement alone does not explain where the market is actually traded . What matters is where volume is built and how these areas shift over time. This Volume Profile displays the volume distribution directly on the chart , making it clear which price levels were accepted by the market and where rejection occurred. This allows structurally relevant zones to be identified and integrated into individual decision-making processes. The tool is designed for high pe
DoctorEdge V-LINE (Pump it & Dump it) Strategy Pro Confirms trend direction using smart momentum logic and key price behavior How It Works DoctorEdge V-LINE is a smart visual indicator designed to detect trend impulses and confirm their strength based on how price reacts around certain dynamic zones. Buy Trend: When price reaches level -20 , the line turns green , signaling a potential buy . If price breaks above level 0 and the line stays green, the uptrend is confirmed . If price doe
The PrimeX7Trader Auto-Visible Volume Profile is a next-generation, highly optimized market analysis tool designed specifically for serious traders who require extreme precision without terminal freezing. Unlike traditional volume profiles that clutter your chart with manual lines or slow down your platform by calculating thousands of unseen historical bars, this indicator dynamically reads only the visible viewport. It is engineered for fast, manual trade execution, making it the perfect compan
Blahtech Supply Demand MT5
Blahtech Limited
4.54 (13)
Was: $299  Now: $99  Supply Demand uses previous price action to identify potential imbalances between buyers and sellers. The key is to identify the better odds zones, not just the untouched ones. Blahtech Supply Demand indicator delivers functionality previously unavailable on any trading platform. This 4-in-1 indicator not only highlights the higher probability zones using a multi-criteria strength engine, but also combines it with multi-timeframe trend analysis, previously confirmed swings a
Binary Rise Fall
Israr Hussain Shah
Here   our more valuable tools SMC Trend Trading   ,  Easy SMC Trading  ,  Institutional SMC Architect Volume Analysis Tools  ,  Volume flow Profile  ,  Market volume profile  , FVG with Volume  , Liquidity Heatmap Profile  ,  Volume Spread Analysis The Fractals_Price indicator is a technical analysis tool that identifies fractal patterns on price charts. Fractals are recurring patterns that signal potential trend reversals or continuation points. This indicator marks both upward and downward
Risk Control Tool
Israr Hussain Shah
Here   our more valuable tools SMC Trend Trading   ,  Easy SMC Trading  ,  Institutional SMC Architect Volume Analysis Tools  ,  Volume flow Profile  ,  Market volume profile  , FVG with Volume  , Liquidity Heatmap Profile  ,  Volume Spread Analysis Overview (Short Description) A professional risk management indicator that helps traders calculate lot size, risk percentage, and reward ratio in real time. Perfect for Forex, Indices, Gold, and Synthetic Indices traders who want precise control ov
Spike Blast Pro
Israr Hussain Shah
Here   our more valuable tools SMC Trend Trading   ,  Easy SMC Trading  ,  Institutional SMC Architect Volume Analysis Tools  ,  Volume flow Profile  ,  Market volume profile  , FVG with Volume  , Liquidity Heatmap Profile  ,  Volume Spread Analysis Spike Blaster Pro is a next-generation MT5 indicator designed specifically for synthetic markets. It works seamlessly on Boom Index and Weltrade Index , providing traders with sharp, reliable spike detection signals. What makes Spike Blaster Pro po
PZ Cup and Handle MT5
PZ TRADING SLU
3 (2)
杯子和手柄模式是类似于杯子和手柄的技术价格结构,其中杯子呈“ U”形,并且手柄略有向下漂移。图案的右侧-手柄-小于左侧-杯形,并且从顶部回撤不超过50%。它既可以是延续模式,也可以是逆转模式。 [ 安装指南 | 更新指南 | 故障排除 | 常见问题 | 所有产品 ] 清除交易信号 可自定义的颜色和尺寸 实施绩效统计 可自定义的尺寸和图案特征 显示适当的止损和获利水平 它是不可重涂和不可重涂的 它实现了电子邮件/声音/视觉警报 输入参数 幅度:幅度表示替代价格点之间的最小柱线量。要找到大图案,请增加幅度参数。要查找较小的模式,请减小幅度参数。 杯子平整度比率:此参数描述杯子的顶部相对于杯子大小的“平整度”。较高的值将发现更严格的模式,但频率较低。较低的值将找到更多的模式。 最小句柄回撤:模式句柄中需要的最小百分比回撤。 最大。回撤:模式句柄中可能的最小百分比回撤。 最大历史柱数:指标在图表中加载时要评估的过去柱数。 显示统计信息:显示或隐藏统计信息显示板和效果数据。 显示止损/止盈水平:显示或隐藏止损和止盈水平。 绘图选项:看涨或看跌的线条和标签的颜色和大小以及字体大小。 突破:突破
Your Pointer
Nadiya Mirosh
Your Pointer is no ordinary Forex channel. This corridor is built on the basis of the analysis of several candles, starting from the last one, as a result of which the extremes of the studied interval are determined. They are the ones who create the channel lines. Like all channels, it has a middle line as well as a high and low line. This channel is worth watching for its unusual behavior. The use of the Your Pointer indicator allows the trader to react in time to the price going beyond the bo
累积成交量增量 (CVD) MA-X:智能订单流情绪工具 通过 Cumulative Volume Delta (CVD) MA-X 揭示市场的隐藏机制。传统的成交量指标只能告诉你交易了 多少 ,而 CVD MA-X 则能告诉你 谁 在胜出以及 何时 胜出。通过聚合 Tick 级的价格行为和成交量分布,该指标为你提供了一张清晰的市场信念与衰竭地图。 交易者优势:为什么选择 CVD MA-X? 大多数交易者失败是因为他们对滞后的价格做出反应。CVD MA-X 通过分析 K 线的内部压力(影线与实体的比例)并结合成交量权重,为你提供 领先优势 。它实时回答了三个关键问题: 这次波动是否有真金白银支持? (CVD 与零轴的配合) 趋势是否正在失去动力? (MaxBuy/MaxSell 衰竭点) 大资金是否与价格背离? (内置背离引擎) 强大功能与实用性 智能权重阈值: 不同于简单的 Delta 计算,该指标通过解构 K 线影线和实体长度来计算“买入 vs 卖出成交量”,提供更细腻的意图观察。 双层信号逻辑: 兼具 CVD 零轴交叉 和 MA(CVD 移动平均线)零轴交叉 。这使你能够区分短
Max Min Delta Indicator - Market Volume Imbalance Analysis Gain Deeper Insights into Market Volume Imbalance with Delta Analysis What is the Max Min Delta Indicator? The Max Min Delta Indicator is a powerful market volume analysis tool that visually represents maximum and minimum delta values using a histogram. It helps traders identify market strength, weakness, absorption, and aggressive buying/selling activity with precision. Key Features Histogram Visualization: Displays Max Delta (Green) an
Delta Profile Volume
Teresinha Moraes Correia
指标技术说明 – Delta Profile for MetaTrader 5 Delta Profile 是为 MetaTrader 5 开发的一款指标,用于在指定的 K 线区间内对成交量流进行详细分析。它能够在不同的价格水平上对正向成交量(与上涨相关)和负向成交量(与下跌相关)的不平衡进行结构化和可视化展示。最终,用户可以清晰地识别图表中成交最为集中的区域,以及真实的市场不平衡形成的位置。 以下是该指标的主要技术特征与参数说明。 核心概念 指标会识别 价格水平 ,并将其分类为正向成交量、负向成交量,以及净 Delta(正负成交量的差值)。 每个价格水平会在图表中以 水平条形 显示,帮助用户直观观察市场活跃区和不平衡区域。 用户可自由控制 分析的 K 线数量 、 价格精度(小数位数) 、 显示的最大水平数量 以及 可视化样式 。 主要功能 价格水平映射 :根据设定的精度对价格进行四舍五入,并累计对应 K 线的成交量。 净 Delta 计算 :显示正负成交量的差值,提供每个价格区间的客观数值。 最强 Delta 水平突出显示 :自动识别 Delta 绝对值最大的价格水平,并用特殊颜色标
该产品的买家也购买
Neuro Poseidon MT5
Daria Rezueva
4.79 (52)
Neuro Poseidon is a new indicator by Daria Rezueva. It combines precise trading signals with adaptive TP/SL levels - creating best possible trades as a result! Message me and get  Neuro Poseidon Assistant  as a gift to automize your trading process! What makes it stand out? 1. Proven profitability on all assets and timeframes 2. Only confirmed BUY and SELL signals present on the chart 3. Adaptive TP & SL levels generated by the software for each trade 4. Easy to understand - suitable for al
M1 Quantum MT5
Hamed Dehgani
5 (5)
开发者提示: 当前仅剩 2 个许可证 ,价格为 149 美元 。售完后,价格将上涨至 169 美元 。 开发者提示: 购买后请联系我,以获取 最新推荐的参数设置文件(Set File) 、交易建议,以及加入 VIP 支持群组 ,与其他 M1 Quantum 用户交流经验。 M1 Quantum 是一款专业的 M1 交易系统,提供快速且精准的交易信号,并内置止损(Stop Loss)、止盈(Take Profit)以及智能资金管理功能。 M1 Quantum 包含专业的资金管理系统,通过专注于 连续盈利交易 ,帮助交易者更快地增长账户资金。 M1 Quantum 指标 的主要特点 专为 M1 时间周期 和所有 主要货币对 设计 所有交易均配备止损和止盈 内置 资金管理功能 ,并指导交易者轻松执行交易计划 高胜率,高比例的 连续盈利交易 无重绘,无延迟 适合各种类型的交易者,简单易懂 要使用 M1 Quantum ,您需要 M1 Quantum Assistant 。这款强大的工具对所有 M1 Quantum 用户 免费提供 。 下载 M1 Quantum Assistant 加入我的
Divergence Bomber
Ihor Otkydach
4.9 (92)
购买该指标的每位用户将额外免费获得以下内容: 原创工具“Bomber Utility”,该工具会自动跟踪每一笔交易,设置止损和止盈点,并根据策略规则自动平仓; 适用于不同交易品种的指标设置文件(Set 文件); 三种不同风险模式下的 Bomber Utility 设置文件:“最低风险”、“平衡风险” 和 “观望策略”; 一套详细的 视频操作手册,帮助您快速完成安装、配置并开始使用本交易系统。 注意: 要获取以上所有赠品,请通过 MQL5 的私人消息系统联系卖家。 我为您介绍原创的自定义指标 “Divergence Bomber”(背离轰炸机),它是一套基于 MACD 背离交易策略 的“全功能”交易系统。 该技术指标的主要任务是识别 价格与 MACD 指标之间的背离,并发出交易信号(包括推送通知),指示未来价格可能的运动方向。平均而言,这些信号的准确率超过 98%。有关该指标如何工作的详细说明,请观看本页面上的视频演示。 该系统使用 止损订单 和 动态回撤平仓机制 来管理交易。 Divergence Bomber 指标的主要特点: 支持交易的品种: AUDCAD、AUDCHF、AUDSG
Gem SIGNAL
Shengzu Zhong
5 (1)
GEM Signal Pro GEM Signal Pro 是一款適用於 MetaTrader 5 的趨勢跟隨指標,專為希望在圖表上獲得更清晰訊號、更有結構的交易設定,以及更實用風險管理的交易者而設計。 它不僅僅顯示一個簡單的箭頭,GEM Signal Pro 還能以更清晰、更易讀的方式呈現完整的交易思路。當條件確認完成後,指標可在圖表上顯示進場價、止損價與止盈目標,幫助交易者更有效率地評估交易設定。 運作方式 該指標首先根據其內部邏輯識別有效的初始訊號。 當確認條件滿足後,GEM Signal Pro 會在圖表上顯示完整的交易設定。這讓交易者可以更清楚地看到交易結構,並減少手動分析與計算的工作量。 圖表上的交易價位 對於已確認的訊號,GEM Signal Pro 可顯示: 進場價 止損價 止盈 1 止盈 2 止盈 3 風險報酬比 這讓交易設定更容易理解,也有助於讓圖表分析更有條理。 內建風險管理 風險管理是此指標設計的重要部分。 止損位基於近期市場結構,結合附近的擺動高低點與可選的 ATR 緩衝距離。這能讓交易價位更貼近當前市場條件,而不只是依賴固定距離。 圖表資訊面板 GEM Si
UZFX {SSS} 超短线智能信号 v4.0 MT5 是一款无重绘的高性能交易指标,专为在快速波动的市场中需要精准、实时信号的超短线交易者、日内交易者和波段交易者设计。该指标由 (UZFX-LABS) 开发,融合了价格行为分析、趋势确认和智能过滤技术,可在所有货币对和时间周期内生成高概率的买卖信号、预警信号以及趋势延续机会。 别再对交易犹豫不决了,开始遵循这一专为追求清晰、精准和纪律性市场执行的交易者设计的结构化信号系统吧。 我的建议* 最佳时间周期:15分钟及以上。 {H1} 是我的最爱。而且效果令人惊叹……!! 更新后的主要功能 • 自动买入和卖出信号检测 • 先进的反转识别逻辑 • 潜在市场反转前的早期预警信号 • 趋势延续确认信号 • 内置风险管理功能,包含入场点、止损点、TP1、TP2和TP3水平 • 完全可自定义的风险回报比 • 实时警报、声音提醒和移动端推送通知 • 带交易建议的专业信息面板 • 适用于所有MT5交易品种和时间周期 • 界面简洁、轻量且用户友好 为什么交易者选择 UZFX SSS? 大多数交易者亏损的原因在于入场过晚、平仓过早,或者缺乏明确的交
介绍     Quantum Breakout PRO   ,突破性的 MQL5 指标,正在改变您交易突破区域的方式!由拥有超过13年交易经验的资深交易员团队开发,     量子突破 PRO     旨在通过其创新和动态的突破区域策略将您的交易之旅推向新的高度。 量子突破指标将为您提供带有 5 个利润目标区域的突破区域的信号箭头,以及基于突破框的止损建议。 它既适合新手交易者,也适合专业交易者。 量子 EA 通道:       点击这里 重要的!购买后请私信我领取安装手册。 建议: 时间范围:M15 货币对:GBPJPY、EURJPY、USDJPY、NZDUSD、XAUUSD 账户类型:ECN、Raw 或 Razor,点差极低 经纪商时间:GMT +3 经纪商:IC Markets、Pepperstone with Raw 和 Razor 的点差最低 规格: 不重漆! 最多 5 个建议利润目标区域 建议止损水平 可定制的盒子。您可以设置自己的 Box Time Start 和 Box Time End。 接触 如果您有任何疑问或需要帮助,请通过私人消息与我联系。
Transaction Speed MT5
Ivan Stefanov
5 (3)
当然,以下是翻译成中文(简体)的版本: 该指标标出市场中显现出 交易兴趣 的区域,并随后显示 订单积累区域 。它的工作方式类似于大规模的订单簿。 这是为 大资金 打造的指标,性能卓越。市场中有任何兴趣,你都能通过它清晰看到。 (这是一个 完全重写的自动化版本 —— 不再需要手动分析。) 交易速度 是一个全新的概念指标,它显示了市场上大订单 何时 、 何地 聚集,并揭示了其背后的意义。它可以在 非常早期 就检测到趋势的变化。 在外汇市场,所谓的“交易量”实际上是误导性的,因为那指的是价格在单位时间内的变化,因此真正的名称应是“交易速度”。 一切都取决于我们如何思考、如何行动、如何分析。 改变分析范式至关重要。 该指标完全重构了外汇市场上“交易量”的概念,用逻辑方式重新定义并应用,从而成为一个 独特而精准的工具 。 使用方法: 默认情况下,指标处于 自动模式 ,可独立用于任何时间周期。如果你希望切换到手动模式,只需点击 Auto / Manual Mode 按钮即可。 在 手动模式 下,所有计算从 2025年1月1日 开始。你可以根据需要更改该日期,以查看不同的分析结果。 最优数据周期
Quantum TrendPulse
Bogdan Ion Puscasu
5 (25)
介绍 Quantum TrendPulse   ,这是一款终极交易工具,它将 SuperTrend   、   RSI 和 Stochastic 的强大功能整合到一个综合指标中,以最大限度地发挥您的交易潜力。该指标专为追求精准和效率的交易者而设计,可帮助您自信地识别市场趋势、动量变化以及最佳进入和退出点。 主要特点: 超级趋势整合: 轻松跟随当前的市场趋势并乘上盈利浪潮。 RSI 精度: 检测超买和超卖水平,非常适合把握市场逆转时机,可用作 SuperTrend 的过滤器 随机精度: 利用随机振荡在波动的市场中寻找隐藏的机会, 用作超级趋势的过滤器 多时间范围分析: 从 M5 到 H1 或 H4,在不同时间范围内关注市场动态。 可定制的警报: 当您的自定义交易条件得到满足时收到通知,这样您就不会错过任何交易。 无论您是新手还是经验丰富的交易员,   Quantum TrendPulse 都能为您提供所需的优势,帮助您增强策略并自信地进行交易。借助这一强大的指标,将洞察力转化为利润 — 掌控您的交易! ***购买 Quantum TrendPulse,即可免费获得 Quantum Tr
ARIPoint
Temirlan Kdyrkhan
1 (1)
ARIPoint is a powerful trading companion designed to generate high-probability entry signals with dynamic TP/SL/DP levels based on volatility. Built-in performance tracking shows win/loss stats, PP1/PP2 hits, and success rates all updated live. Key Features: Buy/Sell signals with adaptive volatility bands Real-time TP/SL/DP levels based on ATR Built-in MA Filter with optional ATR/StdDev volatility Performance stats panel (Success, Profit/Loss, PP1/PP2) Alerts via popup, sound, push, or email Cu
Btmm state engine pro
Garry James Goodchild
5 (5)
BTMM State Engine Pro is a MetaTrader 5 indicator for traders who use the Beat The Market Maker approach: Asian session context, kill zone timing, level progression, peak formation detection, and a multi-pair scanner from a single chart. It combines cycle state logic with a built-in scanner dashboard so you do not need the same tool on many charts at once. What it does Draws the Asian session range; session times can follow broker server offset or be set in inputs. Tracks level progression (L
Current event:  https://c.mql5.com/1/326/A2SR2025_NoMusic.gif A2SR MT5 版 指标:自动化实际供需 (S/R)。 + 交易工具。 Product description in English here. --   Guidance   : -- at   https://www.mql5.com/en/blogs/post/734748/page4#comment_16532516 -- and  https://www.mql5.com/en/users/yohana/blog 强大、真实、省时,助您做出更明智的交易决策。 + 兼容 EA 的对象。 主要优势 领先的实际 SR 水平(不滞后,不重绘) 自 2014 年以来,A2SR 在 MT4 平台上经过多年的可靠性验证 ,现已面向 MetaTrader 5 平台推出。 它凭借领先的、不重绘的指标,为交易者带来卓越的优势,帮助他们在价格触及支撑位和阻力位之前识别实际支撑位和阻力位。 A2SR 提前计算支撑位和阻力位——在价格触及支撑位和阻力位之前——让交
Azimuth Pro
Ottaviano De Cicco
5 (7)
Azimuth Pro V2:MT5合成分形结构分析与确认入场 概述 Azimuth Pro 是 Merkava Labs 推出的多层级波段结构指标。四层嵌套波段层级、锚定波段的VWAP、ABC形态识别、三时间框架结构过滤以及收盘确认入场——一个图表,一个从微观波段到宏观周期的完整工作流程。 这不是盲目的信号产品。它是一个以结构为先的工作流程,专为重视位置、背景和时机的交易者打造。 ️ 夏季促销 — 庆祝夏至与 The Oracle Pro 上市:Azimuth Pro 七折优惠,现价 279 美元(原价 399 美元)。限时夏季优惠。 1. V2的变化 合成多时间框架引擎 高时间框架分析从零开始重建,采用与Meridian Pro相同的专有合成架构。更清晰的HTF背景、稳定的实时行为、无经典MTF同步问题。合成引擎还解锁了 固定比率时间框架级联 (x2、x3、x4、x6)——不再在经纪商的固定时间框架之间任意跳转,您可以按图表时间框架的固定倍数分析结构,在每个尺度上保持相同的分形关系。 确认入场箭头 作为稳定且可恢复的执行层而设计的收盘确认箭头。当ABC设置形成且自适应确认逻辑
Quant Direction MT5
Georgios Kalomoiropoulos
Quant Direction 是一款三维市场分析工具。它通过同时计算多个维度上的精确百分比偏差,提供完全客观的、基于算法的市场分析视角。该算法采用先进的人工智能建模工具开发,并经过全面测试,旨在以独特的精准度解读市场。它可以分析您平台上的任何货币对或金融工具。 无论您是短线 交易者、日内 交易者还是波段交易者,Quant Direction 都是您的理想之选。 交易者的真正优势 Quant Direction 的真正优势在于彻底消除情绪、屏幕疲劳和过度思考。它无需手动点击十几个图表来寻找方向并反复质疑自己的偏好,引擎即可在几毫秒内即时处理 8 个时间周期(从 5 个月到月线)。它能准确告诉你任何时刻谁在掌控市场,确保你始终朝着概率最高的方向进行交易。 市场分析的三个维度 该算法将市场分为三个不同的交易维度,为您提供完整的宏观和微观视角: 超短线交易分析: 捕捉即时、快速的动量变化和较低时间框架的执行点。 日内分析: 识别真实的、潜在的每日方向性偏差。 波动分析: 专注于宏观趋势,确保您不会与大盘机构的走势背道而驰。 独家评分引擎 Quant Direction 的底层采用了一套
KURAMA GOLD SIGNAL PRO(MT5)— 7层过滤 · 自动止盈止损 · 质量评分 · 信号历史保存 | 完整的XAUUSD交易系统 实时不重绘。信号出现的瞬间,箭头、入场、止盈、止损当场锁定,之后绝不移动。你交易的就是这个实时信号。而且在v7.20中,每一个真正发出的信号都会自动保存,并在重启后精确还原。 购买者专属赠品 购买永久授权,即可免费获得 AI Zone Radar(价值$59)+ 完整PDF手册。在产品价格之外,额外附赠价值$59的赠品。购买后在MQL5上给我留言即可。 AI Zone Radar: https://www.mql5.com/en/market/product/175834 在黄金交易者社区中被实际使用,因精度与易用性而广受好评。 你的难题 —— 以及解决方案 黄金一天波动$30–$50。你知道机会就在那里。但这些情况是否似曾相识: - 入场太早,价格逆行$10后才朝你的方向
The Oracle Pro
Ottaviano De Cicco
The Oracle Pro:用于 MT5 的合成多周期偏向引擎 ️ 夏季上市优惠 — 早期买家可以 199 USD 获得 The Oracle Pro。价格将随关注度上升;最终价格 399 USD。 The Oracle Pro 是一款面向高要求与专业交易者的 MetaTrader 5 高级多周期 偏向引擎 。它以纪律回答一个问题:当前每个周期的方向偏向是什么、强度如何、各周期之间的一致程度如何?一切仅在已收盘的 K 线上计算——绝不重绘。 The Oracle Pro 是一套多因子共识系统。它将专有指标与优化算法整合为单一而精密的共识向量,并在单个指标实例内,跨当前周期与更高周期的堆栈进行读取——而不是在多个图表上堆叠互不相关的工具。 它是 Oracle 共识方法的专业进化版:完整重建为高级操作控制台,面向希望在一个纪律化工作流中获得深度、多周期背景与背离洞察的交易者。 是偏向引擎,而非信号生成器 The Oracle Pro 明确自身定位。它是一款提供纪律化方向背景的 多周期多因子偏向指标 。它 不是 信号生成器:不承诺入场、出场或盈利。偏向是背景——你在其方向上交易自己的设置
ACB Breakout Arrows MT5
KEENBASE SOFTWARE SOLUTIONS
3.5 (2)
ACB Breakout Arrows 指标通过检测特殊的突破形态,提供市场中的关键入场信号。该指标持续扫描图表中的价格动量,在价格出现重大变动前,提前提供精确的入场信号。 点击此处获取多品种多周期扫描器 - ACB Breakout Arrows MT5 扫描器 主要特点 指标自动提供止损和止盈价格。 内置多周期扫描仪仪表盘,可追踪所有时间周期的突破信号。 适用于日内交易者、波段交易者和剥头皮交易者。 优化算法提升信号精度。 特别设置的快速盈利线用于无亏损移动或短线目标。 支持胜率、盈亏比、平均利润等绩效分析指标。 无重绘,信号可靠。 交易确认 - 可使用 ACB Trade Filter 指标 来过滤低概率的交易信号。 强烈买入: 向上箭头 + 绿色柱状图 + 多头趋势。 强烈卖出: 向下箭头 + 红色柱状图 + 空头趋势。 当柱状图为灰色且趋势为震荡时,应避免交易。 (可选) -  使用  KT 支撑阻力水平指标  避免在重要支撑/阻力位附近入场。这类交易可能迅速变成亏损。 “一个成功交易者的目标是做出最好的交易。金钱只是附属。” —— 亚历山大·埃尔德 输入参数 历史
This indicator automatically detects internal & swing market structure, Fibonacci Retracement and Fibo Levels. Features Full internal & swing market structure labeling in real-time Fibonacci Retracement Fibonacci Levels After purchasing the indicator, the full source code is provided, and via indicator buffers it can be easily integrated into your Expert Advisors (EAs) for automated trading strategies.
本产品已针对 2026 年市场进行更新,并针对最新 MT5 版本进行了优化。 价格更新通知: Smart Price Action Concepts 目前价格为 $200 。 接下来的 30 次购买 后,价格将上涨至 $299 。 特别优惠: 购买后,请发送私信给我,即可领取 免费赠品 + 礼物 。 首先需要强调的是,这款交易工具是不重绘、不回绘、不延迟的指标,因此非常适合专业交易使用。 Online course , and manual Smart Price Action Concepts 指标是一款非常强大的工具,适合新手和有经验的交易者使用。它将 20 多个实用指标整合到一个系统中,结合了 Inner Circle Trader Analysis 和 Smart Money Concepts Trading Strategies 等高级交易理念。该指标专注于 Smart Money Concepts,帮助交易者理解大型机构如何交易,并辅助预测其市场行为。 它特别擅长流动性分析,使交易者更容易理解机构交易逻辑。它也非常适合预测市场趋势并仔细分析价格走势。通过让交易与机构策略保
Trend Forecaster
Alexey Minkov
5 (8)
Trend Forecaster 是一款 MetaTrader 5 指标,可将突破信号、潜在反转区域分析、市场波动区间数据和可视化统计面板整合到同一个图表工作区中。 它可以显示 Buy 和 Sell 信号,跟踪 Average Range 和 Current Range,并且可以根据当前交易品种和时间周期自动调整 Sensitivity。也支持手动设置 Sensitivity。 该指标可用于外汇货币对、金属、股票、指数和加密货币。支持不同时间周期,M5 可以作为一个实用的起点。 主要功能 突破和反转区域分析 Trend Forecaster 会分析已识别区域附近的价格行为,并在内部突破条件满足时显示 Buy 或 Sell 信号。该指标可用于研究趋势延续和潜在反转区域。 多过滤器信号逻辑 该指标将多个内部过滤器整合为一个简单的工作流程。用户在开始分析前不需要配置大量技术参数。 Auto-Tune Sensitivity 该指标可以根据近期历史数据,自动为当前交易品种和时间周期计算 Sensitivity。这有助于在切换不同交易品种时减少手动设置。 手动设置模式 如果你更喜欢固定设置,或
Entry Points Pro for MT5
Yury Orlov
4.48 (140)
这款指标用于 MT5,可提供准确的入场交易信号,且无重绘。 它可应用在任何金融资产:外汇、加密货币、贵金属、股票、指数。 它将提供极其精准的评估,并告诉您何时开仓和平仓的最佳时机。 观看 视频 (6:22),其中包含一个仅处理单一信号的示例,该信号即可值回指标购价! 大多数交易者在 Entry Points Pro 指标的帮助下,在第一个交易周内即改善了他们的交易结果。 订阅我们的 Telegram 群 ! Entry Points Pro 指标的益处。 入场信号无重绘 如果信号出现,并得到确认,则它不会再消失;不像是重绘指标,它会导致重大的财产损失,因为它们可以在显示信号后再将其删除。 无差错开仓 指标算法可令您找到入场交易(买入或卖出资产)的理想时机,从而提高每位交易者的成功率。 Entry Points Pro 可操作任何资产 它允许您在 MT5 平台上交易任何经纪商的加密货币、股票、贵金属、指数、大宗商品和货币。 提供任何方向的信号 Entry Points Pro 指标提供针对任意价格走势的入场交易信号 - 上涨、下跌或横盘(横向)。 最大盈利潜力 离场信号
RelicusRoad Pro MT5
Relicus LLC
4.96 (24)
RelicusRoad Pro: 量化市场操作系统 终身访问限时 70% 折扣 - 加入 2,000+ 交易员社区 为什么大多数交易者即使拥有“完美”指标也会失败? 因为他们在真空中交易 单一概念 。没有背景的信号是赌博。要持续获胜,您需要 共振 (CONFLUENCE) 。 RelicusRoad Pro 不是一个简单的箭头指标。它是一个完整的 量化市场生态系统 。它描绘价格运行的“公允价值之路”,区分市场噪音和真实的结构性突破。 停止猜测。开始用机构级“路”逻辑进行交易。 核心引擎:“Road” (路) 算法 系统的核心是 Road Algo ,一个实时适应市场条件的动态波动率通道。它投射出 安全线 (平衡) 和价格可能反转的 扩展水平 。 Simple Road: 典型市场的标准结构映射。 Smooth Road: 针对震荡盘整的降噪计算。 Breakout Road: 专为识别波动率扩张和爆发性走势而调整。 1. 算法动量与确认 我们的“剥头皮箭头”不只是简单的交叉。它们利用 高阶多项式逻辑 过滤噪音,确保信号与主周期一致。我们检测动量、价格行为和 Road 结构汇聚的精确入场
Precision Spike Detector
Francisco Mandomo Simbine
5 (1)
Precision Spike Detector V3 – Institutional-Grade AI Trading System Attention: The price increases by US$50 for every 10 purchases.  Final price: US$599 Precision Spike Detector V3   is a   state-of-the-art, institutional-grade market analysis system   for   MetaTrader 5 , designed to detect   high-probability market movements   in synthetic indices such as   Boom, Crash, GainX, and PainX . After purchase, please contact me through the MQL5 messaging system to receive the order management tool
Grabber System MT5
Ihor Otkydach
4.83 (24)
向您介绍一款优秀的技术指标——Grabber,它是一套即开即用的“全包式”交易策略。 在一个代码中集成了强大的市场技术分析工具、交易信号(箭头)、提醒功能和推送通知。 每位购买该指标的用户还可免费获得以下内容: Grabber辅助工具:用于自动管理已开仓位 视频操作指南:逐步教学如何安装、设置和使用该指标进行交易 原创Set文件:可快速自动配置,帮助实现最佳交易效果 忘掉其他策略吧!只有Grabber能够真正激励你在交易中攀登新高峰! Grabber策略的主要特点: 交易周期:从M5到H4 适用资产:任意,但我推荐我亲自测试过的品种(GBPUSD、GBPCAD、GBPCHF、AUDCAD、AUDUSD、AUDSGD、AUDCHF、NZDUSD、NZDCAD、EURCAD、EURUSD、EURAUD、EURGBP、EURCHF、USDCAD、USDSGD) 交易时间:全天候 24/7 交易效果:我分享自己的真实交易结果,并在此教学如何操作: https://www.mql5.com/ru/market/product/134563?source=Site+Market+MT5+Indic
Backtesting Simulator MT5
Diego Arribas Lopez
4 (1)
[ MT4 Version ] Are you tired of spending months on demo or live accounts to test your trading strategies? The Backtesting Simulator is the ultimate tool designed to elevate your backtesting experience to new heights. Utilizing Metatrader historical symbol information, it offers an unparalleled simulation of real market conditions. Take control of your testing speed, test ideas quickly or at a slower pace, and witness remarkable improvements in your testing performance. Forget about wasting tim
PrimeScalping
Temirlan Kdyrkhan
PrimeScalping is a powerful trading companion designed to generate high-probability entry signals with dynamic TP/SL/DP levels based on volatility. Built-in performance tracking shows win/loss stats, PP1/PP2 hits, and success rates — all updated live. Key Features: Buy/Sell signals with adaptive volatility bands Real-time TP/SL/DP levels based on ATR Built-in MA Filter with optional ATR/StdDev volatility Performance stats panel (Success, Profit/Loss, PP1/PP2) Alerts via popup, sound, push, or e
[Currently Gaining High Popularity!] Visibility significantly improved in the latest update! QUASAR Prism MT5 - Advanced Multi-Timeframe Pattern Scanner "Deconstruct the complex light of the market to visualize precise entry points." QUASAR Prism is a dedicated MT5 multi-timeframe consensus pattern scanner equipped with a proprietary N-Pattern analysis engine. It simultaneously analyzes market wavelengths from M1 to D1 via MTF. Complex analysis is completed simply by a "change of color." 5 Re
Meravith MT5
Ivan Stefanov
5 (1)
做市商工具。 Meravith 将: 分析所有时间周期并显示当前正在运行的趋势。 标注流动性区域(成交量均衡区),即多头与空头成交量相等的位置。 在您的图表上直接显示来自不同时间周期的所有流动性水平。 生成并展示基于文本的市场分析供您参考。 根据当前趋势计算目标位、支撑位和止损位。 计算交易的风险回报比。 根据您的账户余额计算仓位大小,并估算潜在利润。 在市场出现重大变化时,Meravith 还会发出警告。 指标的主要线条: 多头/空头成交量衰竭线 —— 作为目标位使用。 趋势线 —— 指示市场趋势方向。根据市场是多头还是空头而改变颜色,并作为趋势支撑。其颜色主要反映市场情绪。 成交量均衡线(Eq)—— Eq(Volume Equilibrium)是系统的核心。它表示买卖双方成交量的平衡点,即市场流动性所在位置。向上突破 Eq 表示多头倾向,向下突破 Eq 表示空头倾向。突破后,应等待回调——当价格回到相反趋势的偏离线或衰竭线附近时。 使用方法:只需将其添加到图表中。 Meravith 可以分析一切——趋势和回调。 趋势线与某条成交量衰竭线之间的距离越大,说明该方向的成交量越高。 趋势
What Is It? This PVSRA Screener is for real-time market analysis. so instead of manually checking charts one by one, you get a live command center that tells you the market phase, volume intent, trend state, and nearest price structure all in one glance. Features at a Glance Multi-pair, multi-timeframe scanner dashboard... monitors everything at once PVA (Price Volume Analysis)... detects Climax and Rising volume candles in real time The Dragon EMA... configurable trend anchor (default 50 EMA of
Royal Wave Pro M5
Vahidreza Heidar Gholami
3.5 (4)
Royal Wave is a Trend-Power oscillator which has been programmed to locate and signal low-risk entry and exit zones. Its core algorithm statistically analyzes the market and generates trading signals for overbought, oversold and low volatile areas. By using a well-designed alerting system, this indicator makes it easier to make proper decisions regarding where to enter and where to exit trades. Features Trend-Power Algorithm Low risk Entry Zones and Exit Zones Predictions for Overbought and Over
Berma Bands
Muhammad Elbermawi
5 (9)
Berma 波段 (BBs) 指标对于寻求识别和利用市场趋势的交易者来说是一种有价值的工具。通过分析价格与 BBs 之间的关系,交易者可以辨别市场是处于趋势阶段还是区间波动阶段。 访问[ Berma Home Blog ] 了解更多信息。 Berma 带由三条不同的线组成:上 Berma 带、中 Berma 带和下 Berma 带。这些线围绕价格绘制,直观地表示价格相对于整体趋势的变动。这些带之间的距离可以洞察波动性和潜在的趋势逆转。 当 Berma Bands 线相互分离时,通常表明市场正在进入横盘或区间波动时期。这表明缺乏明确的方向性。交易者可能会发现在这些时期内很难识别趋势,因此可能需要等待更清晰的趋势出现。 当 Berma Bands 线汇聚成一条线时,通常表示趋势环境强劲。这种汇聚表明存在明显的方向性偏差,因为价格波动性足以随趋势而变化。交易者可能会发现在这些时期更容易识别潜在的入场点和出场点,因为趋势的势头可以提供有利的交易机会。然而,重要的是要注意整体趋势中的潜在回调或修正。 Berma 带根据价格蜡烛图与上带和下带的相互作用提供明确的买入和卖出信号。当价格蜡烛图首
筛选:
无评论
回复评论