DoctorEdge V LINE Pump it Dump it Strategy Pro

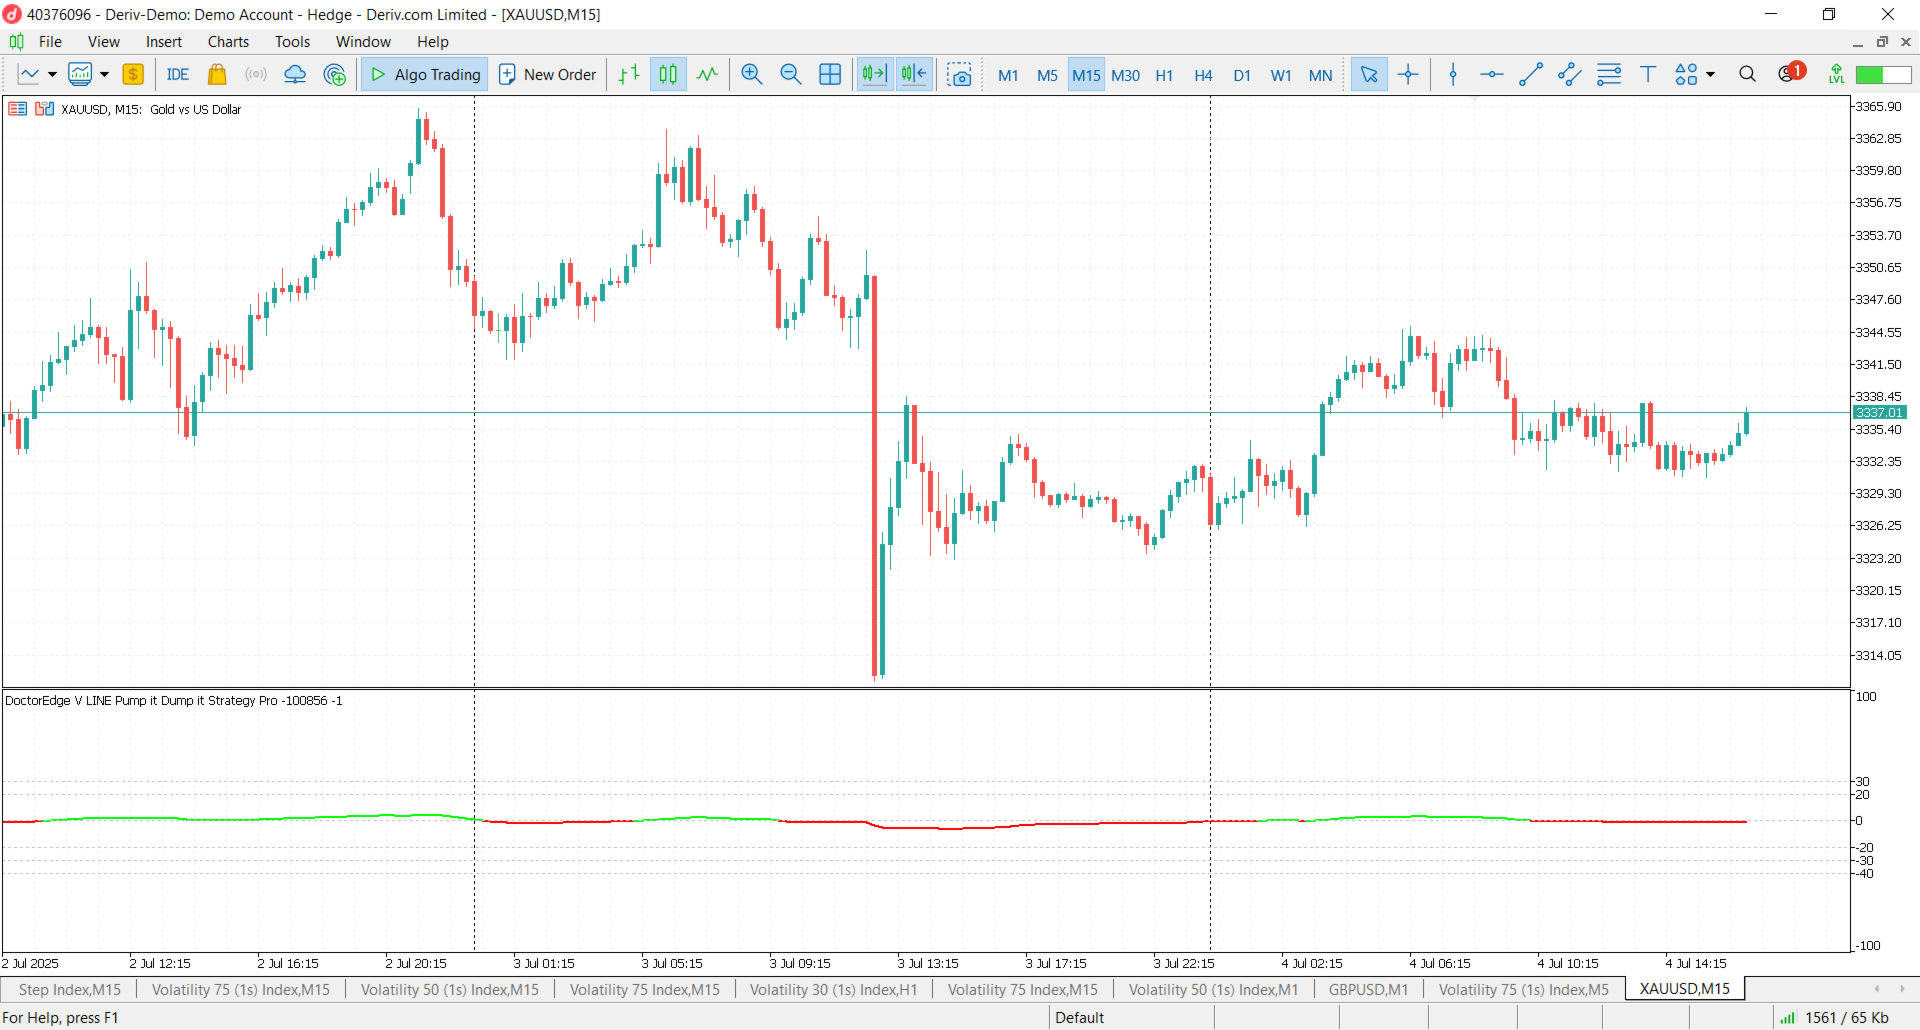
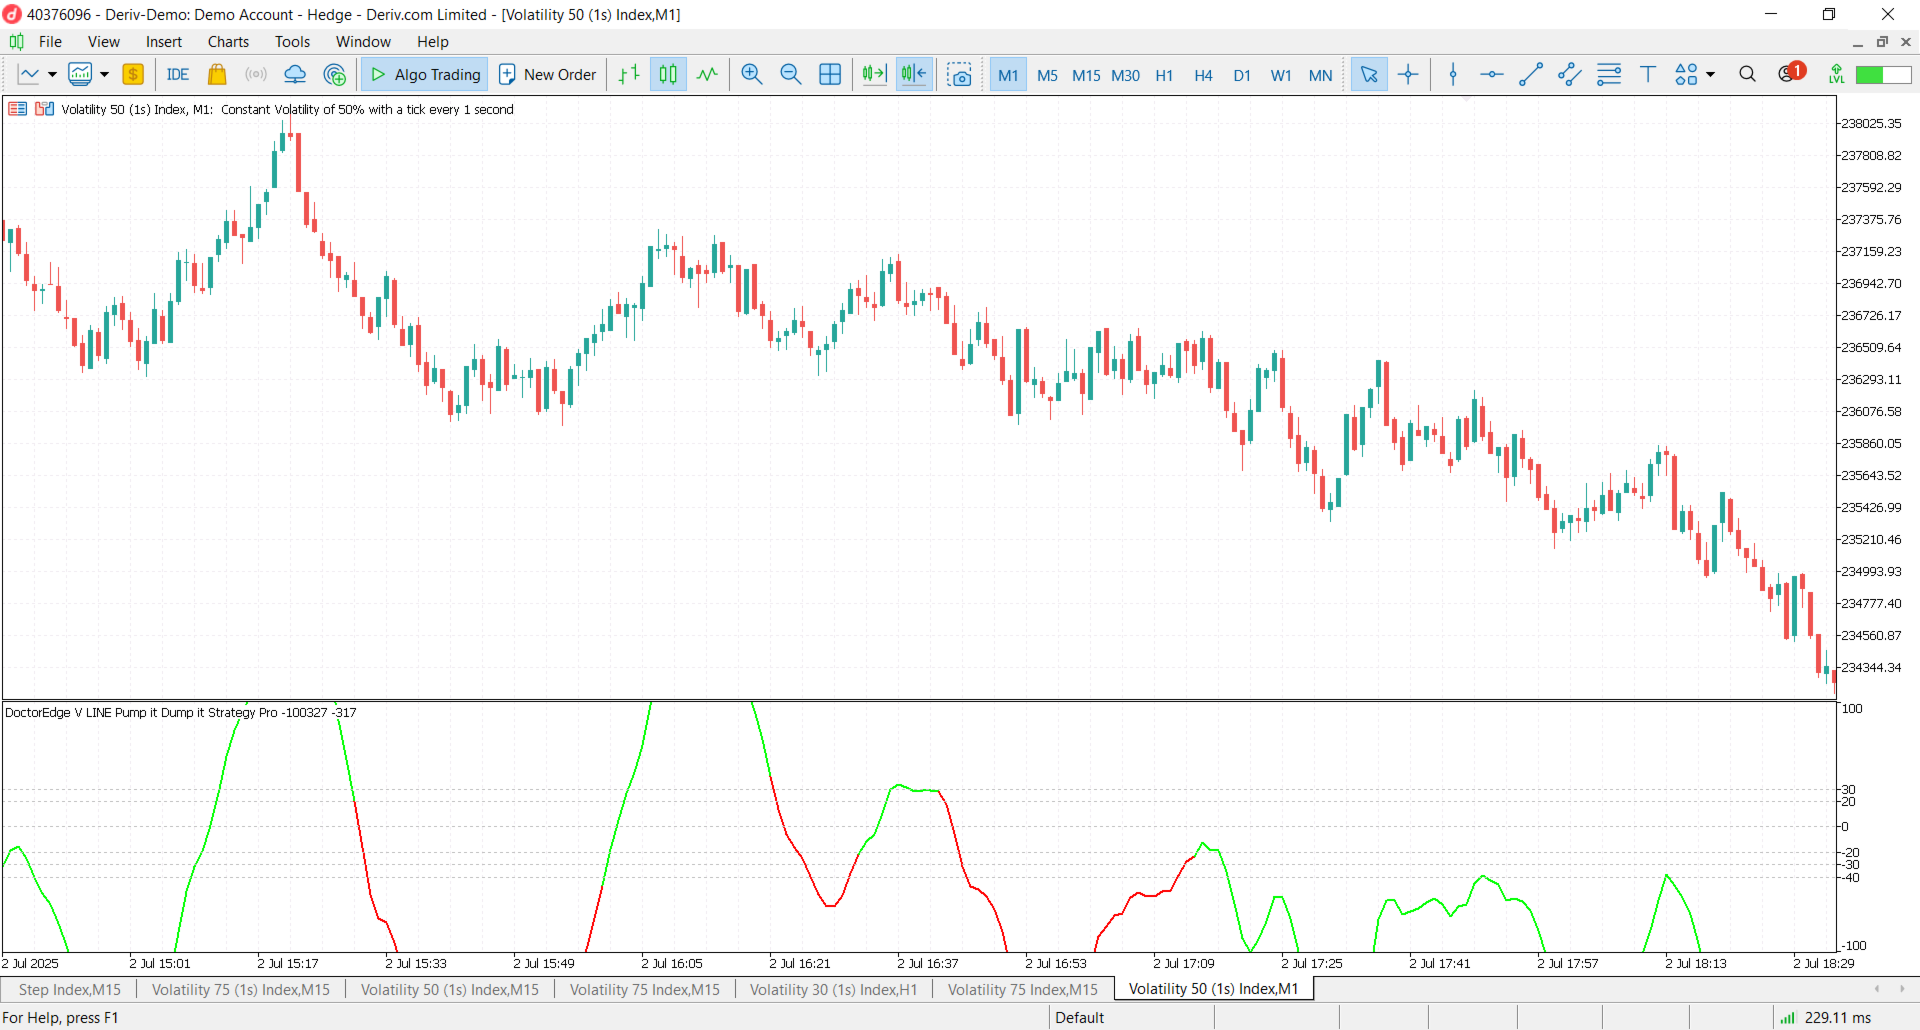
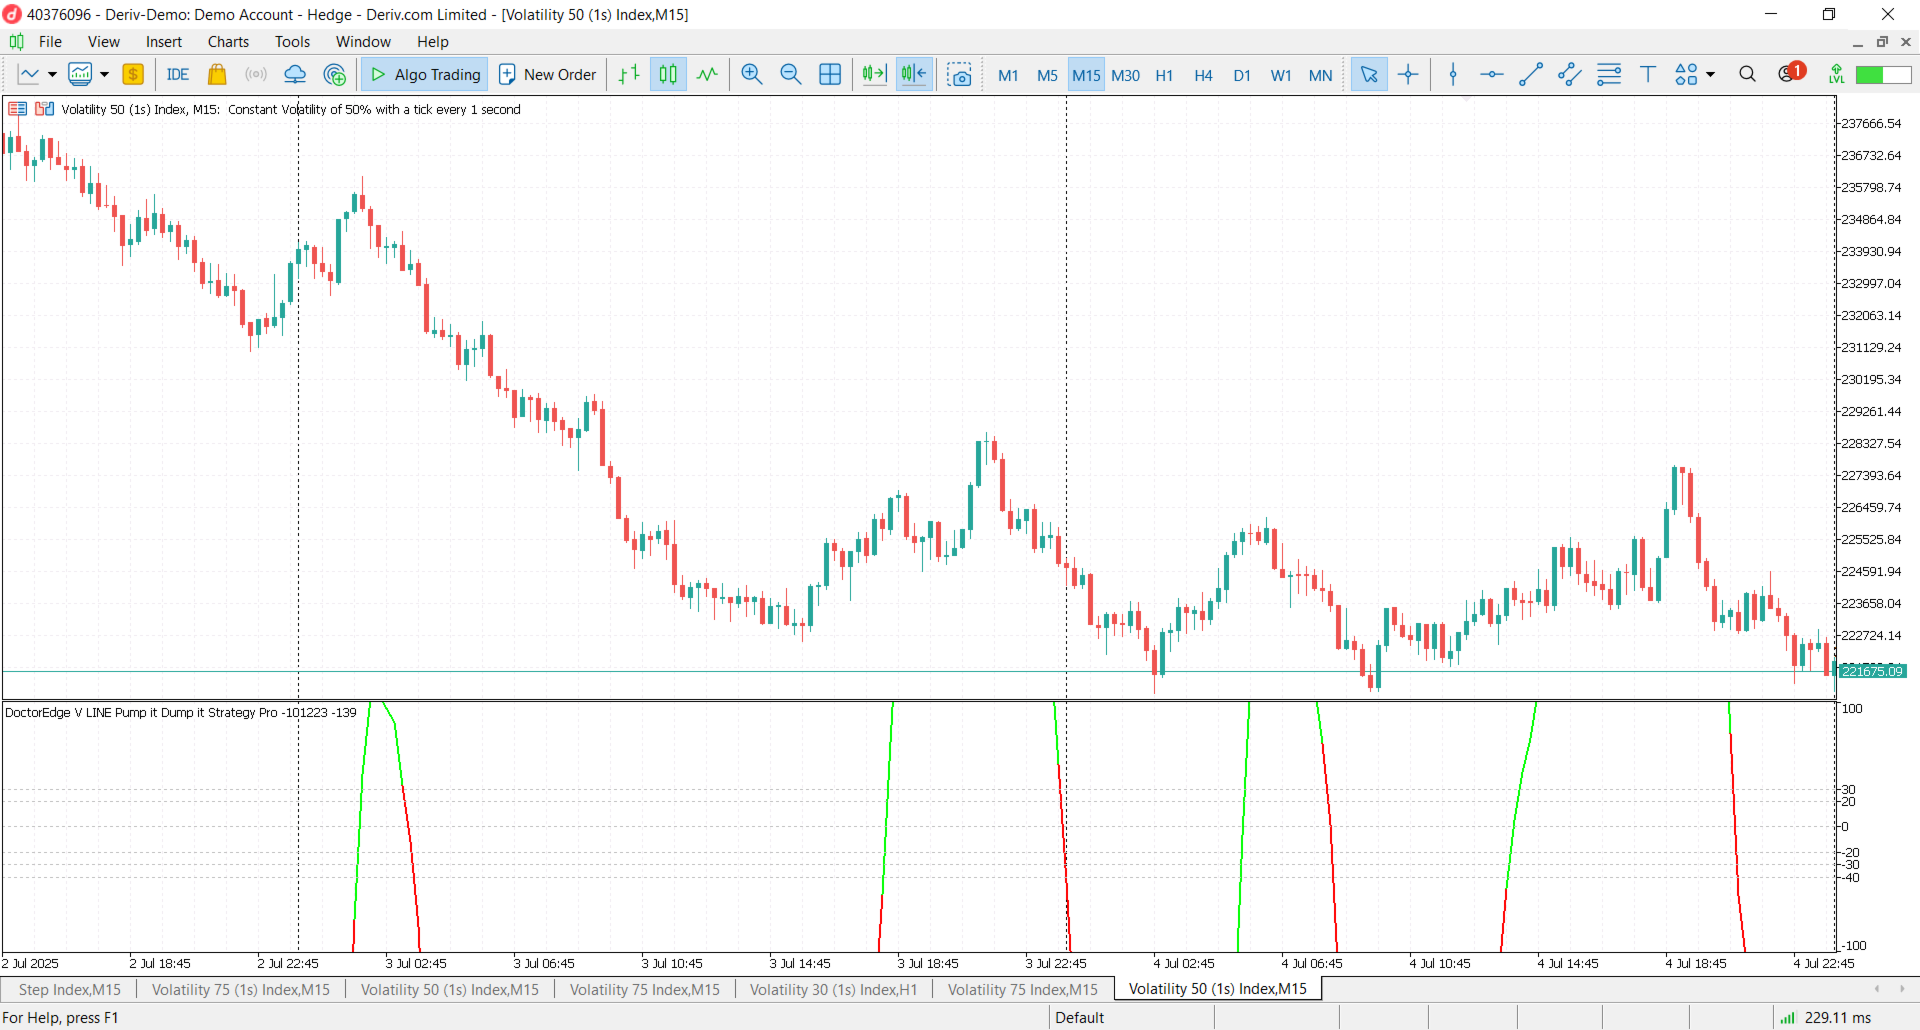
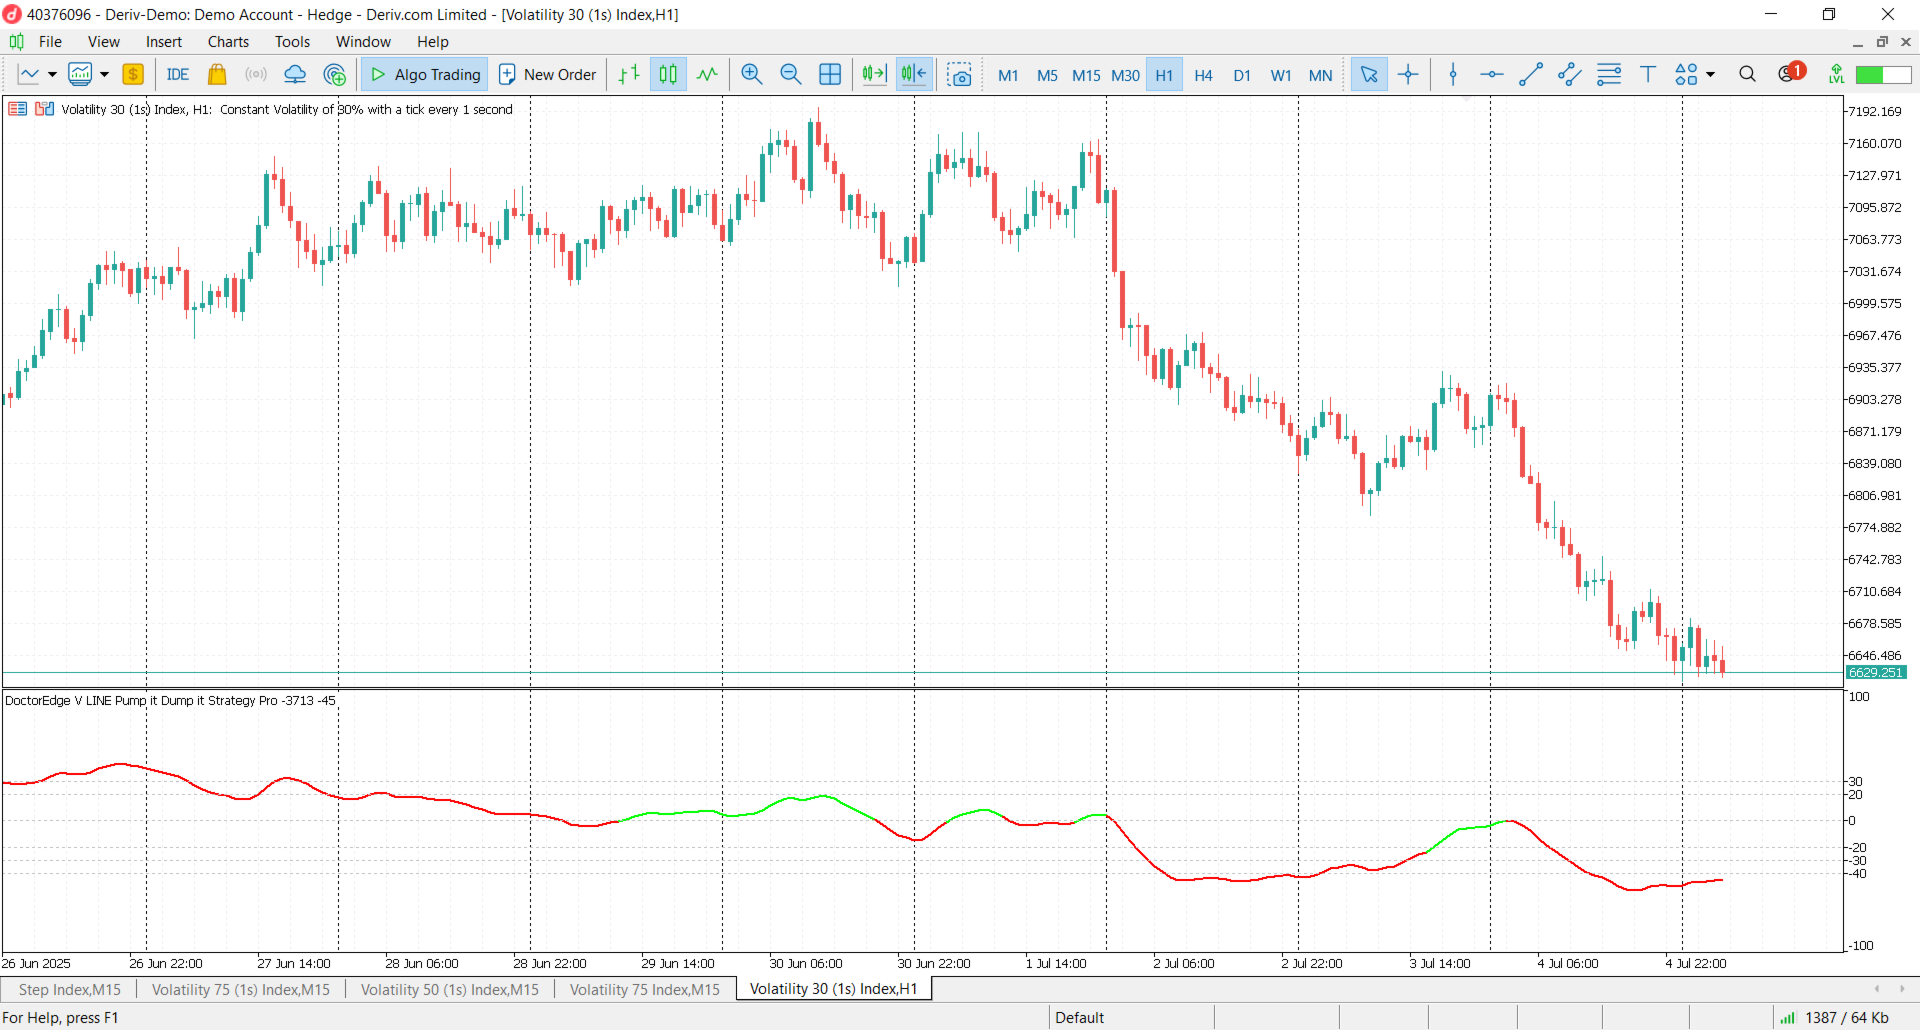
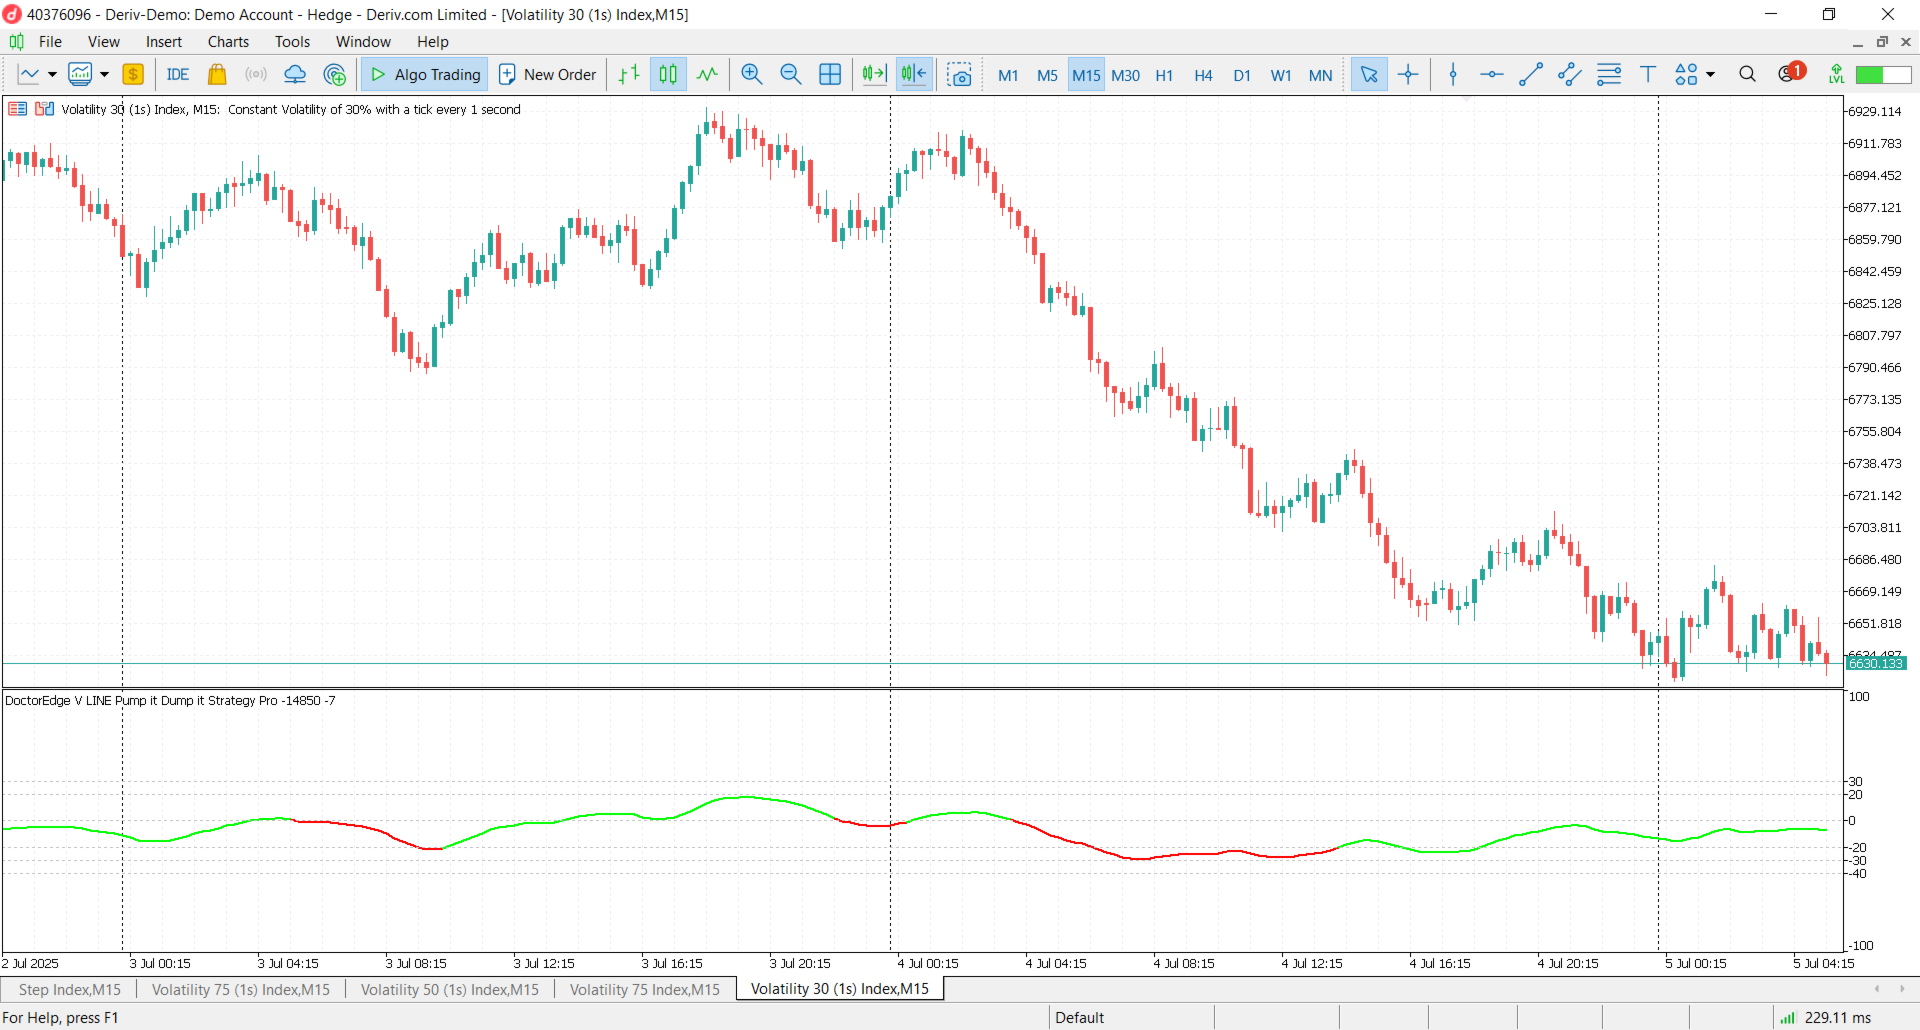
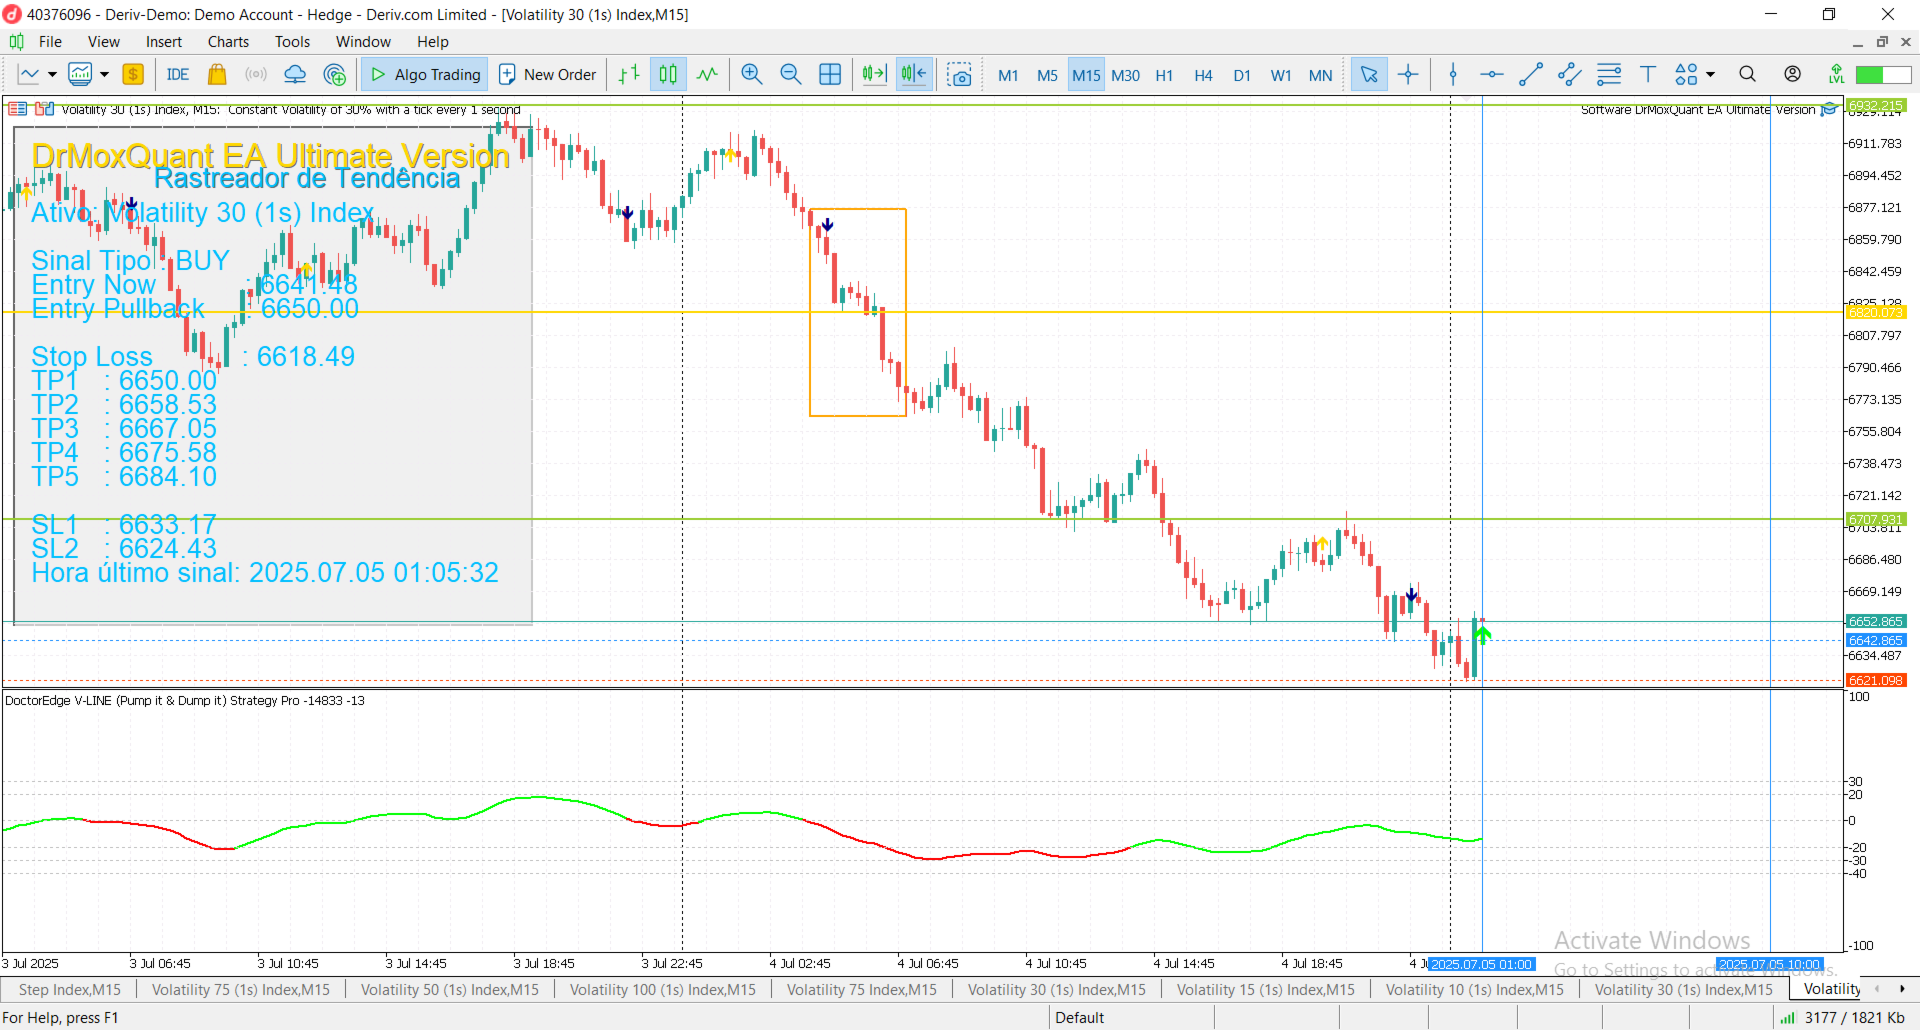
🚀 DoctorEdge V-LINE (Pump it & Dump it) Strategy Pro

Confirms trend direction using smart momentum logic and key price behavior

📌 How It Works

DoctorEdge V-LINE is a smart visual indicator designed to detect trend impulses and confirm their strength based on how price reacts around certain dynamic zones.
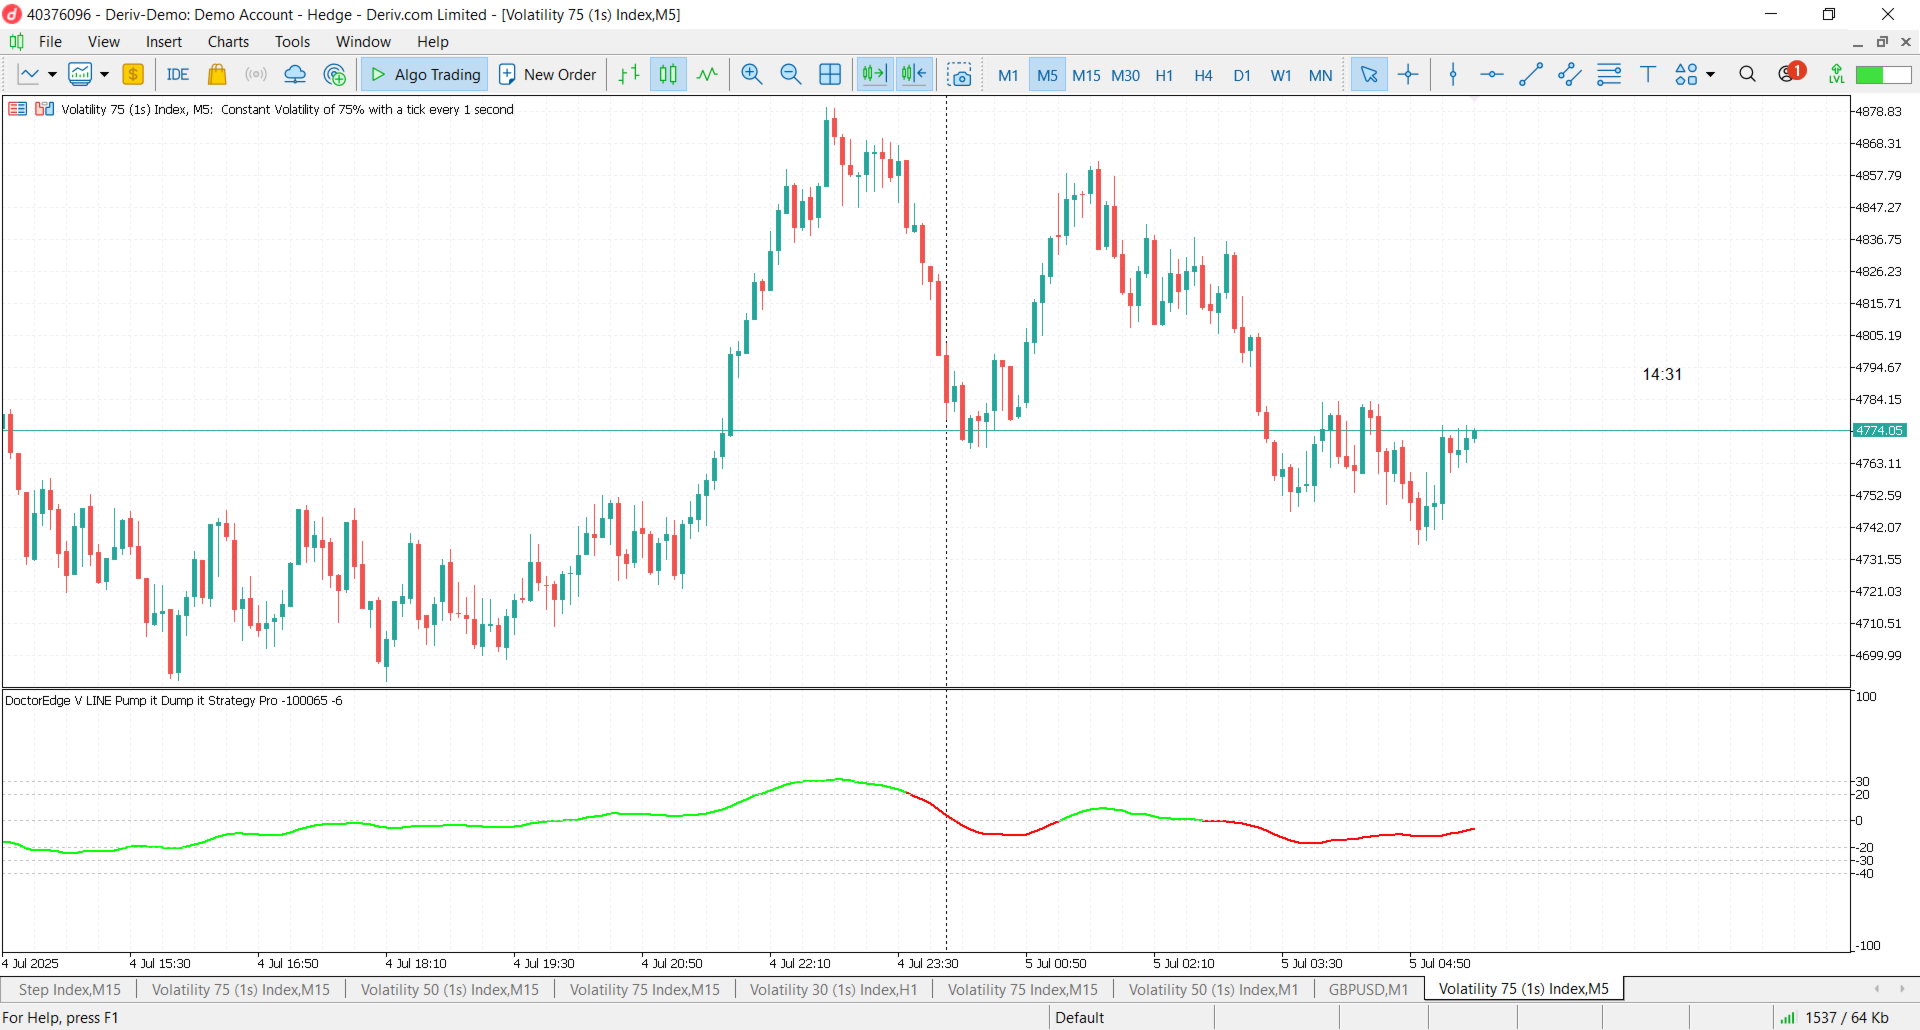
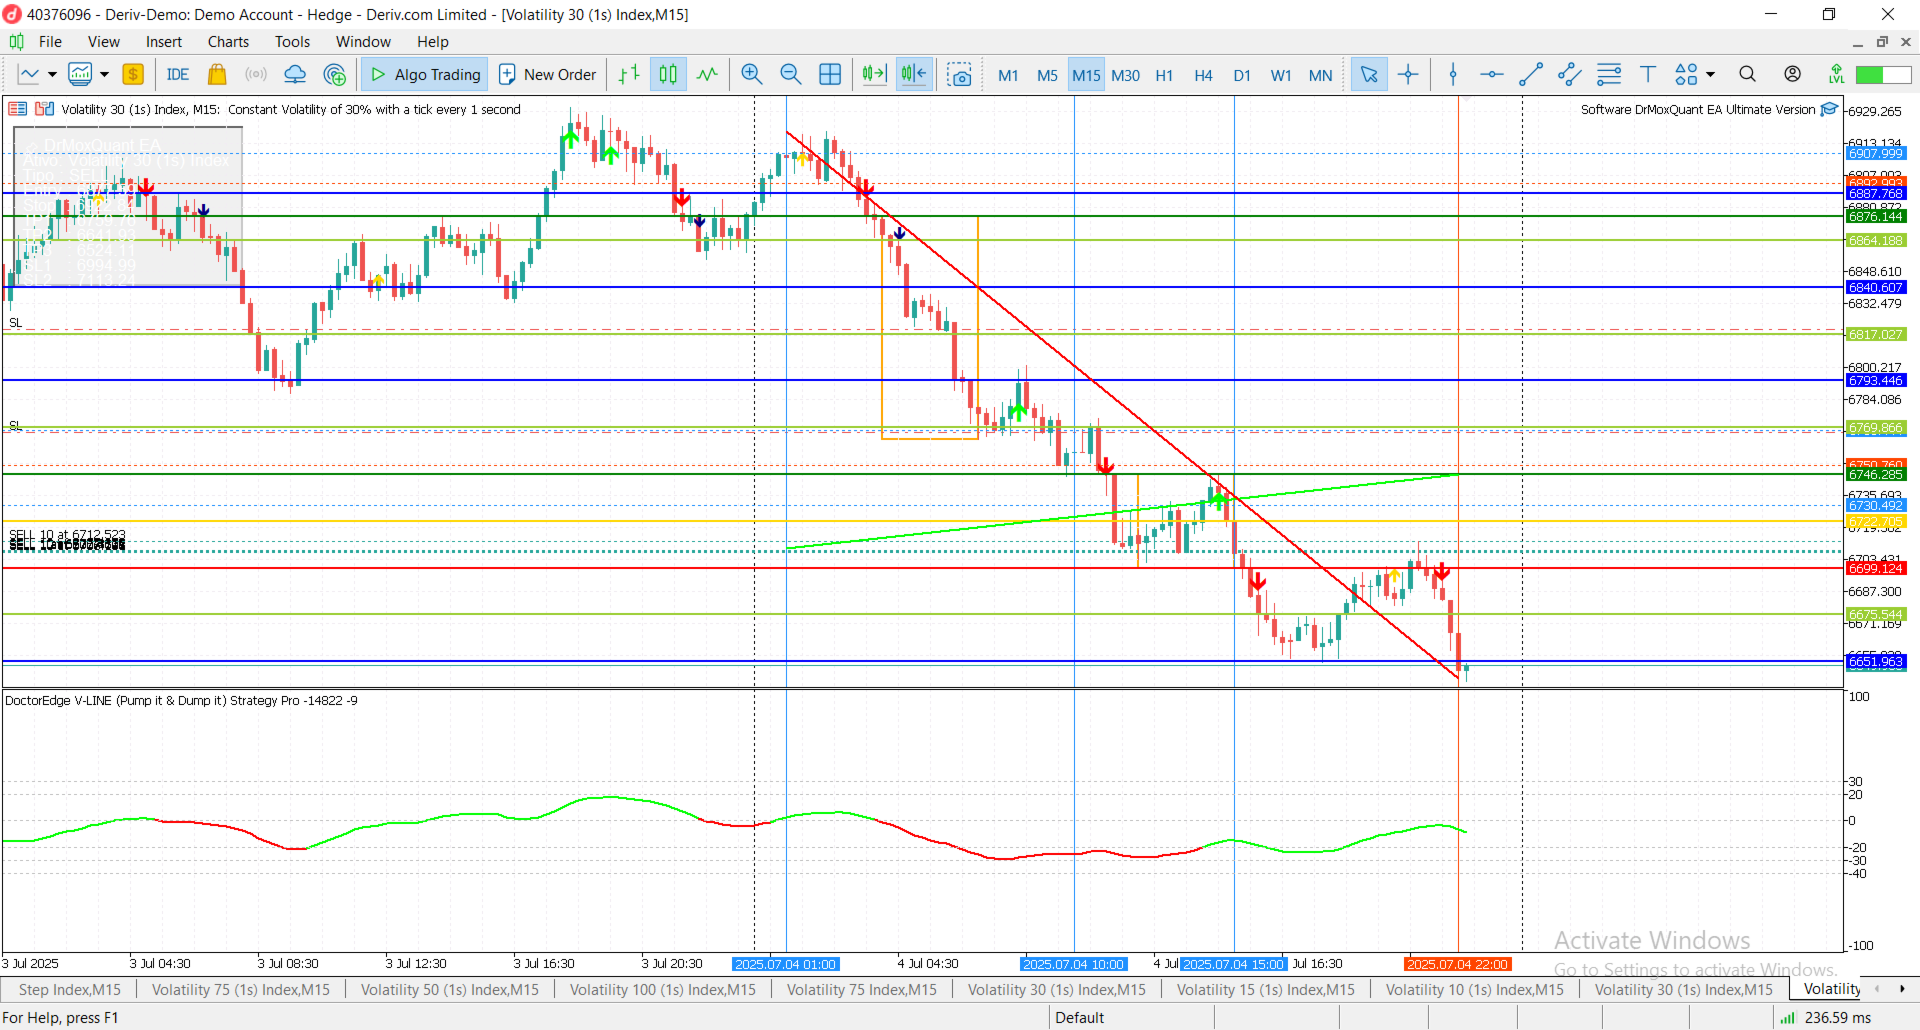
🟢 Buy Trend:
  • When price reaches level -20, the line turns green, signaling a potential buy.

  • If price breaks above level 0 and the line stays green, the uptrend is confirmed.

  • If price does not break 0, the buy may still be valid but could be short-lived.
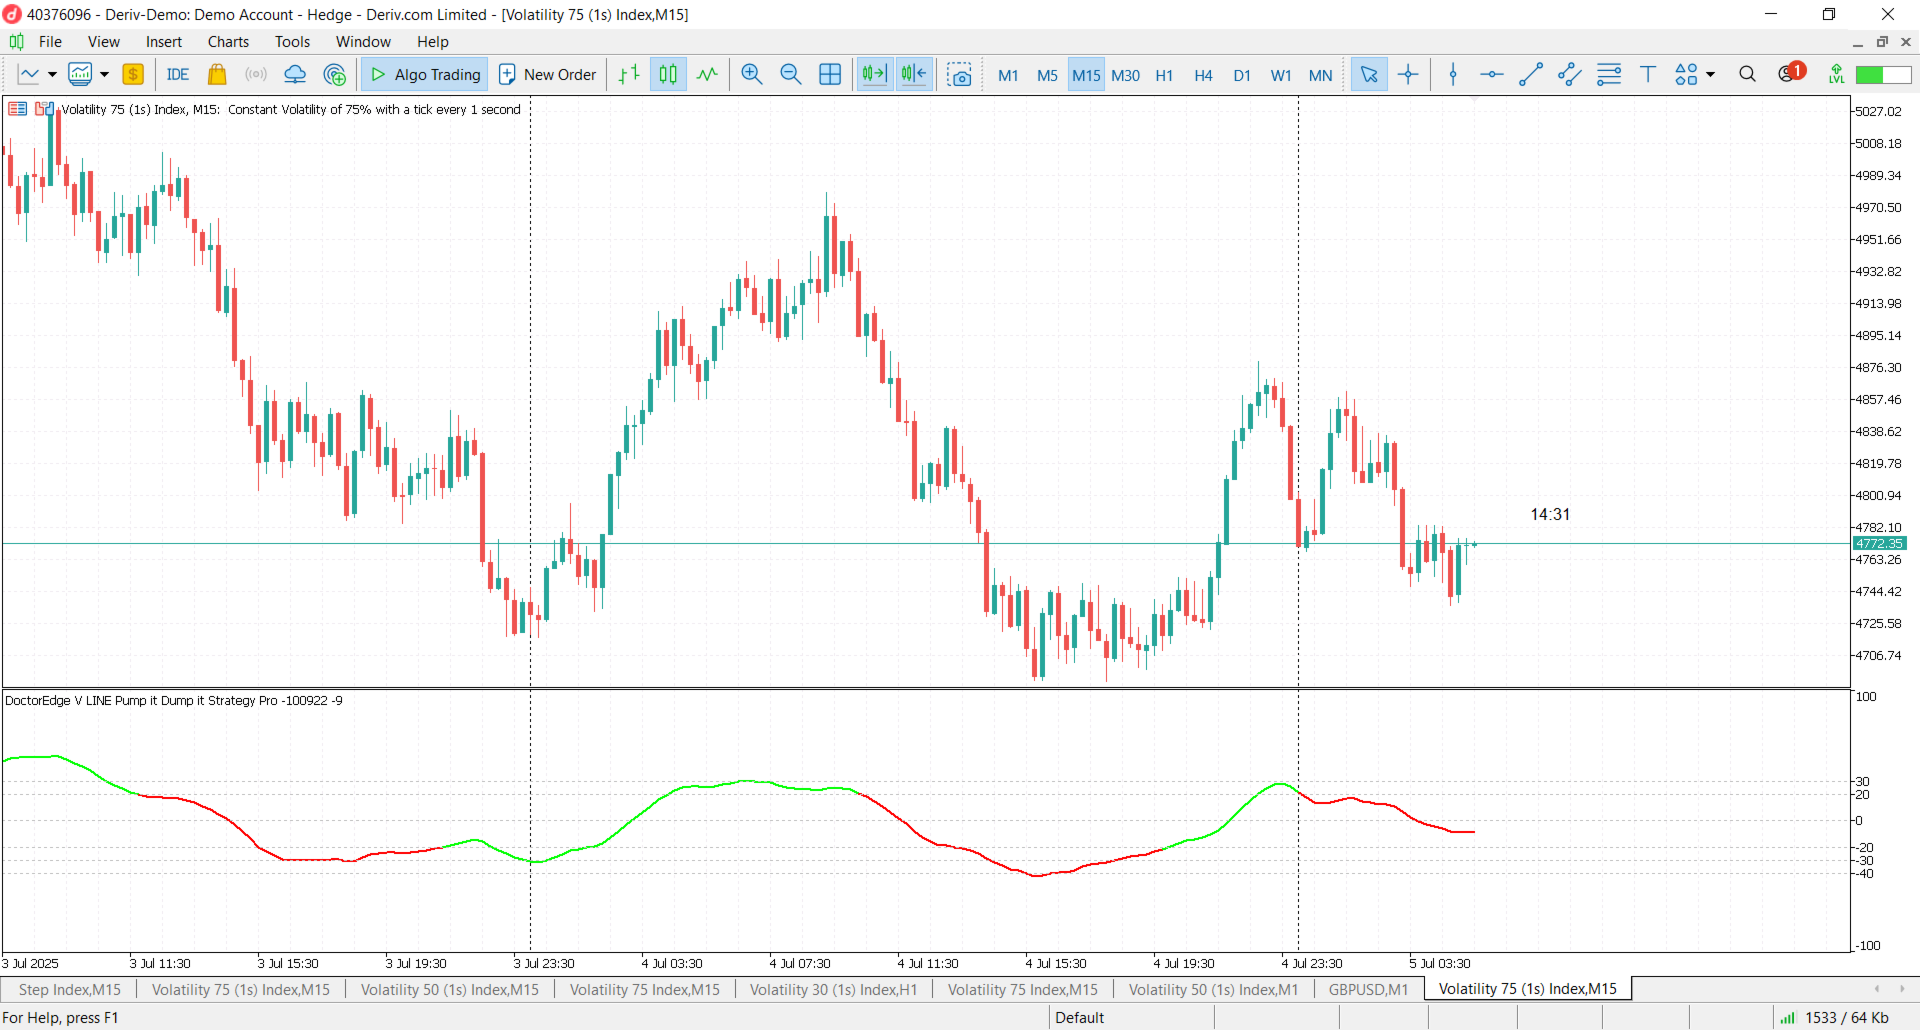
🔴 Sell Trend:
  • When price touches level 20, the line turns red, confirming a sell signal.

  • If price continues below level 0 while the line remains red, the downtrend continues.

  • If price fails to maintain the move, the signal may lose strength.

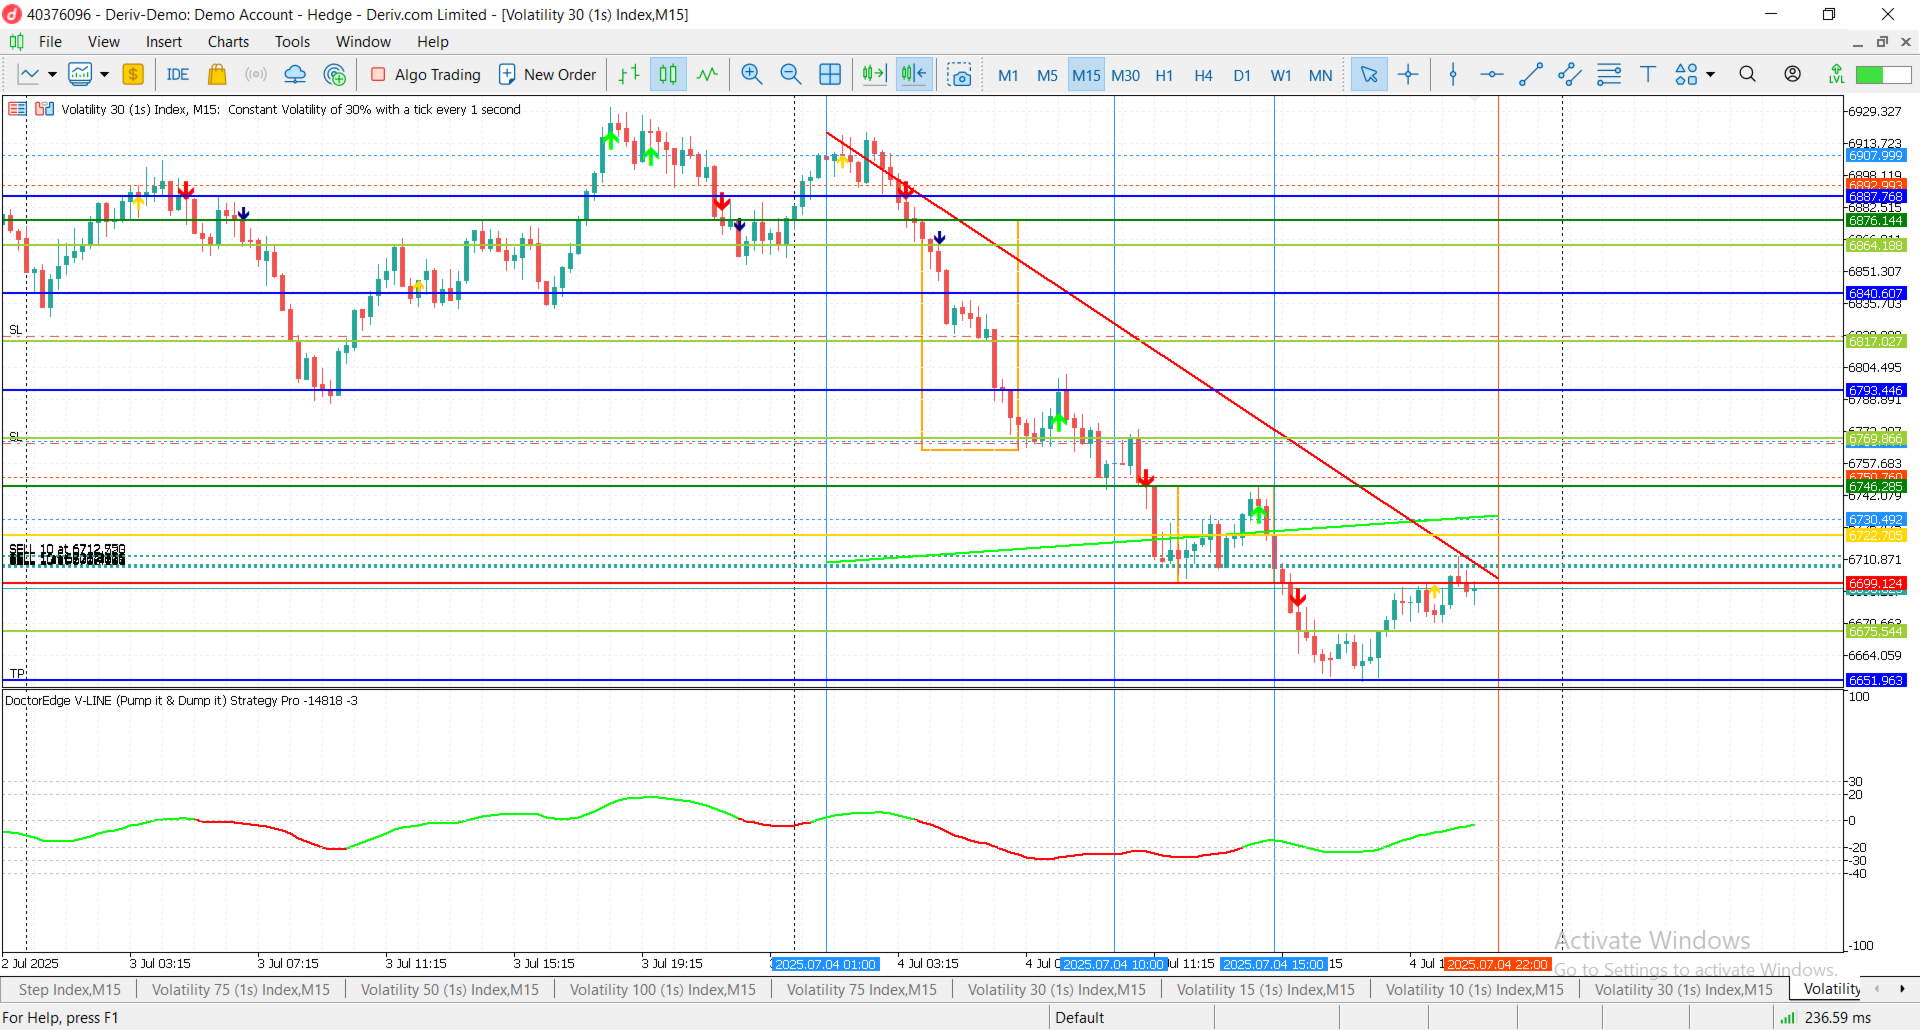
⚠️ Note on Some Assets:

On some assets, the price does not need to reach exactly -20 or 20.
The color change alone is already a valid signal — because it reflects a strong shift in trend force.
When this happens, always confirm using:

  • DrMoxQuant Pro Panel – for overall market direction and TP zones

  • DoctorEdge Strategy Range Breakout Session – for session-based levels and breakout zones

  • ✅ Other indicators from the Doctor Edge Strategy Pro package

Key Advantages

  • 🟢🔴 Instant visual signals: green = buy, red = sell

  • 🧠 Intelligent color changes reflect real-time price momentum

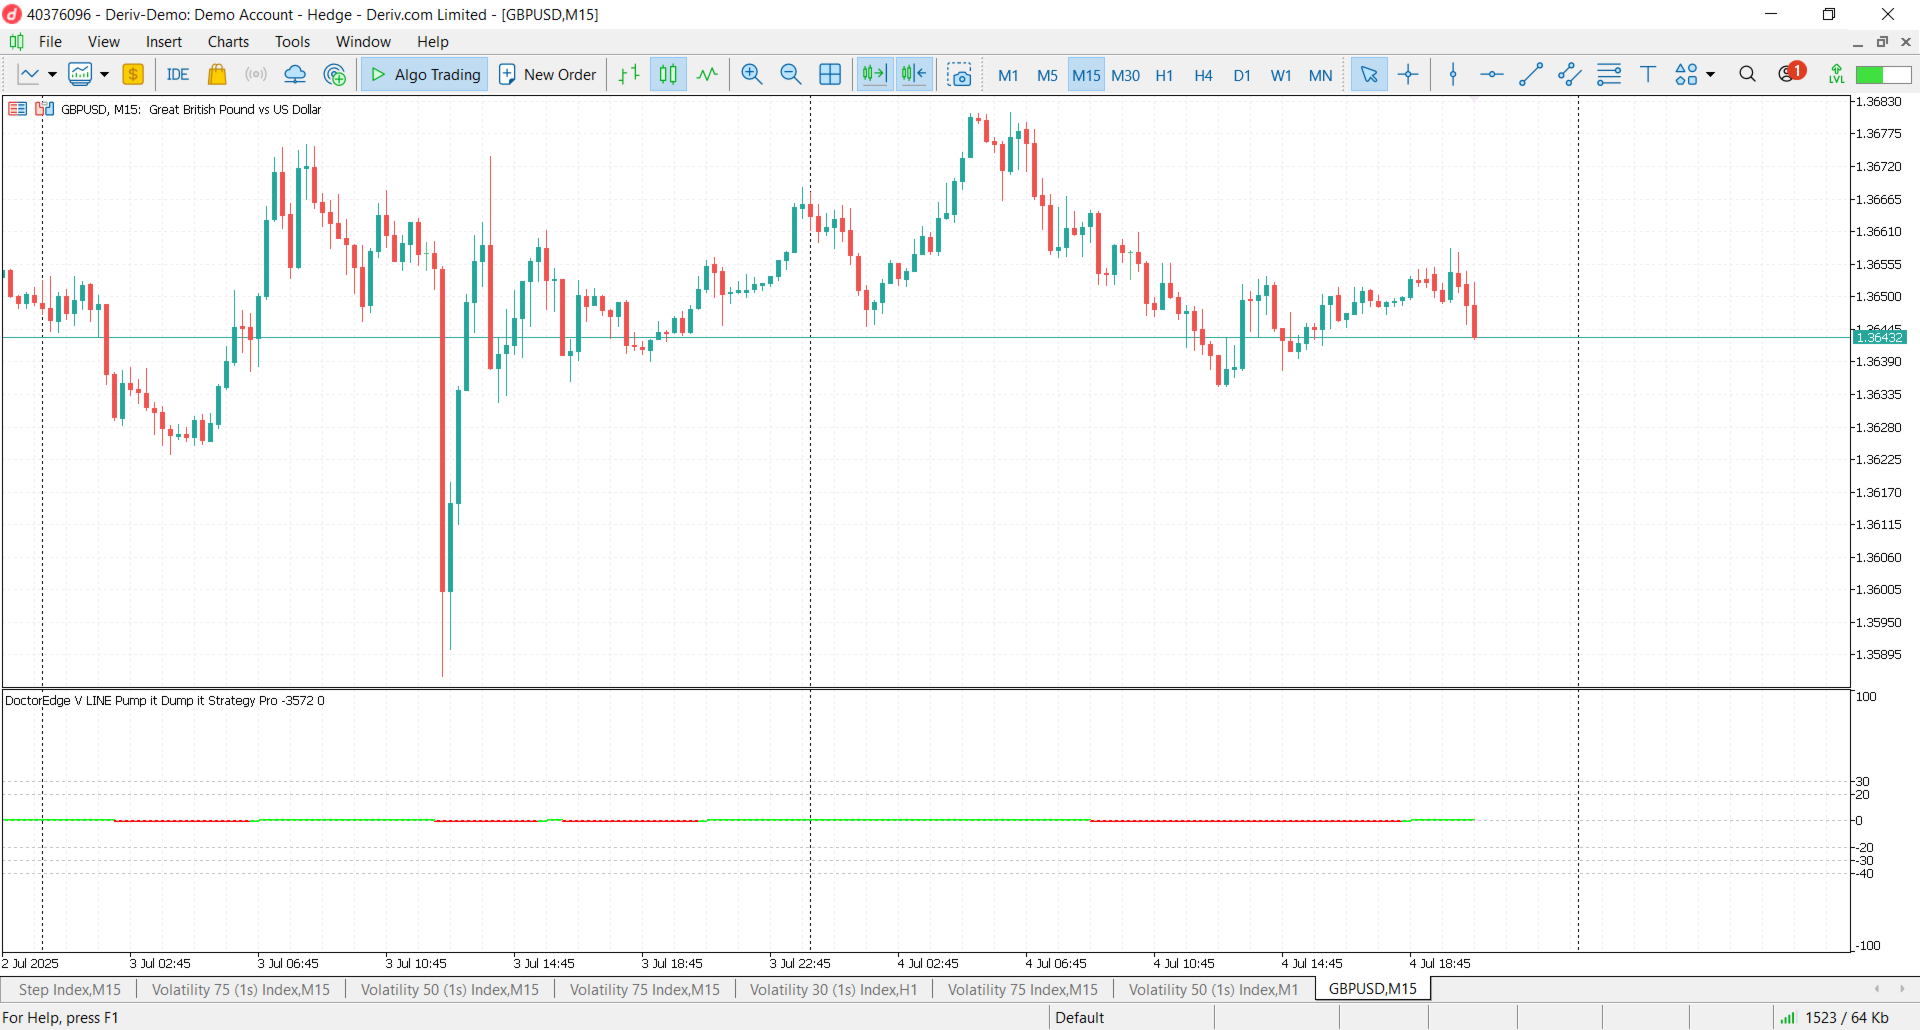
  • 🛠️ Adapts to different asset behaviors (doesn’t rely solely on level hits)

  • 🎯 Confirms strength and avoids false entries

  • 🧩 Designed to be used with the full Doctor Edge toolset

⚙️ Input Parameter

  • EMA_Period = 2

Used for internal smoothing. Do not change to preserve the logic of the strategy.

📢 Recommendation:
Always use this indicator together with the full Doctor Edge Strategy Pro system, available on my MQL5 profile, for maximum confirmation, trend direction, and target level guidance.


推荐产品
BoxChart MT5
Evgeny Shevtsov
5 (7)
The market is unfair if only because 10% of participants manage 90% of funds. An ordinary trader has slim changes to stand against these "vultures". This problem can be solved. You just need to be among these 10%, learn to predict their intentions and move with them. Volume is the only preemptive factor that faultlessly works on any timeframe and symbol. First, the volume appears and is accumulated, and only then the price moves. The price moves from one volume to another. Areas of volume accumu
Owl Smart Levels MT5
Sergey Ermolov
3.97 (31)
MT4版本  |   FAQ Owl Smart Levels Indicator 是一個完整的交易系統,包含 Bill Williams 的高級分形、構建正確的市場波浪結構的 Valable ZigZag 以及標記準確入場水平的斐波那契水平等流行的市場分析工具 進入市場和地方獲利。 策略的详细说明 指示灯使用说明 顾问-贸易猫头鹰助手助理 私人用户聊天 ->购买后写信给我,我会将您添加到私人聊天中,您可以在那里下载所有奖金 力量在於簡單! Owl Smart Levels 交易系統非常易於使用,因此適合專業人士和剛開始研究市場並為自己選擇交易策略的人。 策略和指標中沒有隱藏的秘密公式和計算方法,所有策略指標都是公開的。 Owl Smart Levels 允許您快速查看進入交易的信號,突出顯示下訂單的水平並向您發送有關已出現信號的通知。 優點很明顯: 清楚地顯示主要和更高時間框架的趨勢方向。 指示儀器信號的出現。 標記開單、止損設置和固定利潤的水平。 沒有多餘的,只有必要的結構! ZigZag 表示全球趨勢的方向,因此也表示貿易方向。 市場反轉點的短線清楚地表明在什麼水平上構建斐波那
该指标建立当前报价,可以与历史报价进行比较,并在此基础上进行价格走势预测。指示器有一个文本字段,用于快速导航到所需日期。 选项: 符号 - 选择指标将显示的符号; SymbolPeriod - 选择指标从中获取数据的时段; IndicatorColor - 指示器颜色; HorisontalShift - 由指标绘制的报价移动指定的柱数; Inverse - true 反转引号,false - 原始视图; ChartVerticalShiftStep - 图表垂直移动(键盘上的向上/向下箭头); 接下来是文本字段的设置,您可以在其中输入日期,您可以通过按“回车”立即跳转到该日期。 接下来是文本字段的设置,您可以在其中输入日期,您可以通过按“回车”立即跳转到该日期。
PZ Cup and Handle MT5
PZ TRADING SLU
3 (2)
杯子和手柄模式是类似于杯子和手柄的技术价格结构,其中杯子呈“ U”形,并且手柄略有向下漂移。图案的右侧-手柄-小于左侧-杯形,并且从顶部回撤不超过50%。它既可以是延续模式,也可以是逆转模式。 [ 安装指南 | 更新指南 | 故障排除 | 常见问题 | 所有产品 ] 清除交易信号 可自定义的颜色和尺寸 实施绩效统计 可自定义的尺寸和图案特征 显示适当的止损和获利水平 它是不可重涂和不可重涂的 它实现了电子邮件/声音/视觉警报 输入参数 幅度:幅度表示替代价格点之间的最小柱线量。要找到大图案,请增加幅度参数。要查找较小的模式,请减小幅度参数。 杯子平整度比率:此参数描述杯子的顶部相对于杯子大小的“平整度”。较高的值将发现更严格的模式,但频率较低。较低的值将找到更多的模式。 最小句柄回撤:模式句柄中需要的最小百分比回撤。 最大。回撤:模式句柄中可能的最小百分比回撤。 最大历史柱数:指标在图表中加载时要评估的过去柱数。 显示统计信息:显示或隐藏统计信息显示板和效果数据。 显示止损/止盈水平:显示或隐藏止损和止盈水平。 绘图选项:看涨或看跌的线条和标签的颜色和大小以及字体大小。 突破:突破
Currency Strength Lines
Augusto Martins Lopes
MetaTrader 5 货币强度指标 该指标分析主要外汇货币的相对强度,提供直观的可视化展示,让交易者快速识别哪些货币正在增强或减弱。它评估主要货币对(EUR、USD、GBP、JPY、AUD、NZD、CAD、CHF),并根据所选的计算方法(如RSI或ROC)计算其强度。 结果以单独的货币线显示,方便识别市场趋势和潜在交易机会。指标还可基于货币交叉情况自动生成买入、卖出或中性信号。 主要功能: 同时分析主要外汇货币。 通过不同方法计算强度(RSI、ROC、移动平均线)。 清晰展示各货币强度变化。 自动生成买入、卖出及中性信号。 可自定义面板,调整颜色、布局和位置。 兼容经纪商的前缀和后缀。 可选的警报和通知功能。 该指标易于使用,适用于所有时间周期。只需添加到图表并根据您的交易策略调整设置。适合希望获得市场货币强度直观分析的交易者。
PREngulfing
Slobodan Manovski
PR EA - 吞没形态交易系统 自动识别吞没形态,均线确认信号 PR EA是一款MetaTrader 5专家顾问,专门用于识别并交易看涨/看跌吞没形态,并通过移动平均线过滤确认信号。优化适用于30分钟图表,同时兼容M15和H1时间框架。 核心功能: 形态识别 - 精准检测有效的吞没K线形态 趋势确认 - 238周期SMA过滤器(参数可调) 风险管理 - 自定义止损、止盈 + 可选追踪止损 时间框架优化 - 专为M30图表设计(兼容M15/H1) 仓位控制 - 同一时间仅持有一个仓位 推荐设置: 最佳表现:M30时间框架 不建议使用:高于H1的时间框架 自定义选项: 可调整交易手数 灵活设置止损/止盈值 追踪止损功能 均线周期调节 点差过滤,避免低效执行 适合以下交易者: 偏好自动K线形态交易 需要均线确认的反转策略 波段交易(30分钟-1小时图表) 规则明确的交易系统 "通过均线确认的吞没形态交易信号" MT5专用 • 需MetaTrader 5平台 • 兼容所有经纪商
##   ONLY GOLD ##   Тiльки Золото ## **Mercaria Professional Trading Zones - Complete Guide** ## **Mercaria Professional Trading Zones - Повний посібник** ### **How Mercaria Zones Work / Як працюють зони Mercaria** **English:** Mercaria Zones is an advanced trading indicator that identifies high-probability support and resistance areas using ZigZag extremes combined with mathematical zone calculations. The indicator works on multiple timeframes simultaneously, providing a comprehensive view
用於確定平面和趨勢的指標。 如果價格低於兩條直方圖和兩條線(紅色和藍色)中的任何一條,則這是一個賣出區域。 購買此版本的指標時,一個真實賬戶和一個模擬賬戶的 MT4 版本 - 作為禮物(收到,給我寫私信)! 如果價格高於兩條直方圖和兩條線(紅色和藍色)中的任何一條,則這是一個買入區域。 MT4 版本: https://www.mql5.com/en/market/product/3793 如果價格在兩條線之間或在任何直方圖的區域內,那麼市場就沒有明確的趨勢。簡單地說,市場是平的。 指標的工作在屏幕截圖中更清楚地顯示。 該指標可用作獨立的交易系統。該指標可用於獲取領先數據或確定當前趨勢的方向。對於任何級別的交易者來說,這都是一個很好的工具!
Gioteen Volatility Index (GVI) - your ultimate solution to overcoming market unpredictability and maximizing trading opportunities. This revolutionary indicator helps you in lowering your losing trades due to choppy market movements. The GVI is designed to measure market volatility, providing you with valuable insights to identify the most favorable trading prospects. Its intuitive interface consists of a dynamic red line representing the volatility index, accompanied by blue line that indicate
Advanced 4xZeovo MT5 Indicator (MetaTrader 5)   Product Description  4xZeovo is a powerful trading indicator system monitoring 24/7 financial markets. Metatrader5 tool designed to find the best buying/selling opportunities and notifies the user.    Making life easy for traders in helping with the two most difficult decisions with the use of advanced innovate trading indicators aiming to encourage users to hold the winning positions and take profit at the best times.    Equipped with a unique tra
AW Candle Patterns
AW Trading Software Limited
AW 蜡烛形态指标是高级趋势指标与强大的蜡烛形态扫描仪的组合。它是识别和突出显示 30 个最可靠的烛台形态的有用工具。此外,它是一个基于彩色条的电流趋势分析器,带有   可调整大小和定位的插件多时间框架趋势面板。根据趋势过滤调整模式显示的独特能力。 优点: 轻松识别蜡烛形态 不重绘结果 内置多时间趋势面板 禁用模式类型(1、2、3 根蜡烛) 显示形态时趋势过滤的调整 MT4 version -> HERE  / Instructions and description  -> HERE 显示模式列表: 锤模式 固定/固定 看跌 Harami / 看涨 Harami 看跌 Harami Cross / 看涨 Harami Cross 枢轴点反转向上/枢轴点反转向下 双柱低位收盘价较高/双柱低位收盘价较低 收盘价反转向上 / 收盘价反转向下 中性条 /     两个中性条 双内/内/外 向上推力杆/向下推力杆 晚星/晨星 晚上十字星 / 早上十字星 吞没看跌线/吞没看涨线 镜子酒吧 流星 乌云盖顶 十字星 输入变量: Main settings Trend Filtering Mode
OVERVIEW This script plots   Machine Learning Key Levels   on your chart by detecting historical pivot points and grouping them using agglomerative clustering to highlight price levels with the most past reactions. It combines a pivot detection, hierarchical clustering logic, and an optional silhouette method to automatically select the optimal number of key levels, giving you an adaptive way to visualize price zones where activity concentrated over time. CONCEPTS Agglomerative cluster
Blahtech Market Profile MT5
Blahtech Limited
5 (10)
Was: $249  Now: $149   Market Profile defines a number of day types that can help the trader to determine market behaviour. A key feature is the Value Area, representing the range of price action where 70% of trading took place. Understanding the Value Area can give traders valuable insight into market direction and establish the higher odds trade. It is an excellent addition to any system you may be using. Inspired by Jim Dalton’s book “Mind Over Markets”, this indicator is designed to suit the
PipFinite Exit EDGE MT5
Karlo Wilson Vendiola
4.86 (29)
Did You Have A Profitable Trade But Suddenly Reversed? In a solid strategy, exiting a trade is equally important as entering. Exit EDGE helps maximize your current trade profit and avoid turning winning trades to losers. Never Miss An Exit Signal Again Monitor all pairs and timeframes in just 1 chart www.mql5.com/en/blogs/post/726558 How To Trade You can close your open trades as soon as you receive a signal Close your Buy orders if you receive an Exit Buy Signal. Close your Sell orders if
Tick Volume Indicator
Thiago Pereira Pinho
A professional order flow and volume analysis tool that tracks real-time tick dominance between buyers and sellers, highlighting strength, weakness, and absorption zones through dynamic histogram layers . Unlike traditional tick volume indicators, this tool introduces a multi-layer system with variable thickness, providing an intuitive view of market aggression and absorption directly on the chart. Key Features: Real-time tick tracking : counts bullish and bearish ticks during the current c
Renko Plus
Eadvisors Software Inc.
With Renko Plus you can use the features in the Indicator functionality, just add it to the Metatrader5 chart.             The Renko chart is a type of chart, developed by the Japanese, that is constructed using price movement rather than standardized prices and time intervals like most charts. It is believed to be named after the Japanese word for bricks, "renga", as the graphic looks like a series of bricks.             A new brick is created when the price moves a specified pri
Heiken Ashi Smoothed Strategy is a very simple but powerful system to get forex market trend direction. This indicator is actually 2 indicators in 1 pack, Heiken Ashi and Heiken Ashi Smoothed Moving Average both included. Because HA (Heiken Ashi) and HAS (Heiken Ashi Smoothed) are calculated in the same one system event with necessary buffers and loop only, so it is the FAST, OPTIMIZED and EFFICIENT HA having the combined indicator of MetaTrader 5. You can choose to display HA and HAS in the sam
Mega Indicator MT5
Szymon Palczynski
Price reach indicator. It also serves as the perfect term for supports and resistance. I use it in two experts. The basic tool for professional trading. The indicator analyzes the last 500 bar and uses this to determine the levels ( but it doesn't predict the future ) . Personally, I use it on TF H1.  It is very simple. Four lines on chart and that's all. Only two input parameters.  Thousands of indicators. Why this? Is good ? No! Is very good. Please test the indicator prior to purchasing. You
Supertrend indicator uses a combination of a moving average and average true range to detect the trend of a trading instrument. Supertrend indicator for MetaTrader 5 easily shows the trend as a line following the price. Triple SuperTrend Histo indicator  calculate  three supertrends to show the trend as a histogram. Changing the color from red to green means you can BUY , from green to red means you can SELL . Description of the method of drawing a histogram. The price is above the EMA 200,
可以说,这是您可以为MetaTrader平台找到的最完整的谐波价格形成自动识别指标。它检测19种不同的模式,像您一样认真对待斐波那契投影,显示潜在的反转区域(PRZ),并找到合适的止损和获利水平。 [ 安装指南 | 更新指南 | 故障排除 | 常见问题 | 所有产品 ] 它检测19种不同的谐波价格形态 它绘制了主要,衍生和互补的斐波那契投影(PRZ) 它评估过去的价格走势并显示每个过去的形态 该指标分析其自身的质量和性能 它显示合适的止损和获利水平 它使用突破来表明合适的交易 它在图表上绘制所有样式比率 它实现了电子邮件/声音/视觉警报 受斯科特·M·卡尼(Scott M. Carney)的书的启发,该指标旨在满足最纯粹和最熟练的交易者的需求。但是,它采取了一种使交易更容易的方式:在向交易发出信号之前,它会等待Donchian朝正确方向突破,从而使交易信号非常可靠。 斐波那契投影与向量无关 它实现了电子邮件/声音/推送警报 它绘制了ABCD投影 重要提示: 为了符合 Scott M. Carney先生 的商标申诉,某些图案名称已重命名为不言自明的替代方式, Scott M.
VR Grid Mt5
Vladimir Pastushak
3 (7)
VR 网格指示器 设计 用于创建具有用户定义设置的图形网格。与 标准网格 不同,VR 网格用于构建 圆形关卡 。根据用户的选择,轮次级别之间的步长可以是任意的。此外,与其他指标和实用程序不同,即使时间段发生变化或终端重新启动,VR Grid 也能保持网格的位置 。 设置、设置文件、演示版本、说明、问题解决,可以从以下位置获取 [博客] 您可以在以下位置阅读或撰写评论 [关联] 版本为 [MetaTrader 4] 垂直级别 基于实际时间间隔并 忽略缺失 或不存在的周期。因此,级别之间的步长严格对应于用户选择的值。 使用 VR 网格指标时,交易者 可以更改任何级别的垂直线和水平线的样式 、颜色和粗细。这使您可以控制金融工具的 回合水平 。 整数位是 以两个或多个零结尾 的价格(例如:1.23500、5.65900、1923.200)。人们相信,这样的水平 经常充当 作为支撑或阻力的强点。 Horizontal line settings Horizontal line step Horizontal line color Horizontal line style Horizonta
FREE
1.7*24小时全时在线,安全,可靠,低延时ping; 2.按券商要求智能跟单,详见英文简介   3.本系统仅提供跟单软件服务,不提供交易策略,不代单操作; 4.不限交易手数,客户自行设置A仓手机app端即可,不额外收费 5.客户可按月,季,年付费方式,不同方式,不同优惠,先付费后使用; 6.因券商MT5服务器异常,导致断网后跟单异常,客户需自行风控处理,本系统不提供风控处理 7.券商下单规则改变,会自动更新最新跟单系统 8.详细购买流程,请咨询  wehcat  :zfflyer; 9.再次强调,本系统,仅保障以技术层面实现跟单功能,不参与客户的下单,交易策略,以及风控措施。 10.本系统已稳定运行9个月,经历各种复杂行情考验,稳定,可靠
賺錢和研究的工具。 交易信號和策略的核心是基於作者的價格預測模式形成算法。適用於任何樂器!輔以基於 MA "九尾狐" 的控制系統,盡可能準確地更新和調整市場、儀器和工作期間的信號。 合格:所有市場中的所有工具(有例外)。 適用對象:對沖基金、基金和資產經理、投資經理、投機者、投資者和利益相關者。 ..................................................................................................................................................................................
Noize Absorption Index
Ekaterina Saltykova
Noize Absorption Index - is the manual trading system that measures the difference of pressure between bears forces and bulls forces. Green line - is a noize free index that showing curent situation. Zero value of index shows totally choppy/flat market.Values above zero level shows how powerfull bullish wave is and values below zero measures bearish forces.Up arrow appears on bearish market when it's ready to reverse, dn arrow appears on weak bullish market, as a result of reverse expectation.
Weis Wave Scouter
Jean Carlos Martins Roso
通过 Weis Wave Scouter,您可以深入掌握先进的成交量分析技术。这款革命性的MetaTrader 5指标结合了久经验证的Wyckoff方法和VSA(成交量价差分析)理念,专为追求高精度和深度洞察的交易者量身打造。Weis Wave Scouter通过累计成交量波动分析,为市场提供战术性解读,帮助识别趋势反转与延续的关键点位。 该指标配备了清晰的可视化界面,采用彩色直方图,展示多头与空头波动,并支持Classic、NightVision、OceanBreeze等多种自定义主题。主要功能包括检测成交量峰值、识别低活动区(DeadZone)以及基于成交量变化的可配置波动反转提醒。此外,它还支持努力与结果分析、因果关系分析以及供需动态研究,这些都是Wyckoff和VSA方法论的重要支柱。通过自定义参数如砖块大小(Brick Size)、成交量缩放因子(Volume Scale Factor)和枢轴回溯(Pivot Lookback),Weis Wave Scouter可灵活适配各种交易风格与金融品种,无论是以资金量还是以点数成交量进行分析。 使用 Weis Wave Scoute
Your Pointer
Nadiya Mirosh
Your Pointer is no ordinary Forex channel. This corridor is built on the basis of the analysis of several candles, starting from the last one, as a result of which the extremes of the studied interval are determined. They are the ones who create the channel lines. Like all channels, it has a middle line as well as a high and low line. This channel is worth watching for its unusual behavior. The use of the Your Pointer indicator allows the trader to react in time to the price going beyond the bo
Smart M Concept MT5
Andrei Novichkov
Our new indicator is an important part of the Smart Money Concepts (SMC) system It uses a modern market vision and fast calculation methods. As a result, the trader has a complete picture of the trade at every moment in time, which makes the process of obtaining results easier and faster. Our new indicator displays the following important patterns:   Order Blocks. Imbalance – Fair Value Gap (FVG). Break Of Structures (BoS). Change of character (CHoCH). Equal highs & lows. Premium , Equilibrium
Introducing "X Marks the Spot" – Your Ultimate MetaTrader 5 Indicator for Perfect Trades! Are you tired of the guesswork in trading? Ready to take your MetaTrader 5 experience to a whole new level? Look no further – "X Marks the Spot" is here to revolutionize your trading strategy! What is "X Marks the Spot"? "X Marks the Spot" is not just another indicator – it's your personal trading compass that works seamlessly on all timeframes . Whether you're a beginner or an experienced trader,
This new unique indicator Actual tick footprint (volume chart) is developed for using on Futures markets, and it allows seeing the volume of real deals right when they are performed. The indicator Actual tick footprint (volume chart) represents a greatly enhanced tick chart that includes additional information about the volume of deal performed at a specific price. In addition, this unique indicator for MetaTrader 5 allows to clearly detecting a deal type – buy or sell. Alike the standard tick c
该产品的买家也购买
Divergence Bomber
Ihor Otkydach
4.98 (63)
购买该指标的每位用户将额外免费获得以下内容: 原创工具“Bomber Utility”,该工具会自动跟踪每一笔交易,设置止损和止盈点,并根据策略规则自动平仓; 适用于不同交易品种的指标设置文件(Set 文件); 三种不同风险模式下的 Bomber Utility 设置文件:“最低风险”、“平衡风险” 和 “观望策略”; 一套详细的 视频操作手册,帮助您快速完成安装、配置并开始使用本交易系统。 注意: 要获取以上所有赠品,请通过 MQL5 的私人消息系统联系卖家。 我为您介绍原创的自定义指标 “Divergence Bomber”(背离轰炸机),它是一套基于 MACD 背离交易策略 的“全功能”交易系统。 该技术指标的主要任务是识别 价格与 MACD 指标之间的背离,并发出交易信号(包括推送通知),指示未来价格可能的运动方向。平均而言,这些信号的准确率超过 98%。有关该指标如何工作的详细说明,请观看本页面上的视频演示。 该系统使用 止损订单 和 动态回撤平仓机制 来管理交易。 Divergence Bomber 指标的主要特点: 支持交易的品种: AUDCAD、AUDCHF、AUDSG
Grabber System MT5
Ihor Otkydach
5 (15)
向您介绍一款优秀的技术指标——Grabber,它是一套即开即用的“全包式”交易策略。 在一个代码中集成了强大的市场技术分析工具、交易信号(箭头)、提醒功能和推送通知。 每位购买该指标的用户还可免费获得以下内容: Grabber辅助工具:用于自动管理已开仓位 视频操作指南:逐步教学如何安装、设置和使用该指标进行交易 原创Set文件:可快速自动配置,帮助实现最佳交易效果 忘掉其他策略吧!只有Grabber能够真正激励你在交易中攀登新高峰! Grabber策略的主要特点: 交易周期:从M5到H4 适用资产:任意,但我推荐我亲自测试过的品种(GBPUSD、GBPCAD、GBPCHF、AUDCAD、AUDUSD、AUDSGD、AUDCHF、NZDUSD、NZDCAD、EURCAD、EURUSD、EURAUD、EURGBP、EURCHF、USDCAD、USDSGD) 交易时间:全天候 24/7 交易效果:我分享自己的真实交易结果,并在此教学如何操作: https://www.mql5.com/ru/market/product/134563?source=Site+Market+MT5+Indic
RelicusRoad Pro MT5
Relicus LLC
5 (22)
您购买了多少次交易指标,它们拥有 出色的回测, 真实账户表现证明 拥有惊人的数字和 各种统计数据, 但使用后您却 账户爆仓? 您不应该只相信一个信号本身,您需要知道它最初出现的原因,这正是 RelicusRoad Pro 的最佳之处! 用户手册 + 策略 + 培训视频 + 带 VIP 访问权限的私人群组 + 提供移动版本 观察市场的新方式 RelicusRoad 是 全球最强大、最好的交易指标 ,适用于外汇、期货、加密货币、股票和指数,为交易者提供发展账户所需的所有信息和工具。我们提供 技术分析 和 交易计划 ,帮助 每位交易者取得成功 ,无论是 初学者 还是 高级交易者 。 它是一个 关键交易指标 ,提供足够的信息来 预测 未来市场。我们相信一个 完整的解决方案 ,而不是图表上几个没有意义的不同指标。这是一个 一体化指标 ,显示 信号 、 箭头 + 价格行为 信息,这是 无与伦比 且 非常准确的 。   RelicusRoad 利用机器学习 (AI) 技术,为交易者提供必要的信息和工具,帮助他们成为成功的、知情的交易者。   通过领先指标预测未来价格 几乎 所有技术指标都滞后 ,
AriX
Temirlan Kdyrkhan
1 (2)
AriX Indicator for MT5 A powerful trend-following and signal-evaluation tool AriX is a custom MT5 indicator that combines Moving Averages and ATR-based risk/reward logic to generate clear buy/sell signals. It visualizes dynamic SL/TP levels, evaluates past trade outcomes, and displays win/loss statistics in a clean on-chart panel. Key features include: Buy/Sell signals based on MA crossovers ATR-based SL/TP1/TP2/TP3 levels with visual lines and labels Signal outcome tracking with real-time stat
Algo Pumping
Ihor Otkydach
4.74 (19)
PUMPING STATION – 您的专属“全包式”交易策略 我们为您推出PUMPING STATION —— 一款革命性的外汇指标,它将使您的交易变得更加有趣且高效。这不仅仅是一个辅助工具,而是一套完整的交易系统,具备强大的算法,帮助您开始更加稳定的交易。 购买本产品,您将免费获得: 专属设置文件:用于自动配置,实现最大化性能。 逐步视频教程:学习如何使用PUMPING STATION策略进行交易。 Pumping Utility:专为PUMPING STATION打造的半自动交易机器人,让交易变得更加方便和简单。 购买后请立即联系我,我将为您提供所有额外资源的访问权限。 PUMPING STATION如何工作: 趋势监控:能够即时识别市场趋势方向。趋势是您最好的朋友。 进场信号:图表上的箭头会提示您何时进场以及交易方向。 明确的交易目标:指标会自动识别最佳的平仓时机。 回调交易:内置的基于布林带的价格通道可检测修正结束并发出新趋势开始的信号。 效率分析:如果当前设置效果较差,系统会自动提示。只需调整PUMPING STATION,即可获得最佳性能。 交易資產:我推薦我親自測試過的
Quantum TrendPulse
Bogdan Ion Puscasu
5 (16)
介绍 Quantum TrendPulse   ,这是一款终极交易工具,它将 SuperTrend   、   RSI 和 Stochastic 的强大功能整合到一个综合指标中,以最大限度地发挥您的交易潜力。该指标专为追求精准和效率的交易者而设计,可帮助您自信地识别市场趋势、动量变化以及最佳进入和退出点。 主要特点: 超级趋势整合: 轻松跟随当前的市场趋势并乘上盈利浪潮。 RSI 精度: 检测超买和超卖水平,非常适合把握市场逆转时机,可用作 SuperTrend 的过滤器 随机精度: 利用随机振荡在波动的市场中寻找隐藏的机会, 用作超级趋势的过滤器 多时间范围分析: 从 M5 到 H1 或 H4,在不同时间范围内关注市场动态。 可定制的警报: 当您的自定义交易条件得到满足时收到通知,这样您就不会错过任何交易。 无论您是新手还是经验丰富的交易员,   Quantum TrendPulse 都能为您提供所需的优势,帮助您增强策略并自信地进行交易。借助这一强大的指标,将洞察力转化为利润 — 掌控您的交易! ***购买 Quantum TrendPulse,即可免费获得 Quantum Tr
TPSpro RFI Levels MT5
Roman Podpora
4.53 (19)
反转区域 - 主要参与者的水平/活跃区域 俄语说明 /   英文 说明 /   MT4 版本 该指标的每位买家   额外 免费 获得: 3个月   从服务中获取交易信号   超级信号     — 根据 TPSproSYSTEM 算法准备的切入点。 3个月   获取定期更新的培训材料 - 沉浸在战略和专业成长中。 工作日每天 24 小时提供支持,并可访问封闭的交易者聊天室 - 沟通、协助和市场情况分析。 主要功能: 显示卖家和买家的活跃区域! 该指标显示所有正确的买入和卖出的初始脉冲水平/区域。当这些水平/区域被激活时,即开始寻找入场点的位置,水平线会改变颜色,并填充特定颜色。此外,还会显示箭头,以便更直观地了解情况。 LOGIC AI - 激活模板时显示用于搜索入口点的区域(圆圈) 为了提高视觉清晰度,添加了使用人工智能搜索入口点的显示区域的功能。 显示更高时间范围内的级别/区域(MTF 模式) 新增使用更高时间间隔显示级别/区域的功能。此外,该指标还具备自动趋势检测功能 (   TPSproTREND PRO   )。 独立的专业分步交易算法 该算法专为顺势和逆势的日内交易而设计。
Weis Wave with Alert MT5
Trade The Volume Waves Single Member P.C.
4.94 (16)
Rental/Lifetime Package Options and Privileges  Rent Monthly Six Months   Yearly/Lifetime Weis Wave with Speed with Alert+Speed Index x x x Manual  x x x Quick Set up Video x x x Blog x x x Lifetime Updates x x x Setup and Training Material x x Discord Access Channel "The SI traders"          x Rectangle Break Alert Tool      x How to trade with it:    http://www.tradethevolumewaves.com   ** If you purchase please contact me to setup your  : Training Room and  complete manual access.  Wei
ARIPoint
Temirlan Kdyrkhan
ARIPoint is a powerful trading companion designed to generate high-probability entry signals with dynamic TP/SL/DP levels based on volatility. Built-in performance tracking shows win/loss stats, PP1/PP2 hits, and success rates all updated live. Key Features: Buy/Sell signals with adaptive volatility bands Real-time TP/SL/DP levels based on ATR Built-in MA Filter with optional ATR/StdDev volatility Performance stats panel (Success, Profit/Loss, PP1/PP2) Alerts via popup, sound, push, or email Cu
WVAP Scalping
Domantas Juodenis
WVAP Scalping Pro - The Ultimate Professional Trading System REVOLUTIONARY VOLUME-WEIGHTED AVERAGE PRICE INDICATOR WITH ADVANCED MARKET PROFILE Transform your trading with the most sophisticated WVAP system available on MQL5! This isn't just another indicator - it's a complete professional trading environment designed for serious scalpers and day traders who demand institutional-grade tools. WHAT MAKES THIS INDICATOR EXTRAORDINARY? TRIPLE WVAP STRATEGY SYSTEM  WVAP Trend (50 periods) : Master
TPA True Price Action indicator reveals the true price action of the market makers through 100% non-repainting signals strictly at the close of a candle! TPA shows entries and re-entries, every time the bulls are definitely stronger than the bears and vice versa. Not to confuse with red/green candles. The shift of power gets confirmed at the earliest stage and is ONE exit strategy of several. There are available now two free parts of the TPA User Guide for our customers. The first "The Basics"
MetaForecast M5
Vahidreza Heidar Gholami
5 (3)
MetaForecast能够根据价格数据中的谐波来预测和可视化任何市场的未来走势。虽然市场不总是可预测的,但如果价格中存在模式,MetaForecast可以尽可能准确地预测未来。与其他类似产品相比,MetaForecast通过分析市场趋势可以生成更精确的结果。 输入参数 Past size (过去的尺寸) 指定MetaForecast用于创建生成未来预测模型的柱数量。该模型以一条黄色线绘制在所选柱上。 Future size (未来的尺寸) 指定应预测的未来柱数量。预测的未来以粉色线表示,并在其上绘制了蓝色回归线。 Degree (程度) 此输入确定了MetaForecast将在市场上进行的分析级别。 Degree 描述  0 对于程度0,建议使用较大的值来设置“过去的尺寸”输入,以覆盖价格中的所有高峰、低谷和细节。  1 (建议的) 对于程度1,MetaForecast可以理解趋势,并通过较小的“过去的尺寸”生成更好的结果。  2 对于程度2,除了趋势,MetaForecast还可以识别反转点。对于大于1的程度,必须使用较高的“细节”和“噪音减少”输入值。  大于2 不建议使用大于
Berma Bands
Muhammad Elbermawi
5 (6)
Berma 波段 (BBs) 指标对于寻求识别和利用市场趋势的交易者来说是一种有价值的工具。通过分析价格与 BBs 之间的关系,交易者可以辨别市场是处于趋势阶段还是区间波动阶段。 访问[ Berma Home Blog ] 了解更多信息。 Berma 带由三条不同的线组成:上 Berma 带、中 Berma 带和下 Berma 带。这些线围绕价格绘制,直观地表示价格相对于整体趋势的变动。这些带之间的距离可以洞察波动性和潜在的趋势逆转。 当 Berma Bands 线相互分离时,通常表明市场正在进入横盘或区间波动时期。这表明缺乏明确的方向性。交易者可能会发现在这些时期内很难识别趋势,因此可能需要等待更清晰的趋势出现。 当 Berma Bands 线汇聚成一条线时,通常表示趋势环境强劲。这种汇聚表明存在明显的方向性偏差,因为价格波动性足以随趋势而变化。交易者可能会发现在这些时期更容易识别潜在的入场点和出场点,因为趋势的势头可以提供有利的交易机会。然而,重要的是要注意整体趋势中的潜在回调或修正。 Berma 带根据价格蜡烛图与上带和下带的相互作用提供明确的买入和卖出信号。当价格蜡烛图首
Institutional Order Block Pro Institutional Order Block Pro is an indicator designed to automatically detect and display order blocks on the chart. It provides traders with clear visualization of both bullish and bearish blocks, helping to identify areas of potential market interest. Features: Automatic detection of bullish and bearish order blocks. Zone highlighting with non-repainting signals. Works across multiple timeframes and instruments. Plug and play no complicated setup required. Use Ca
Introduction to X3 Chart Pattern Scanner X3 Cherart Pattern Scanner is the non-repainting and non-lagging indicator detecting X3 chart patterns including Harmonic pattern, Elliott Wave pattern, X3 patterns, and Japanese Candlestick patterns. Historical patterns match with signal patterns. Hence, you can readily develop the solid trading strategy in your chart. More importantly, this superb pattern scanner can detect the optimal pattern of its kind. In addition, you can switch on and off individu
介绍     Quantum Breakout PRO   ,突破性的 MQL5 指标,正在改变您交易突破区域的方式!由拥有超过13年交易经验的资深交易员团队开发,     量子突破 PRO     旨在通过其创新和动态的突破区域策略将您的交易之旅推向新的高度。 量子突破指标将为您提供带有 5 个利润目标区域的突破区域的信号箭头,以及基于突破框的止损建议。 它既适合新手交易者,也适合专业交易者。 量子 EA 通道:       点击这里 重要的!购买后请私信我领取安装手册。 建议: 时间范围:M15 货币对:GBPJPY、EURJPY、USDJPY、NZDUSD、XAUUSD 账户类型:ECN、Raw 或 Razor,点差极低 经纪商时间:GMT +3 经纪商:IC Markets、Pepperstone with Raw 和 Razor 的点差最低 规格: 不重漆! 最多 5 个建议利润目标区域 建议止损水平 可定制的盒子。您可以设置自己的 Box Time Start 和 Box Time End。 接触 如果您有任何疑问或需要帮助,请通过私人消息与我联系。
Gann Zone Pro MT5
Kirill Borovskii
This indicator identifies and displays zones, as it were areas of strength, where the price will unfold. The indicator can work on any chart, any instrument, at any timeframe. The indicator has two modes. The indicator is equipped with a control panel with buttons for convenience and split into two modes. Manual mode: To work with manual mode, you need to press the NEW button, a segment will appear. This segment is stretched over the movement and the LVL button is pressed. The level is displayed
ACB Breakout Arrows MT5
KEENBASE SOFTWARE SOLUTIONS
5 (1)
ACB Breakout Arrows 指标通过检测特殊的突破形态,提供市场中的关键入场信号。该指标持续扫描图表中的价格动量,在价格出现重大变动前,提前提供精确的入场信号。 点击此处获取多品种多周期扫描器 - ACB Breakout Arrows MT5 扫描器 主要特点 指标自动提供止损和止盈价格。 内置多周期扫描仪仪表盘,可追踪所有时间周期的突破信号。 适用于日内交易者、波段交易者和剥头皮交易者。 优化算法提升信号精度。 特别设置的快速盈利线用于无亏损移动或短线目标。 支持胜率、盈亏比、平均利润等绩效分析指标。 无重绘,信号可靠。 交易确认 - 可使用 ACB Trade Filter 指标 来过滤低概率的交易信号。 强烈买入: 向上箭头 + 绿色柱状图 + 多头趋势。 强烈卖出: 向下箭头 + 红色柱状图 + 空头趋势。 当柱状图为灰色且趋势为震荡时,应避免交易。 (可选) -  使用  KT 支撑阻力水平指标  避免在重要支撑/阻力位附近入场。这类交易可能迅速变成亏损。 “一个成功交易者的目标是做出最好的交易。金钱只是附属。” —— 亚历山大·埃尔德 输入参数 历史
Enigmera MT5
Ivan Stefanov
3.67 (3)
ENIGMERA:市场核心 引言 该指标及交易系统为金融市场提供了一种卓越的方法。ENIGMERA 利用分形周期精确计算支撑位和阻力位,展示真实的积累阶段,并给出方向和目标——无论处于趋势还是回调,系统均能正常运行。 如何工作 指标的大部分功能由图表左侧的按钮控制,可快速应对不同的市场状况。 按钮说明 ON/OFF – 显示或隐藏整个指标。 Support – 趋势的主支撑线。 Ch – 激活支撑通道,标示可接受的偏差范围。 Dev1(第一偏差) – 显示价格在支撑偏差范围内的运动,表明市场盘整或力量积累。 Dev2(第二偏差) – 显示价格在偏差之间的运动,表明趋势正在形成及其方向。 Dev3(第三偏差) – 指示趋势显著加速和高波动性。 45deg(45度) – 显示市场节奏和相对于45线的运动稳定性。 Tgt(目标) – 趋势目标线,标示可平仓的位置。 Tgt Dev – 目标可能波动的通道范围。 Vol(成交量) – 在K线图上显示成交量点,标示市场成交量的显著变化。 X – 当价格到达目标线时显示“X”标记。 RandC(随机颜色) – 将指标线条和标签随机着色,以便更好地
Transaction Speed MT5
Ivan Stefanov
5 (2)
当然,以下是翻译成中文(简体)的版本: 该指标标出市场中显现出 交易兴趣 的区域,并随后显示 订单积累区域 。它的工作方式类似于大规模的订单簿。 这是为 大资金 打造的指标,性能卓越。市场中有任何兴趣,你都能通过它清晰看到。 (这是一个 完全重写的自动化版本 —— 不再需要手动分析。) 交易速度 是一个全新的概念指标,它显示了市场上大订单 何时 、 何地 聚集,并揭示了其背后的意义。它可以在 非常早期 就检测到趋势的变化。 在外汇市场,所谓的“交易量”实际上是误导性的,因为那指的是价格在单位时间内的变化,因此真正的名称应是“交易速度”。 一切都取决于我们如何思考、如何行动、如何分析。 改变分析范式至关重要。 该指标完全重构了外汇市场上“交易量”的概念,用逻辑方式重新定义并应用,从而成为一个 独特而精准的工具 。 使用方法: 默认情况下,指标处于 自动模式 ,可独立用于任何时间周期。如果你希望切换到手动模式,只需点击 Auto / Manual Mode 按钮即可。 在 手动模式 下,所有计算从 2025年1月1日 开始。你可以根据需要更改该日期,以查看不同的分析结果。 最优数据周期
Custom Signal Scanner MT5
Satya Prakash Mishra
Custom Indictor Signal Scanner for scan your own any custom indicator and template its one click you can open your desire signals(given time frame alert). Also can open same template with particular input indicator just type name of template your created with given indicator and enjoy all time frame scan with your logical signals  input string s2 = "====== Embedded Indicator Settings ======"; input UseEmbeddedIndicator = false; // Use embedded indicator instead of external file ( don't use its n
IQ Gold Gann Levels a non-repainting, precision tool designed exclusively for XAUUSD/Gold intraday trading. It uses W.D. Gann’s square root method to plot real-time support and resistance levels, helping traders spot high-probability entries with confidence and clarity. William Delbert Gann (W.D. Gann) was an exceptional market analyst, whose trading technique was based on a complex blend of mathematics, geometry, astrology, and ancient mathematics which proved to be extremely accurate. Download
AT Forex Indicator MT5
MQL TOOLS SL
5 (5)
The AT Forex Indicator MT5 is a sophisticated trading tool designed to provide traders with a comprehensive analysis of multiple currency pairs. This powerful indicator simplifies the complex nature of the forex market, making it accessible for both novice and experienced traders. AT Forex Indicator uses advanced algorithms to detect trends, patterns and is an essential tool for traders aiming to enhance their forex trading performance. With its robust features, ease of use, and reliable signal
MTF Supply Demand Zones MT5
Georgios Kalomoiropoulos
5 (1)
下一代自动化供需区。适用于任何图表的创新算法。所有区域都是根据市场的价格行为动态创建的。 两种类型的警报 --> 1) 当价格触及区域时 2) 当新区域形成时 你不会再得到一个无用的指标。您将获得一个完整的交易策略和经过验证的结果。     新的功能:     价格触及供需区时发出警报     创建新的供应/需求区时发出警报     推送通知警报     以点为单位的区域宽度标签     关于 MTF 的又一个时间表。因此,现在您将能够看到高于当前 3 个时间帧,而不是高于当前 2 个时间帧     启用/禁用警报/区域/MTF 功能的按钮 您获得的优势:     消除交易中的情绪。     客观化您的交易条目。     通过高概率设置提高您的利润。     节省绘图区域的时间。     像专业人士一样交易金融市场。     任何市场的即时多时间框架分析。 你在图表上看到了什么?     蓝色和红色矩形是当前时间范围的供需区。     虚线样式线是当前上方第一个时间范围内的供需区域。     实线样式线是当前上方第二个时间范围内的
Market Profile Heatmap
Samuele Borella
5 (2)
MP TPO Heatmap — Market Profile (TPO) with VAH/VAL/POC/IB Market Profile is a way to visualize how price accepts or rejects value within a session. Instead of averaging, it counts how often price traded at each level during equal-time “brackets.” The result is a distribution you can read at a glance: thick areas = acceptance; thin edges = rejection. This indicator implements a TPO-based Market Profile with clean session lines (POC, VAH, VAL, IBH, IBL) and a fast, two-tone heatmap cloud that high
Introducing the POWER TRADE indicator created by a small group of traders with a few years trading trading the financial market profitably . This is a plug and play indicator that provides you with  POWERFUL Entry signals with Profit Taking and rebound zones. The indicator Works with all MT5 trading instruments. The indicator uses previous  chart data as receipt to speculate on future market moves.
“ Dynamic Scalper System MT5 ”指标专为在趋势波内进行剥头皮交易而设计。 已在主要货币对和黄金上进行测试,并可与其他交易工具兼容。 提供顺势短线建仓信号,并提供额外的价格变动支持。 指标原理: 大箭头决定趋势方向。 在趋势波内,我们采用一种生成小箭头形式的剥头皮交易信号的算法。 红色箭头代表看涨方向,蓝色箭头代表看跌方向。 敏感的价格变动线会沿着趋势方向绘制,并与小箭头信号协同作用。 信号运作方式如下:当线在适当时刻出现时,将形成入场信号;在出现线时,持仓;线完成后,平仓。 建议的操作时间范围为M1 - H4。 箭头在当前K线上方形成,如果下一根K线已开仓,则不会重新绘制上一根K线上方的箭头。 输入参数 Trend Wave Period - 趋势方向(大箭头)的周期,改变趋势波的时间间隔。值 1 表示趋势方向的最长持续时间,参数值越大,持续时间越短。 Scalper Arrows Period - 信号箭头(小箭头)的计算周期,改变入场信号的生成频率。值 3 表示最频繁的生成频率,参数值越大,箭头频率越低,准确度越高。 这些参数可以根据不同
MonetTrend
Aliya Bolek
MonetTrend — Премиум-индикатор для торговли по тренду (M30, H1, H4) MonetTrend — это мощный и визуально понятный трендовый индикатор, созданный для торговли на таймфреймах M30, H1 и H4. Он идеально подходит для работы с волатильными инструментами, такими как: • Золото (XAUUSD) • Криптовалюты (BTCUSD) • Валютные пары (EURUSD, USDJPY и др.) Ключевые особенности MonetTrend: • Автоматическое отображение Take Profit 1 (TP1) и Stop Loss (SL): После появления сигнала индикатор сразу показывает: • TP
Bullhouse Marketprofile
Luiz Vinicius Pereira Rocha -
# Bullhouse MarketProfile Volume Profile, Simplicity, and Precision. Developed by Bullhouse, this indicator brings the power of Market Profile analysis to your MetaTrader 5 in a clean, intuitive, and highly customizable interface. --- ## What is Market Profile? Market Profile is a charting tool that displays the distribution of traded volume over time at each price level. It helps traders understand where the most buying and selling is happening and identify: - Value Areas - Points o
Elliott Wave Trend MT5
Young Ho Seo
4 (3)
Elliott Wave Trend was designed for the scientific wave counting. This tool focuses to get rid of the vagueness of the classic Elliott Wave Counting using the guideline from the template and pattern approach. In doing so, firstly Elliott Wave Trend offers the template for your wave counting. Secondly, it offers Wave Structural Score to assist to identify accurate wave formation. It offers both impulse wave Structural Score and corrective wave Structure Score. Structural Score is the rating to sh
作者的更多信息
Doctor Edge Strategy Pro – Range & Breakout Zones Doctor Edge Strategy Pro is a professional indicator designed to simplify market reading based on range and breakout zones. It combines concepts of Price Action, ICT, and Smart Money Concepts, providing an automated and precise approach for traders of synthetic indices, cryptocurrencies, and Forex pairs. How It Works Doctor Edge Strategy Pro automatically draws on the chart: The range zone (lateral accumulation); The upper breakout zone (gr
DrMoxQuant EA Ultimate Version (MT5) How It Works: The DrMoxQuant EA Ultimate Version does not execute trades automatically. Instead, it analyzes the market chart and provides clear buy or sell signals, showing exact price levels for entry, pullback, take profit, and stop loss. It works as a trend tracker to help you make more accurate trading decisions. Advantages of DrMoxQuant EA Ultimate Version: Clear signals: Visual buy and sell alerts with precise price levels to guide your decisions. Ful
How It Works DoctorEdge Asia-London-NY Buy & Sell Arrows Breakout is a professional indicator that identifies real breakout signals during the three most important trading sessions: Asia, London, and New York . The indicator automatically draws: Vertical lines showing the start and end of each session. Dashed horizontal lines marking the highs and lows formed within each session. Based on this session structure, it generates automatic BUY & SELL arrows , pointing to potential breakout zones ,
DoctorEdge X MAN Intraday Vision
Domingos Jose Antonio Lopes
DoctorEdge X-MAN Intraday Vision The Smart Indicator for Catching Breakouts and Reversals with Precision How It Works DoctorEdge X-MAN Intraday Vision was designed to help intraday and scalping traders identify key price movements — especially true breakouts and potential false breakouts with reversal . When the price breaks above or below one of the indicator’s lines , the line automatically moves , following the new price direction. You can use this behavior as a kind of dynamic break-ev
筛选:
无评论
回复评论