Crosshair Local Time

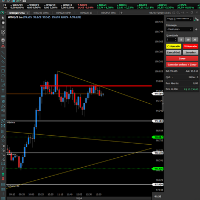
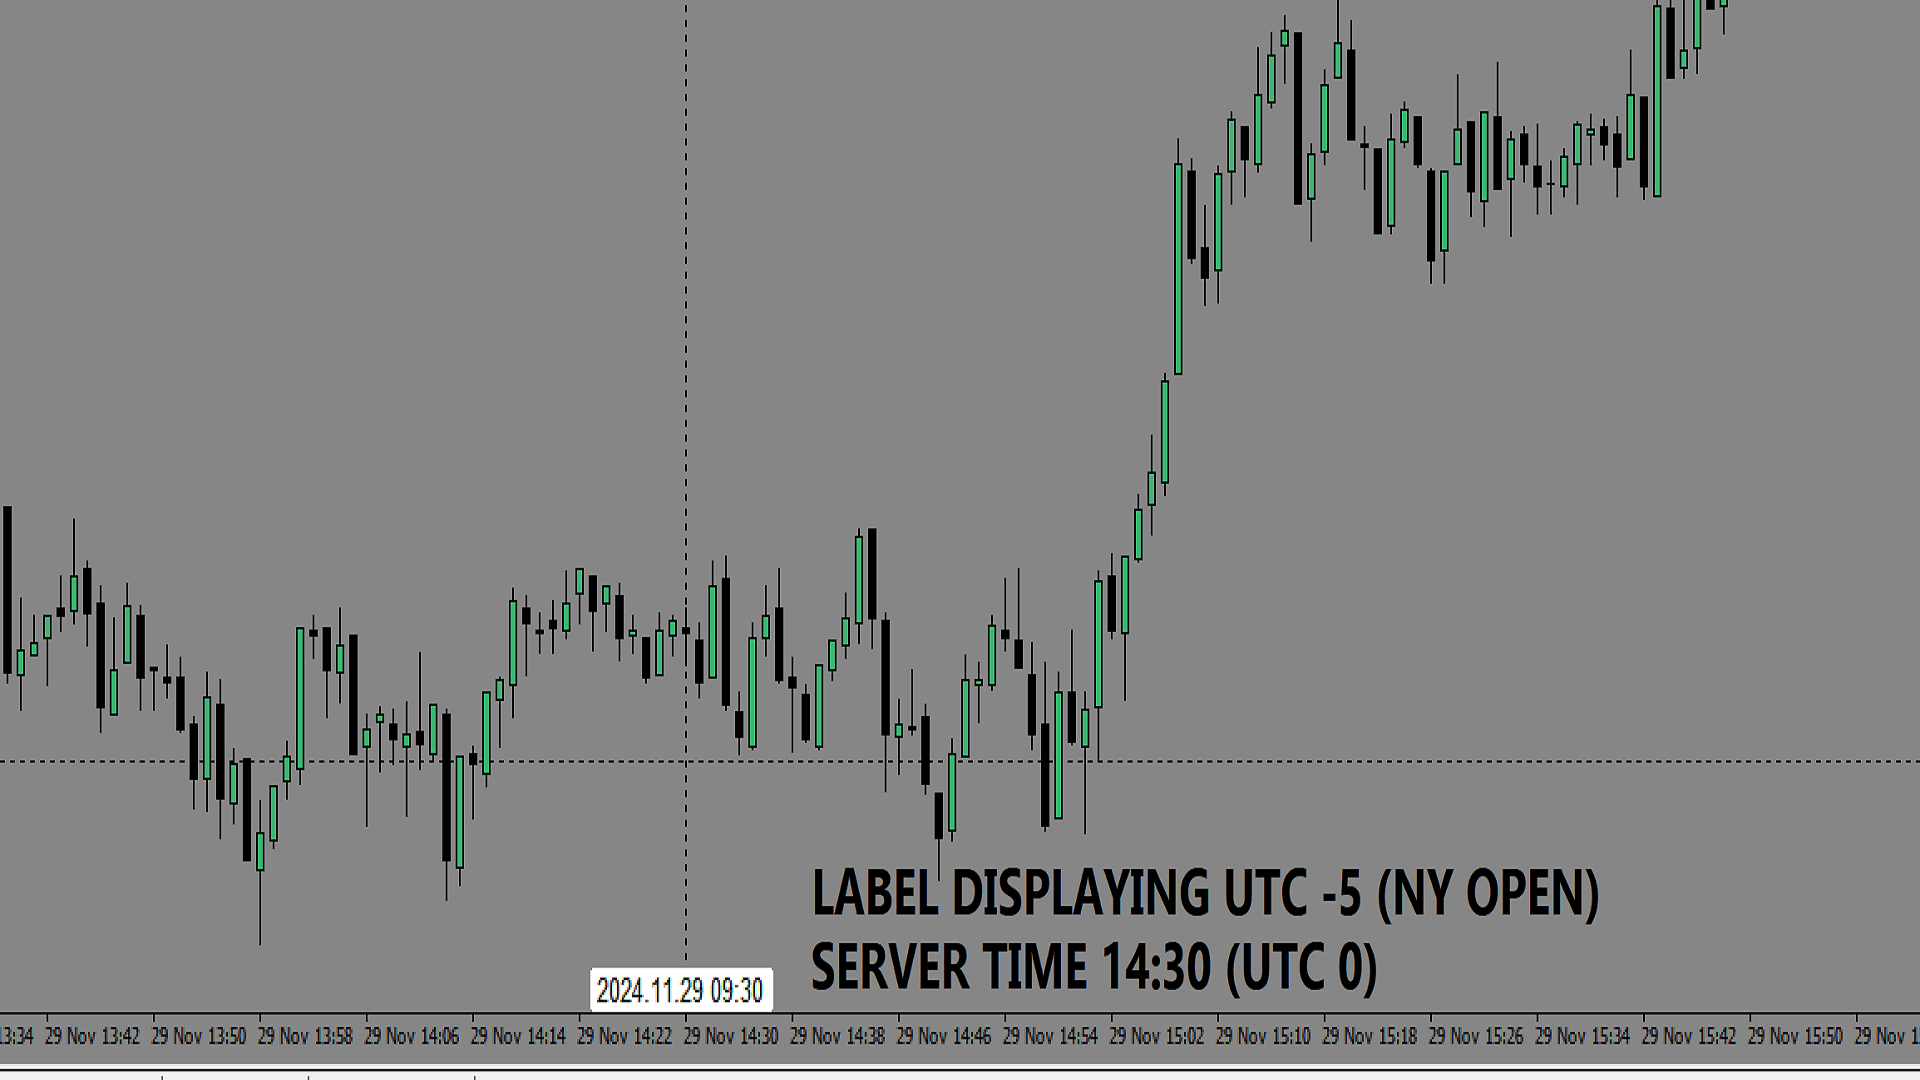
If you ever wanted to know your local time (or NY time) at any bar on the chart without needing to waste time with mental calculations, look no further.

This indicator creates a crosshair which you can drag anywhere on the chart and will show you the local time in a label on top of the time axis.

Press the "c" key to show/hide the crosshair. Left click it to pick it up and drag anywhere, left click again let it go.

You can't hide the crosshair without letting it go first.

Time setting inputs are UTC

Default time setting is: Broker Time UTC 0, and Local Time UTC -5 (NY Time)

Change to whatever your broker server time is, and your local time is.

The rest of the settings are self explanatory, they are mainly used to adapt the label size (and font size) to any monitor resolution.
推荐产品
Touch VWAP MT4
Danrlei Hornke
O Touch VWAP é um indicador que permite calcular uma Média Ponderada por Volume (VWAP) apenas apertando a tecla 'w' no seu teclado e após clicando no candle do qual deseja realizar o calculo, clicando abaixo do candle é calculada a VWAP baseado na minima dos preços com o volume, clicando sobre o corpo do candle é calculado uma VWAP sobre o preço medio com o volume e clicando acima do candle é calculado uma VWAP baseado na máxima dos preços com o volume, voce tambem tem a opção de remover a VWAP
适用于MT4平台的“专业指数趋势直方图”加密货币外汇指标,无重绘。 - 专业指数趋势直方图指标在趋势检测方面非常有效。 - 最佳使用方法是结合支撑/阻力位和回测技巧(参见图片): - 一旦指标检测到新趋势,找到当地的支撑/阻力位,并在该位置设置相应的挂单,等待该区域的回测。 - 如果新趋势是上涨,则设置买入限价挂单;如果新趋势是下跌,则设置卖出限价挂单。 - 指标有两种颜色:红色代表下跌趋势,蓝色代表上涨趋势(颜色可在设置中更改)。 - 支持手机和电脑端提醒。 - 指标带有信息显示功能,显示其所关联的外汇货币对的当前点差和隔夜利息。 - 信息显示还显示账户余额、净值和保证金。 - 信息显示可以放置在图表的任意角落。 点击此处查看高质量交易机器人和指标! 这是仅在MQL5网站上提供的原创产品。
Retracement Hunter This Indicator based on powerfull daily  levels . support and resistance, Buy / Sell entries which is more based on low risk  and high reward and winning ratio, Enter trade  when you get popup alert , book profit on target1, target 2, target3 levels, most of the trending days it will hit target3, but its always safe  to book partial at target1 or target2 Buy best entry when rule 1) look for Buy 2) Emas aligned less than 0.25 3) Main Ema aligned Buy , it will alert when all th
Fibonacci calculator is used with Elliot Waves, it can generate remarkable results. A trader could use these levels or ratios to find high probability trades with very small stop loss. You may also use these ratios to find Elliott Waves extensions and to book profit near those levels. For Elliot Wave experts, Fibonacci calculator is a highly useful tool that can assist them in calculating Fibonacci extension and retracement levels for the market price. The indicator proves itself as a useful one
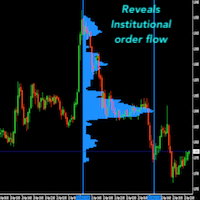
This is a key indicator and guideline for institutions and pension plans that look to take large positions and need to know whether they are getting in at a good price or not. It also allows them to get into positions without disrupting the market or elevating prices unnaturally with their large orders, resulting in unfavorable entry prices for them. The VWAP is a major level of importance that a lot of big traders and institutions monitor and is why you should be paying attention to it too.  Ba
Market Projection Pro — MT4 想在图表上观察所选价格周期可能如何延伸?Market Projection Pro 分析您选择的历史区间,提取周期成分,并在分析窗口右侧绘制合成投射。您可以控制历史区间和向前延伸的长度,将计算情景与价格结构及潜在转折区域进行对比。 图表上显示什么 可交互边界允许您直接在图表上选择历史分析区间。 周期成分和合成曲线帮助观察所选走势的节奏。 投射按照指定的未来蜡烛数量延伸计算情景。 可选转折点和转折区域便于检查投射结构。 图表上的计算、构建与清除按钮让操作集中在同一界面。 使用方法 选择两条边界之间的区间,点击 Calculate Cycles,再点击 Build Projection。分析长度是用于计算的历史蜡烛数量;投射范围是向前绘制的蜡烛数量,两者分别设置。修改区间后,请重新计算周期并重建投射。需要比较情景时,选择另一段历史并重复计算;需要观察转折时,开启转折点或区域。 购买前试用 下载演示版,在 MT4 中启动可视化测试,以使用图表按钮和边界。选择历史数据充足的区间,计算周期并构建投射。建议从默认的 70 根蜡烛投射范围开始。
Tired of online risk calculators that you manually have to fill out? This neat little dashboard instantly shows you, your risk, reward and risk vs reward as soon as you've sat your Stop-loss or Take-profit. Works on both market and pending orders. By far, my most used indicator when trading manually on mt4. Advantages Can handle multiple positions. And gives the total risk and reward for all positions on all manually placed or pending positions on the current chart. Automatically recalculates t
Unique Professional 8 Snipe r is a  multi-timeframe indicator   that combines 8 different technical conditions to generate high probability BUY/SELL signal set ups and gives high probability precise entries. It's a non-repaint   indicator with 8 confirmations and then a precise entry when all conditions are met. Alerts and Push Notifications with Entry ,Tp and Sl MT 4 and MT5 Direct EA is free along with the purchase of indicator  Limited offer for few users only till 30th of September Best Fo
The indicator allows you to trade binary options. The recommended time frame is М1 and the expiration time is 1,2,3 minutes. The indicator suitable for auto and manual trading. A possible signal is specified as a arrows above/under a candle. You should wait until the candle closes! Arrows are not re-painted Trade sessions: TOKYO section (Half-end) Currency pairs: USD/JPY Working time frame: M1 Expiration time: 1,2,3 minutes. The indicator also shows good results when using the martingale strateg
FREE
Ska ZigZag BuySell
NKATEKO VUKOSI LEROY MASANGO
Ska ZigZag BuySell indicator determines the overbought and oversold regions within a trend. The indicator determines the overbought region by the candlestick high and the oversold region by the candlestick low. This indicator only gives signals with arrow and audible alerts each and every time when a new candlestick appear. To utilize the full strategy i recommend using "Ska ZigZag BuySell" together with "Ska ZigZag Line". The Ska ZigZag Line indicator is available for free. NOTE: Indicator is h
Percentage Oscillator MT4
Alexandre Borela
5 (2)
如果你象这个项目一样,就有5个饥饿审查。 由于机构贸易量很大,因此它们不愿意努力设法争取。 在特定百分比上捍卫立场。 这些级别将成为你可以利用的自然支持和抵抗力。 进入贸易或了解对你立场的可能危险。 提名人将显示: 日。 周。 Month. 资格。 年。 在你追踪你们的支持和抵抗的温床。
FREE
Auto Elliott Engine
Enrique Gauto Sand
Auto Elliott Engine The Auto Elliott Engine is a tool designed for MetaTrader 4 that automates the identification, decomposition, and projection of price structures based on the Elliott Wave Theory. Powered by a pattern-recognition engine, this indicator processes price action to identify market configurations, translating data into structured scenarios. Key Features Multi-Degree Recognition: Analyzes price action across multiple fractal levels. From higher degrees, such as Supercycle or Cycle,
KT Horizontal Lines MT4
KEENBASE SOFTWARE SOLUTIONS
在MetaTrader中,绘制多个   水平线   并跟踪各自的价格水平可能非常麻烦。该指标可自动在等间距位置绘制多个水平线,用于设置价格提醒、标记支撑和阻力位以及其他手动操作。 这个指标非常适合刚接触外汇交易的新手,帮助他们寻找买卖机会并实现快速获利。无论市场处于趋势中还是震荡状态,水平线都能帮助交易者识别潜在的进出场区域。 功能特点 可根据输入参数中的预设,瞬间绘制多个水平线。 使用鲜明的色彩主题,区分不同的水平线。 是追踪多个交易时段价格区间的必备工具。 当价格触及某条水平线时会自动发出提醒。 可设置提醒之间的间隔,避免重复提醒造成干扰。 支持完全自定义设置。 说明 该指标根据输入参数中的配置自动绘制水平线。观察价格在这些水平线附近的反应,可以帮助识别关键支撑/阻力位附近的潜在交易机会。 例如,在水平支撑位形成一根看涨Pin Bar,通常意味着价格可能会继续上涨,朝最近的阻力位移动。 若价格以一根看跌K线收盘于支撑位下方,则可能表明刚刚发生了一个下行突破。而在水平线上发生的假突破,则说明价格未能突破关键水平,可能即将反转方向。 一些价格反转形态(如Pin Bar或假突破)对于
Paid release: Lorentzian ML Classifier Signals MT4 is a paid MetaCoderStore indicator. Use the product comments for setup questions, feature requests, and feedback for future updates. Lorentzian ML Classifier Signals MT4 is a closed-bar signal indicator inspired by the high-demand Lorentzian distance classification approach used by many TradingView traders. It compares the current market state against similar historical states using Lorentzian distance, then confirms the result with trend, kerne
KT Top G MT4
KEENBASE SOFTWARE SOLUTIONS
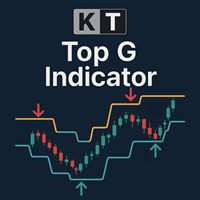
KT Top G 是一款基于价格行为的指标,它结合了智能通道分析来识别潜在的市场顶部和底部。当检测到可能的反转时,它会在图表上绘制醒目清晰的箭头,提前向您发出市场可能转向的信号。 大箭头: 通过识别价格衰竭和动量变化,标记出高概率的市场顶部和底部。 小箭头: 表示较低概率的转折点,这些位置通常在真正反转之前就会被突破。 功能特点 广泛兼容性: 可用于所有外汇货币对,也适用于指数、股票和ETF等其他交易品种。 多时间周期优化: 在M1和M5表现出色,适合剥头皮交易;在H1、H4和D1也能很好地支持波段交易。 内置中线通道: 除了箭头,指标还显示动态价格通道和中线,帮助您理解市场当前的区间与趋势方向。 不重绘: 一旦箭头出现在图表上,它就不会消失或改变,确保每个信号的可靠性。 适应波动行情: 可调节的长度和平滑因子,让您更好应对不可预测或快速波动的市场环境。 独立提醒: 大箭头与小箭头分别设有提醒,您可根据自身的风险偏好做出反应。 支持所有MT提醒: 提供弹窗、声音、邮件、推送等多种即时通知方式,确保不错过任何交易机会。 总结 许多交易者在将 Top G 添加到交易系统后,胜率明显提高
Market Structures Pro MT4
Andrei Novichkov
5 (1)
The Market Structures Pro indicator finds and displays 5 (five) patterns of the Smart Money Concepts (SMC) system on the chart, namely: Break Of Structures (BoS)       Change of character (CHoCH) Equal Highs & Lows Premium, Equilibrium and Discount zones with Fibo grid High-high, Low-low, High-low and Low-high extremes Patterns are displayed for two modes - Swing and Internal and are easily distinguished by color on the chart. Internal mode features higher contrast colors, finer lines, and smal
Dynamic Grid Pro
Jhonnathan Coelho Dos Santos
沉浸在适应性与精确性相结合的交易环境中。Dynamic Grid Pro v1.7 提供一套旨在优化您市场交易方法的工具。 该系统的开发旨在为网格交易策略的执行提供一个灵活的框架。其核心功能在于能够根据不断变化的市场条件动态调整网格参数。 Dynamic Grid Pro v1.7 的特点: 动态网格: 系统根据波动性和价格变动自动调整网格水平,旨在优化订单执行。 订单管理: 允许精确控制网格内订单的下单和管理,提供多种配置选项。 多种入场策略: 集成不同的订单入场方法,为实施您的策略提供灵活性。 可自定义设置: 提供广泛的可调参数,以使系统适应您的偏好和交易风格。 信息面板: 显示有关网格和仓位的相关数据,方便监控和决策。 MetaTrader 集成: 旨在 MetaTrader 平台内无缝运行,充分利用其功能和工具。 Dynamic Grid Pro v1.7 致力于成为您交易旅程中的盟友,提供有条不紊且适应性强地实施和管理网格策略所需的资源。探索其功能,了解它如何融入您的工作流程。
ZuperSymbols Linker
Manuel Francisco Gaitan
El ZuperSymbols Link  es el indicador de sincronización táctica definitivo para scalpers que operan bajo l a estrategia de Triple Pantalla ( Triple Screen Trading System ) fue creada por el Dr. Alexander Elder . Su función es radical: tú cambias el instrumento en tu gráfico principal de 1 o 5 minutos y, con ese único clic , tus ventanas de temporalidad intermedia y mayor se sincronizan al instante. Sin esperas, sin errores, sin navegar por menús. La ventaja del Scalper: Flujo de Trabajo Totalmen
TMoney OrderblockDay
Moises Orlando Urbina Sojo
The indicator is triggered at the start of each trading day and detects both bullish and bearish ORDERBLOCK potentials. These levels are of high operational probability, being able to use a minimum ratio of 3 to 1 to maximize profits. It is recommended to use TimeFrame M5 to M30 for a proper display and consider pending orders at the OB levels of the chart and place the SL up to a maximum of 20 pips from the entry price. Submit the indicator to Backtesting to become familiar with its performan
Indicador dom cs
Julio Cesar Daniel E Silva
O indicador DonForex é uma das ferramentas mais utilizadas para traçar suporte e resistência automaticamente.  Ele traça os melhores níveis de suporte e resistência do gráfico em qualquer tempo. Isso ajuda você a ter uma visão mais amplas para fazer suas operações As linhas pontilhadas são os pontos mais tocados pelo preço formando assim uma região de suporte ou resistência. Ele também traça automaticamente linhas de tendências de alta (LTA) ou de baixa (LTB) nos dando oportunidade de compra e
NO REPAINT ADVANCED CHART PATTERN INDICATOR By definition, a price ( chart)  pattern is a recognizable configuration of price movement that is identified using a series of  trendlines  and/or curves. When a price pattern signals a change in trend direction, it is known as a reversal pattern; a continuation pattern occurs when the trend continues in its existing direction following a brief pause. Advanced Chart Pattern Tracker is designed to find the MOST ACCURATE patterns. A special script is a
OSW 自动支撑与阻力 - 自动关键点位 Automatic Support and Resistance OSW 是一款自动化技术指标,旨在即时识别并在图表上绘制最相关的支撑和阻力位。通过智能计算更高时间框架(H1、日线、周线和月线)的高点和低点,它消除了标记关键流动性区域时的决策主观性,使交易者能够专注于价格走势和战略决策。 配置参数指南 S&R Color: 定义图表上显示的水平支撑和阻力线的视觉颜色。 S&R Style: 选择线条的视觉绘制样式(实线、点线、虚线等)。 S&R Width: 调整水平线视觉粗细,以适应您的屏幕显示偏好。 图表视觉解读 该指标在图表背景中绘制自动水平线,以免干扰 K 线或您的手动分析。 根据您工作的时间框架,点位会进行动态计算: 1 至 4 分钟图表:显示从 1 小时结构(H1)中提取的关键点位。 5 至 30 分钟图表:显示日线图(D1)的关键高点和低点。 1 至 2 小时图表:显示周线图(W1)的结构点位。 4 小时至月线图表:显示月线图(MN1)的高点和低点。 线条经过规范化处理,以突出显示价格在历史上反应最频繁的区域。 操作指南
Volume Dominance Indicator MT4 Stop Guessing the Market. Start Reading Who Is Really in Control. Every successful trader knows one simple truth: Price tells you where the market is moving. Volume tells you why. Many traders spend years searching for the perfect entry, yet they overlook one of the most valuable pieces of market information—the balance of buying and selling pressure. Without understanding who truly controls the market, even the best-looking setups can quickly fail. Volume Dominanc
Linear Trend Predictor — 结合切入点和方向支撑线的趋势指标。按照突破高/低价通道的原理运作。该指标算法过滤市场噪音,考虑波动性和市场动态。 指示器功能  使用平滑方法,显示市场趋势和开立买入或卖出订单的切入点。  适合通过分析任何时间范围内的图表来确定短期和长期的市场走势。  输入参数可适应任何市场和时间范围,允许交易者独立定制指标。  设定的指示信号不会消失,也不会重新绘制——它是在蜡烛收盘时确定的。  几种类型的通知以箭头组合。  该指标既可以作为独立的交易系统使用,也可以作为其他交易系统的补充。  可供任何经验水平的交易者使用。 主要参数 Volatility Smoothing Level - 指标的主要参数,允许您配置指标以实现舒适的操作。 它的数字范围是 1 到 100,从而增加了您可以获得更长趋势运动的平滑度。 通过少量的数字,您可以获得短期走势并快速退出交易。 使用指标进行交易的时刻:  红线和箭头表示下降趋势和卖出开盘信号。止损应根据前一个上分形来设置。  黄线和箭头表示上升趋势和买入开盘信号。止损应根据前一个下分形来设置。
Alert Stochastic
Eadvisors Software Inc.
Modification of the Stochastic indicator with several types of alerts added to aid in your search for better opportunities in the market. Product Features Email Alert Sound alert Push Notification (Alerts can be sent to your mobile phone) Signs on chart Alert box Indicator Parameters Push Notification - This option enables your MetaTrader 4 to send alerts to your smartphone (IOS or Android). Email Alert - Configure your alerts to receive in your e-mail adress. SignOnChart - Enable drawing aler
LordAutoFibonnaci
Igor Pereira Calil
5 (2)
Lord Auto Fibonnaci is a free indicator for Meta Trader, in order to show the most famous chart in the financial market known as "Fibonnaci". As we can see in the images below, the fibonnaci table will automatically analyze the graph for you, with trend factors through percentage, almost infallible use, you can always work when the percentage is low or high, start shopping and sales on time, great for analyzing entries! In the images below we can see an example in gold in H4, where we are at
FREE
PZ Mean Reversion MT4
PZ TRADING SLU
3 (4)
采用专业和量化方法进行均值回归交易的独特指标。它利用了价格以可预测和可衡量的方式转移并返回均值这一事实,这允许明确的进入和退出规则大大优于非量化交易策略。 [ Installation Guide | Update Guide | Troubleshooting | FAQ | All Products ] 清晰的交易信号 非常容易交易 可定制的颜色和尺寸 实现性能统计 优于大多数交易策略 显示合适的止损和止盈水平 它实现了电子邮件/声音/视觉警报 这个怎么运作 该指标从更高的时间范围测量完全可定制的移动平均线的标准偏差,并使用趋势跟踪方法精确地找到交易。交易是通过深入当前图表的价格行为发现的,并在价格返回到平均价格区间时关闭,根据您选择的更高时间范围计算。由于其编码方式,该指标将远离高波动性和强劲趋势市场,并且仅在可预测的情况下进行交易,在可接受的波动性与方向性比率范围内,回归均值是可行的。 指标剖析 绿线是更高时间范围内的移动平均线(也就是平均值) 虚线区域是移动平均线周围的典型价格区间 蓝线是看涨交易的突破价格 红线是看跌交易的突破价格 交易是针对均值进行的,并在典型的价格
Fisher Yur4ik Alert
Biswarup Banerjee
Fisher Yur4ik MT4 是一种先进的交易指标,利用技术分析的力量为交易者提供对市场趋势的精准洞察。专为 MetaTrader 4 设计,这个指标非常适合希望提升决策过程和改善交易结果的交易者。 通过使用 Fisher Yur4ik MT4,交易者可以获得竞争优势,实时警报和清晰的视觉信号使他们能够抓住各种金融市场中的盈利交易机会。 MQL 产品安装指南 | 在 MT4/MT5 上更新已购买的 MQL 产品 | 常见故障排除指南 | 指标设置 / 指南 主要特点 缓冲区集成:将指标值暴露为可访问的缓冲区,使 Expert Advisor 能够利用基于信号的交易策略。 快速且可回测:基于 MetaTrader 的原生 OnCalculate() 引擎构建,快速计算并与策略测试器完全兼容。 弹出警报:在信号事件上触发 MetaTrader 警报弹出,确保您不会错过任何交易设置。 推送通知:实时推送通知发送到您的 MetaTrader 移动应用,便于随时监控市场情况。 电子邮件警报:在信号事件上提供电子邮件通知,允许您在离开交易终端时进行远程监控。 图表上的仪表板:在图表上直接显示
CRT Pro Scanner MT4
Frank Jose Olivo Flores
CRT Pro Scanner   Stop wasting hours watching multiple charts and missing setups while you blink. CRT Pro Scanner solves the most painful problem every trader faces: being in the wrong chart at the right moment. Instead of jumping between pairs and constantly asking yourself "did I miss something?", the scanner does the watching for you. It monitors all your symbols simultaneously, detects Candle Range Theory setups the instant they form, and alerts you immediately — so you can focus on executi
This indicator is meant for Harmonic Traders, it helps them in identifying the formed patterns by analyzing the market past data, looking for Harmonic Patterns. The Patterns that this indicator can detect are: AB=CD Butterfly Gartely Crab Bat The indicator shows the following: The completed pattern, with the critical zone highlighted in Gray box The suggested 3 take profit levels (in green) The Suggested Stop Loss level (in Red) The formed pattern ratios can be checked by hovering the mouse on t
该产品的买家也购买
Trend SniperX MT4
Sarvarbek Abduvoxobov
5 (5)
Trend Sniper X 是一款用于 MetaTrader 5 的多周期趋势追踪指标,旨在帮助交易者清晰、精准地识别趋势方向及潜在的反转点。 适用于 MT5: https://www.mql5.com/en/market/product/181101 价格信息: 当前价格为促销价,随着后续更新和新功能的推出,价格可能会发生变动。 Code2Profit 频道 通过多周期分析掌控市场! 如何使用 Trend Sniper X 最大化胜率:关键规则与交易时段技巧 技术规格 交易平台 MetaTrader 5 指标类型 多周期趋势指标 运行时间周期 任意图表周期,支持独立选择更高周期(M1–MN1) 主要交易品种 外汇、黄金 (XAUUSD) 及其他 CFD 差价合约 推荐账户 任何账户类型 可视化呈现 彩色趋势 K 线(买入/卖出/弱势/转变)+ 买入/卖出信号箭头 附加模块 市场交易时段框(悉尼、东京、伦敦、纽约) 核心功能 多周期趋势分析: 将更高周期的趋势方向直接投影到当前图表上,提供清晰的宏观视角。 弱势/不确定 K 线检测: 高亮显示趋势状况不明确的 K 线,帮助交易者远离震
Zoryk Gold mt4
Reda El Koutbane
5 (2)
折扣将在 24 小时后结束——下一价格为 69 美元 联系我获取推荐设置 首发名额有限 ZORYK — MetaTrader 4 专业 XAUUSD 黄金信号与交易计划系统 你一定经历过这种感觉。 你花时间分析黄金,等待入场,终于打开交易后,价格却立即向相反方向移动。你过早平仓,移动止损,或者因为犹豫几秒而错过机会。随后市场在没有你的情况下,准确到达你最初预期的目标。 问题并不总是方向错误。 真正的问题是不确定性。 你不知道真正的入场位置在哪里,不知道交易逻辑在什么位置失效,也不知道应该先保护较小的利润,还是继续等待更大的行情。你甚至不知道当前信号是否足够强,还是自己只是在勉强寻找一笔交易。 黄金移动速度非常快。没有明确计划的正确判断,也可能在几秒钟内变成错误决定。 ZORYK 正是为了解决这个问题而开发。 什么是 ZORYK ZORYK 是一套专门为 MetaTrader 4 和 XAUUSD M5 周期开发的完整黄金信号与交易计划系统。 它不是一个只显示 BUY 或 SELL 箭头,然后让你独自处理所有后续决定的普通指标。 每个确认信号都可以在图表上显示
SR Liquidity
Oleg Rodin
5 (2)
SR Liquidity 是一款旨在揭示市场流动性高度集中且价格反应最剧烈的隐蔽区域的交易指标。这些特殊的流动性区域充当着强有力的支撑位与阻力位,为您清晰呈现市场最可能发生反转的位置。 SR Liquidity 指标并非简单地绘制常规的支撑/阻力线,而是通过分析实际的价格行为,识别买卖压力积聚的区域。这些区域实际上是推动市场真实波动的流动性池。通过在图表上直观呈现这些区域,该指标能助您在价格反应发生前预判走势——这意味着它实际上能够预测价格方向可能发生的变化。它将原始的价格行为转化为清晰且具实操价值的市场蓝图,标示出那些可能成为市场转折点的关键价位。 该指标适用于任何交易品种和时间周期——包括外汇、指数、金属、加密货币等。支持任意时间周期。 购买后请联系我,以获取交易指南及免费赠送的优质附加指标!
Tokyo mt4 Indicator
Vasiliy Strukov
5 (5)
Tokyo Indicator(东京指标)直观地展示了趋势方向、潜在交易信号及市场状况。 其采用颜色编码的阶梯式趋势线,以蓝色标识看涨阶段,以洋红色标识看跌阶段。配套的方向箭头会在趋势发生变化时,标示出潜在的买入与卖出机会。 内置的综合仪表盘将当前信号、市场倾向、动能、波动率及信号质量整合于同一视图中,方便交易者在观察价格走势的同时评估指标数据,无需在不同面板间切换。 凭借清晰的图表显示和简洁的市场概览,Tokyo Indicator 支持以系统化的方式进行趋势分析与交易确认。 适用于任何时间周期及各类交易品种,尤其适合黄金交易。 购买后请立即联系我,以获取专属赠品!您可以免费获得我们的“强力支撑与趋势扫描”(Strong Support and Trend Scanner)指标,请私信我! 设置说明与使用手册请见此处。 请注意:我不会在 Telegram 上出售我的 EA 或特殊参数设置(set files);我的 EA 仅在 Mql5 平台上提供,而参数设置文件仅在我的博客(此处链接)上发布。请务必警惕诈骗,切勿从他人处购买任何参数设置! 设置 ShowHUD —— 在图表上显示
M1 Sniper
Oleg Rodin
4.97 (30)
M1 SNIPER 是一款易于使用的交易指标系统。它是一个专为 M1 时间框架设计的箭头指标。该指标可以作为独立的系统在 M1 时间框架下进行剥头皮交易,也可以作为您现有交易系统的一部分使用。虽然该交易系统专为 M1 时间框架交易而设计,但它也可以用于其他时间框架。我最初设计此方法是为了交易 XAUUSD 和 BTCUSD。但我发现这种方法在其他市场交易中也同样有用。 指标信号既可以顺势交易,也可以逆势交易。我教授一种特殊的交易技巧,帮助您利用指标信号进行双向交易。该方法基于使用特殊的动态支撑位和阻力位区域。 购买后,您可以立即下载 M1 SNIPER 箭头指标。此外,我还为所有 M1 SNIPER 工具用户免费提供下方屏幕截图所示的 Apollo Dynamic SR 指标!这两个指标的组合可以帮助您更轻松、更准确地利用 M1 时间框架进行交易。 购买后请联系我,免费获取交易提示和奖励指标! 祝您交易成功!
Atomic Analyst
Issam Kassas
5 (13)
Atomic Analyst — MetaTrader 4 如有产品、设置或技术支持方面的问题,请直接在 MQL5 上给我发消息。 该指标将复杂的市场计算转换为简单的视觉信号、彩色K线、趋势读数、止损水平和多个止盈区域,使交易者能够快速理解并应用于真实市场环境。 主要交易用途: 剥头皮和日内交易: 专为快速决策、清晰箭头、提醒、K线颜色和结构化进出场区域而设计。 日内交易和波段交易: 帮助交易者利用趋势方向、强度、动能和多周期分析跟随更大的市场波动。 主要功能: • 价格行为、强度和动能分析 • 多周期趋势扫描器 • 总体趋势百分比计算 • 买入和卖出箭头 • 止损和多个止盈水平 • 最多 5 个基于斐波那契的止盈水平 • 移动止损逻辑 • 用于趋势和动能的彩色K线 • 实时提醒到终端、手机和电子邮件 • 现代化用户友好面板 • 实时交易监控 • 买入和卖出潜力显示 • 总交易数量显示 • 每日、每周和总利润显示 • 每日佣金计算 • Bid、Ask 和点差显示 • K线计时器、本地时间和服务器时间 • 终端连接状态 • 账户货币显示 • 可直接从面板控制时间周期 • 可手动使用,
Top Bottom Tracker MT4
Rodrigo Arana Garcia
Top Bottom Tracker 是一款基于复杂算法的指标,可分析市场趋势并检测趋势的高点和低点 / MT5 版本。 价格将逐步上升,直至达到 500 美元。下一个价格 --> $99 功能特点 无重绘 新数据到来时 该指标不会改变其数值 交易货币对 所有外汇货币对 时间框架 所有时间框架 参数 ==== 指标配置 ==== 配置参数 // 40(值越高,发出的信号越少但越准确) 上水平值 // 80(上水平线的值) 下水平线值 // 20(下水平线值) 指标计算条数 // 3000(您希望指标计算多少条。数值 0 将计算所有条形图的指标) ==== 警报配置 ==== 弹出警报 // true (在终端上发出警报) 电子邮件报警 // true (通过电子邮件报警) 警报时间间隔 // 10 (警报时间间隔,以分钟为单位) 警告 我只在 MQL5.com 上销售我的产品。如果有人联系您向您推销我的产品,那么他们就是骗子,只想要您的钱。 此外,如果您从外部网站购买我的产品,我向您保证,这些产品都是假冒版本,与正版产品效果不同。
Smart Trend Trading System
Issam Kassas
4.8 (10)
Smart Trend Trading System 是适用于 MetaTrader 4 的图表指标,将趋势信息、入场和出场信号以及价格水平集中呈现在同一图表上。 它将 10 多种交易工具 整合到一个系统中,包括趋势检测、反转区域、Smart Cloud、移动止损逻辑、支撑与阻力、K线着色、提醒以及多周期分析。 该系统旨在帮助您应对不同的市场环境: 趋势市场: 识别主要趋势,发现回调,跟随动能,并通过止损指导和移动止损选项寻找更清晰的入场机会。 震荡市场: 识别区间震荡状态,寻找价格反应区域,并在价格触及重要水平时获得更清晰的信号。 剥头皮和日内交易: 使用快速信号、K线颜色、提醒和多周期确认,辅助短线交易决策。 主要功能: • 10 多个指标整合为一个交易系统 • 7 多种策略和信号组合 • 趋势跟随、反转、剥头皮、日内交易和波段交易模式 • 入场和出场箭头 • Smart Cloud • Smart Reversal Zones • 支撑和阻力水平 • Smart Trailing Stop • 多周期趋势分析 • 成交量、趋势和反转K线着色 • 手机、电子邮件和终端提醒 •
Miraculous Indicator Binary & Forex v3 StrategySafe Miraculous Indicator Binary & Forex v3 StrategySafe 是一款专业交易指标,适合希望获得清晰信号、强大确认工具以及结构化交易方式的 Binary 和 Forex 交易者。 v3 版本加入了 MIR Dashboard、Miraculous Confirmation Dashboard、GANN Law、Square of 9 水平线、GANN 角度以及更强的 Forex 分析模式。 核心功能 同时支持 Binary 和 Forex 交易模式。 MIR Dashboard 可快速读取市场状态。 Miraculous Confirmation Dashboard 用于确认交易机会。 GANN Law drawing lines 用于 Forex 市场结构分析。 Square of 9 线条、方向和关键价格水平。 1x1 GANN Angle 用于判断趋势压力。 Entry Information TP 帮助寻找合理止盈区域。 Strateg
PRO Renko System
Oleg Rodin
5 (31)
PRO Renko Arrow Based System for trading renko charts.  准确的信号交易任何外汇工具. 另外,我将免费提供系统的附加模块! PRO Renko系统是RENKO图表上高度准确的交易系统。该系统是通用的。 该交易系统可应用于各种交易工具。 该系统有效地中和了所谓的市场噪音,打开了获得准确反转信号的通道。 该指标易于使用,只有一个参数负责产生信号。 您可以很容易地使算法适应您感兴趣的交易工具和renko酒吧的大小。 我很乐意通过提供任何咨询支持来帮助所有客户有效地使用该指标。 祝您交易成功!购买后,立即写信给我! 我将与您分享我的建议和我的renko发电机。 另外,我将免费提供系统的附加模块!
Liquidity Scalper System
Stanislav Konin
5 (1)
Liquidity Scalper System: 基于流动性的指标形式交易系统。 大多数指标只显示一个箭头,止损放在哪里、目标在哪里、信号是否可信,都要交易者自己判断。Liquidity Scalper System 覆盖完整的交易周期:寻找流动性池,在其被突破时给出信号,立即计算 Entry、Stop Loss 和三个目标,并在面板上显示统计数据以及新数据上的验证结果。系统自行选择设置,并每天更新。 工作原理 1. 系统寻找流动性池:市场参与者止损单聚集的价位。 2. 当价格突破流动性池,且突破经由动能(必要时还经由成交量)确认后,图表上出现 BUY 或 SELL 箭头。 3. 立即绘制 Entry、Stop Loss、TP1、TP2 和 TP3 水平,并填充区域。 4. 右侧构建流动性分布图:可以看到价格上方和下方大成交量集中的位置。 与众不同之处 • 自动优化取代手动调参。 系统在历史数据上测试 32 种设置组合,为当前品种和周期选出最佳组合。优化目标可选:Win Rate、净利润或盈利因子。 • 新数据验证。 设置在一部分历史上训练,并在优化器未见过的更新数据上检验(out
Gann Made Easy
Oleg Rodin
4.84 (172)
Gann Made Easy 是一个专业且易于使用的外汇交易系统,它基于使用先生理论的最佳交易原则。 W.D.江恩。该指标提供准确的买入和卖出信号,包括止损和获利水平。您甚至可以使用推送通知在旅途中进行交易。 购买后请联系我,即可免费获得交易指导和超棒的额外指标! 您可能已经多次听说过江恩交易方法。通常 Gann 的理论不仅对于新手交易者而且对于那些已经有一定交易经验的人来说都是非常复杂的东西。这是因为江恩的交易方法在理论上并不那么容易应用。我花了几年时间来完善这些知识,并将最好的原则应用到我的外汇指标中。 该指标非常易于应用。您所需要的只是将其附加到您的图表并遵循简单的交易建议。该指标不断进行市场分析工作并寻找交易机会。当它检测到一个好的入口点时,它会为您提供一个箭头信号。该指标还显示止损和获利水平。 换句话说,当您像先生一样进行交易时,该指标会为您提供最佳江恩建议。江恩亲自告诉你此时此刻该做什么。但最好的部分是您不需要了解任何有关江恩交易原则的知识,因为该指标会为您完成整个市场分析工作。
Scalper Vault
Oleg Rodin
5 (39)
Scalper Vault 是一个专业的剥头皮系统,为您提供成功剥头皮所需的一切。该指标是一个完整的交易系统,可供外汇和二元期权交易者使用。推荐的时间范围是 M5。 该系统为您提供趋势方向的准确箭头信号。它还为您提供顶部和底部信号以及江恩市场水平。无论您拥有何种交易经验,该系统都易于使用。您只需要遵循简单的规则并每天重复该过程。 建议将此系统用于主要货币对。感谢您的关注! 请注意,该指标在策略测试器中可能无法正常工作。因此,我建议仅在模拟或真实账户的真实交易条件下使用该系统。 指示器提供所有类型的警报,包括推送通知。 购买指标后请与我联系。我将免费与您分享我的个人交易建议和出色的奖励指标! 祝您交易愉快,盈利!
Introduction to Fractal Pattern Scanner Fractal Indicator refers to the technical indicator that makes use of the fractal geometry found in the financial market. Fractal Pattern Scanner is the advanced Fractal Indicator that brings the latest trading technology after the extensive research and development work in the fractal geometry in the financial market. The most important feature in Fractal Pattern Scanner is the ability to measure the turning point probability as well as the trend probabi
成交量突破震荡指标是一种以震荡指标的形式将价格变动与成交量趋势相匹配的指标。 我想将成交量分析整合到我的策略中,但大多数成交量指标都令我失望, 例如 OBV、资金流量指数、A/D,还有成交量加权 Macd 和许多其他指标。 因此,我为自己编写了这个指标,我对它的实用性感到满意,因此我决定将其发布到市场上。 主要特点: 它突出显示了价格在成交量增加(突破)支持下朝某个方向移动的阶段。 它突出显示了成交量增加停止并因此市场收缩的阶段。 它突出显示了价格和成交量均未移动的阶段,尤其是在时间范围(<=15 分钟)的日内交易中,因此市场已为未来的运行做好准备。 当其他 EA 交易程序发出的虚假信号不受交易量增加的支持时,可过滤掉这些信号。 它使趋势和范围阶段可视化变得非常容易 输入参数: 计算设置: 计算类型:快速、正常、慢速,用于监控短期、中期和长期,保持在同一时间范围内。 计算周期:计算周期 交易量设置: 交易量类型:TickVolume(主要用于外汇)和RealVolume(用于股票市场) 信号设置: 信号周期:信号线周期 突破水平:突破信号的阈值水平 警报设置 警报类型:收盘
PZ Divergence Trading
PZ TRADING SLU
5 (2)
棘手的发现和频率稀缺是最可靠的交易方案之一。该指标使用您喜欢的振荡器自动查找并扫描常规和隐藏的发散。 [ 安装指南 | 更新指南 | 故障排除 | 常见问题 | 所有产品 ] 容易交易 发现常规和隐藏的分歧 支持许多知名的振荡器 根据突破实现交易信号 显示适当的止损和获利水平 可配置的振荡器参数 可自定义的颜色和尺寸 按条形过滤大小差异 实现绩效统计 它实现了电子邮件/声音/视觉警报 为了提供广阔的市场前景,可以使用不同的振荡器在同一张图表中多次加载该指标,而不会产生干扰。该指标支持以下振荡器: RSI CCI MACD OSMA 随机 动量 很棒的振荡器 加速器振荡器 威廉姆斯百分比范围 相对活力指数 由于差异可能会扩大很多,尤其是在外汇市场中,因此该指标产生了转折:它在等待交易突破之前等待donchian突破确认差异。最终结果是带有非常可靠的交易信号的重新粉刷指示器。 输入参数 幅度:用于寻找差异的之字形周期 振荡器-选择要加载到图表的振荡器。 突破期-交易信号的突破期,以柱为单位。 发散类型-启用或禁用发散类型:隐藏,常规或两者。 最小散度单位为条形-最小散度单位为条形
Advanced Supply Demand
Bernhard Schweigert
4.91 (302)
现在优惠 30%! 任何新手或专业交易者的最佳解决方案! 该指标是一款独特、高质量、且价格合理的交易工具,因为我们已经整合了许多专有功能和新公式。 依据此更新,您将能够显示双重时间帧区域。 您不仅可以显示一个较高的时间帧,还可以同时显示图表时间帧,加上更高的时间帧:显示嵌套时区。 供需双方所有交易者都会喜欢它。 :) 重要信息披露 高级供需的最大潜力,请访问 https://www.mql5.com/zh/blogs/post/720245   想象您的交易如何得以改善,是因为您能够精准定位入场或目标位吗? 构建于新的底层算法,它可以更轻松地识别出买卖双方之间的潜在失衡。 这是因为它以图形方式展示供需最强劲区域,及其过去的表现(显示旧区域)。 这些功能旨在帮助您更轻松地发现最佳入场区域和价位。 现在您可以针对您的交易品种和时间帧来优化和编辑区域强度! 高级供需指标适用于所有产品和时间帧。 它是一个新的公式,非常新的功能是两个区域强度函数可由用户输入进行调整! 这在交易中是一大优势。 当您学习如何使用专有功能,例如带有价格游离最小 X 因子的区域强度时,您能够判断该区域强劲与否。 供需
The Super Arrow Indicator provides non-repainting buy and sell signals with exceptional accuracy. Key Features No repainting – confirmed signals remain fixed Clear visual arrows: green for buy, red for sell Real-time alerts via pop-up, sound, and optional email Clean chart view with no unnecessary clutter Works on all markets: Forex, gold, oil, indices, crypto Adjustable Parameters TimeFrame Default: "current time frame" Function: Sets the time frame for indicator calculation Options: Can be set
CRT Candle Range Theory HTF MT4 - Ultimate CRT Indicator: 高级ICT概念与马来西亚SnR交易系统 使用最先进的 Candle Range Theory 指标掌握做市商的足迹。释放 Smart Money Concepts (SMC) 的真正力量,并使用 Ultimate CRT Indicator 像机构一样精确交易。该指标专为严肃的交易者打造,自动化了高效的蜡烛范围理论 (CRT)——ICT概念 (Inner Circle Trader) 的核心支柱,并通过马来西亚支撑与阻力 (SnR) 入场方法和 FVG (不平衡) 区域的致命精度对其进行了强化。 无论您是在 MT4 或 MT5 上交易外汇、加密货币还是指数,该算法都能消除市场噪音,过滤虚假突破,并将高概率、高回报的交易区域直接传送到您的图表上。 CRT Indicator 的核心功能: Absolute Extreme SnR Entry Engine: 与依赖滞后吞没形态的传统指标不同,我们的系统采用了马来西亚 SnR 技术。它在严格的时间窗口内扫描绝对最高的 Buy-
Apollo SR Master
Oleg Rodin
5 (3)
Apollo SR Master 是一款支撑/阻力指标,其特殊功能使利用支撑/阻力区域进行交易更加便捷可靠。该指标通过检测局部价格顶部和底部,实时计算支撑/阻力区域,没有任何时间延迟。为了确认新形成的支撑/阻力区域,该指标会显示特殊信号,表明该支撑/阻力区域可以作为实际的卖出或买入信号。在这种情况下,支撑/阻力区域的强度会增强,因此从该区域进行交易的成功率也会更高。这正是该指标的核心理念。 SR区域也使止损和止盈的操作更加便捷。根据信号方向,可以将SR区域上方或下方的空间用作止损位。此外,相对的SR区域也可以用作潜在的止盈区域。 我还免费向所有 Apollo SR Master 指标的用户提供我的“Apollo 价格行为系统”指标。这两个指标结合使用将帮助您找到更好的入场点。 购买后请联系我,即可免费获得交易指导和超棒的额外指标!
Advanced Currency Strength28 Indicator
Bernhard Schweigert
4.91 (659)
目前40%的折扣 任何新手或专家交易者的最佳解决方案! 这个指标是一个独特的、高质量的、可负担得起的交易工具,因为我们纳入了一些专有的功能和一个新的公式。只需一个图表,你就可以读出28个外汇对的货币强度!想象一下,你的交易将如何得到改善,因为你的交易是在你的手中进行的。想象一下,你的交易将如何改善,因为你能够准确地确定新趋势或剥头皮机会的触发点? 用户手册:点击这里  https://www.mql5.com/en/blogs/post/697384 这是第一本,原版的! 不要买一个毫无价值的崇拜者的克隆品。 特别的 子窗口中的箭头显示强劲的货币势头GAP将指导你的交易! 当基础货币或报价货币处于超卖/超买区域(外盘斐波那契水平)时,在个人图表的主窗口中出现警告信号。 当货币力量从外围区间回落时,回撤/反转警报。 十字星模式的特别警报 可选择多个时间框架,以快速查看趋势! 货币强度线在所有的时间框架中都非常平稳,当使用较高的时间框架来识别总体趋势,然后使用较短的时间框架来确定精确的入口时,效果非常好。你可以根据自己的意愿选择任何时间框架。每个时间框架都由其自身进行了优化。
DayTrader PRO MT4
Davit Beridze
4.6 (10)
DayTrader PRO MT5:  https://www.mql5.com/en/market/product/186222 DayTrader PRO 是一款先进的交易指标,它结合了约翰·埃勒斯 (John Ehlers) 的 Laguerre 滤波器与强大的自动优化引擎。该指标不依赖固定的参数,而是根据最新的市场状况自动搜寻最佳设置,帮助您在无需手动调整的情况下适应不断变化的市场波动。 该指标可生成清晰的买入 (BUY) 和卖出 (SELL) 信号,并提供根据当前市场波动率计算得出的自适应止损 (Stop Loss) 和止盈 (Take Profit) 水平。内置的趋势、效率系数 (Efficiency Ratio)、波动率和蜡烛图过滤功能,有助于剔除低质量的交易设置,从而提高信号的准确性。 实时性能面板会显示当前已优化的设置、利润因子 (Profit Factor)、胜率 (Win Rate)、回撤 (Drawdown) 以及其他交易统计数据。DayTrader PRO 还支持弹出窗口、推送、邮件和声音提醒,确保您不会错过任何交易机会。 主要功能 全自动参数优化 自适应买入
KURAMA GOLD SIGNAL PRO(MT4)— 7层过滤 · 自动止盈止损 · 质量评分 · 信号历史保存 | 完整的XAUUSD交易系统 实时不重绘。信号出现的瞬间,箭头、入场、止盈、止损当场锁定,之后绝不移动。你交易的就是这个实时信号。而且在v7.20中,每一个真正发出的信号都会自动保存,并在重启后精确还原。 购买者专属赠品 购买永久授权,即可免费获得 AI Zone Radar(价值$59)+ 完整PDF手册。在产品价格之外,额外附赠价值$59的赠品。购买后在MQL5上给我留言即可。 AI Zone Radar: https://www.mql5.com/en/market/product/175834 在黄金交易者社区中被实际使用,因精度与易用性而广受好评。 你的难题 —— 以及解决方案 黄金一天波动$30–$50。你知道机会就在那里。但这些情况是否似曾相识: - 入场太早,价格逆行$10后才朝你的方
This is a professional chart indicator designed for traders focused on stability and clear price action. It helps filter market noise and provides clear visual entry and exit zones for your trading decisions. Core Features: Strictly Non-Repainting: The system is built with strict non-repaint logic. What you see on the chart is the true historical performance. Confirmed Signals: Signals are triggered and confirmed only after the candle closes . Once a trading arrow appears on a closed candle, it

Quantum Naked SMC Prime is a streamlined Smart Money Concepts indicator designed for traders who prefer a clean chart, structured market analysis and clear visual trade setups without unnecessary complexity. The indicator combines market structure, liquidity behavior, institutional zones and confirmation logic into a compact analytical framework. Instead of flooding the chart with technical indicators, Quantum Naked SMC Prime focuses on the core elements of price action and Smart Money Concepts
Forex Breath System
Oleg Rodin
5 (5)
Forex Breath System 它是一个基于趋势的交易系统,可用于任何市场。您可以将此系统用于货币、金属、商品、指数、加密货币甚至股票。它也可以在任何时间范围内使用。该系统是通用的。它显示趋势并提供趋势箭头信号。当信号出现在趋势方向时,该指标还可以为您提供特殊类型的警报,从而使趋势交易成为一项简单的任务。 该指标非常易于使用,因为它根本不需要处理任何难以理解的设置。 您只需将其附加到图表中即可开始交易。无论您喜欢哪种交易风格,系统都会帮助您了解市场的方向以及趋势方向上可能的入场点。 该系统将对所有交易者有所帮助,无论他们的交易经验水平如何。 该指示器提供所有类型的警报,包括推送通知。 购买后请联系我以获得交易说明和丰厚奖金! 祝您交易愉快、盈利!
Prop Firm Sniper
Mohamed Hassan
4.33 (6)
Prop Firm Sniper MT4  is a professional market structure indicator that automatically identifies high-probability BUY and SELL opportunities using BOS and CHoCH analysis. Recommended Timeframes: For backtesting, use the indicator on   M5 or M15   for Gold (XAUUSD), and   M15 or H1   for more volatile Forex pairs such as   GBPUSD, USDJPY, EURGBP , and similar markets. CONTACT ME AFTER PURCHASE TO CLAIM YOUR FREE BONUSES! Prop Firm Sniper  is a professional market structure indicator designed t
“动态剥头皮震荡指标”是一款高级自定义加密货币外汇指标,适用于 MT4 平台,高效交易! ............................................................................................................ - 新一代震荡指标 - 参见图片了解如何使用。 - 动态剥头皮震荡指标具有自适应超卖/超买区域。 - 震荡指标是一款辅助工具,可从动态超卖/超买区域找到准确的入场点。 - 超卖值:低于绿线,超买值:高于橙线。 - 该指标也非常适合与价格行为模式结合使用。 - 它比标准震荡指标更精准。 - 提供 PC 和移动端警报。 ................................................... 点击这里查看高质量的交易机器人和指标! 本产品为原创,仅在 MQL5 网站上提供。
Scalping Points Pro
Andrey Kozak
5 (3)
Scalping Points Pro 是一種在圖表上顯示可能的價格反轉點且不會重新繪製其信號的指標。此外,指標通過電子郵件和推送向交易者發送信號。該指標信號的準確度在 M5 時間框架上約為 92-94%,在 H1 時間框架上超過 95%。因此,該指標允許交易者準確地打開交易並預測進一步的價格走勢。 該指標不會重新繪製其信號。 該指標適用於從 M1 到 D1 的時間範圍。 每個購買指標並撰寫評論的人都將收到我們贈送的用於自動交易的機器人。 使用該指標,您可以為外匯交易構建有效的交易系統,也可以將其集成到機器人中。 指標設置: Period_Ma_Short - 短移動週期。 Period_Ma_Long - 長移動週期。 signal - 向電子郵件和推送發送通知。
PZ Wedges
PZ TRADING SLU
3 (2)
该指标找到 楔形 ,它们是通过围绕价格合并期的趋同趋势线确定的延续模式。它使用donchian突破与形态突破一起发出交易信号。 [ 安装指南 | 更新指南 | 故障排除 | 常见问题 | 所有产品 ] 易于使用 可自定义的颜色和尺寸 它实现突破信号 它实现了各种警报 最佳用法 要查看可能重叠的所有大小的楔形,请在图表上多次加载具有不同大小的指标,例如6、12、18和24。 输入参数 大小:要找到的图案的大小,用替代点之间的条形表示 突破期:唐契安期指示交易 最大。历史柱线:图表中要检查的过去柱线的数量 看涨形态的颜色:此参数不言自明 空头形态的颜色:此参数不言自明 不间断图案的颜色:此参数不言自明 线宽:图案线的大小 看涨突破的颜色:这是买入箭头的颜色 看跌突破的颜色:这是卖出箭头的颜色 箭头大小:这是图表中显示的箭头的大小 自定义警报名称:此图表中引发的警报的自定义标题 显示警报:启用或禁用屏幕警报 电子邮件警报:启用或禁用邮件警报。 推送警报:启用或禁用推送警报。 声音警报:启用或禁用声音警报。 声音文件:出现屏幕警报时播放的声音文件。 作者 Arturo Lopez Pe
作者的更多信息
Relative Volume RVOL
Alberto Gauer Borrego
4.75 (4)
Relative Volume or RVOL   is an indicator that averages the volume of X amount of days, making it easy to compare sessions volumes. The histogram only has 3 colors: Green - Above average volume Yellow - Average volume Red - Below average volume The default setting is 20 days, which corresponds more or less to a month of trading. In this version is possible to choose between tick and real volumes (if you are using a broker which offers future contracts) With the data obtained from this in
FREE
Tick and Range Bars Generator
Alberto Gauer Borrego
5 (1)
This utility here gives you a lot of bang for your buck by being a 2 in 1 custom candles generator. For the price of 1 utility, you get 2 !! It creates offline charts that will behave like a live chart. It has 2 modes of operation: Tick and Range These are not time based charts. They will enhance your analysis giving you an edge by filtering a lot of useless and confusing price noise, leaving behind the most important price levels/market structure. When set to "Tick" mode, it will generate
Cipher B Divergences
Alberto Gauer Borrego
4.8 (5)
Finally a Metatrader version of the very popular (and expensive) Market Cipher B indicator, or the Vumanchu Cipher B + Divergences very popular on Tradingview platform. This tool is very heavy on calculations, total are 31 plots using 97 buffers from several indicators. On my mid end computer, timeframes below M15 start getting a bit laggy, so it would require a powerful computer to run it properly at very low timeframes. It's still usable here, but somewhat sluggish response in Metatrader (lik
FREE
Relative Volume MT4
Alberto Gauer Borrego
4 (1)
Relative Volume or RVOL is an indicator that averages the volume of X amount of days, making it easy to compare sessions volumes. The histogram only has 3 colors: Green - Above average volume Yellow - Average volume Red - Below average volume The default setting is 20 days, which corresponds more or less to a month of trading. With the data obtained from this indicator you can better gauge the commitment behind a move. For example, you will be better equipped to judge if a breakout of a r
FREE
Forex Master Pattern MT4
Alberto Gauer Borrego
4.67 (21)
The Forex Master Pattern  is an alternative form of technical analysis that provides a framework which will help you to find and follow the hidden price pattern that reveals the true intentions of financial markets. This algorithm here does a good job detecting the Phase 1 of the Forex Master Pattern cycle, which is the contraction point (or Value).  On Phase 2 we get higher timeframe activation (also called Expansion), which is where price oscillates above and below the average price defined
ICT Power of 3
Alberto Gauer Borrego
One of the most powerful and important ICT concepts is the Power of 3. It explains the IPDA (Interbank Price Delivery Algorithm) phases. PO3 simply means there are 3 things that the market maker's algorithm do with price: Accumulation, Manipulation and Distribution ICT tells us how its important to identify the weekly candle expansion and then try to enter above or below the daily open, in the direction of the weekly expansion. This handy indicator here helps you keep track of the weekly and
Forex Master Pattern
Alberto Gauer Borrego
4.92 (12)
The Forex Master Pattern  is an alternative form of technical analysis that provides a framework which will help you to find and follow the hidden price pattern that reveals the true intentions of financial markets. This algorithm here does a good job detecting the Phase 1 of the Forex Master Pattern cycle, which is the contraction point (or Value).  On Phase 2 we get higher timeframe activation (also called Expansion), which is where price oscillates above and below the average price defined
ICT Power of 3 MT5
Alberto Gauer Borrego
5 (1)
One of the most powerful and important ICT concepts is the Power of 3. It explains the IPDA (Interbank Price Delivery Algorithm) phases. PO3 simply means there are 3 things that the market maker's algorithm do with price: Accumulation, Manipulation and Distribution ICT tells us how its important to identify the weekly candle expansion and then try to enter above or below the daily open, in the direction of the weekly expansion. This handy indicator here helps you keep track of the weekly and
This utility solves the problem of Metatrader not having the capacity to create custom session times, all markets are displayed forcefully in a 24h format. Lots of traders prefer to ignore the overnight action and focus only on NY session and use the overnight gaps as part of their trading strategy. ICT teaches this as "opening range gap", it's the gap between NY session end (16:15) and NY session start (09:30). The default setting in this utility reflects the RTH (Regular Trading Hours) opti

If you want a reliable seconds chart that works properly, look no further. This utility here uses tick data to create a precise seconds chart. You just need to load it on a M1 chart and choose how many seconds you want the chart to be. The utility creates an offline chart that gets updated on every tick so it behaves as if it were a live chart. It receives tick data so you can load custom indicators on it.  It's not possible to trade from the seconds chart. The screenshots below show a 30 se
筛选:
无评论
回复评论