Leo Fibonacci

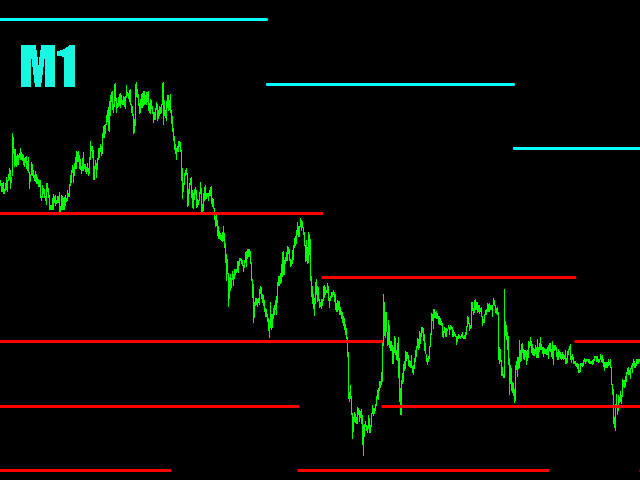
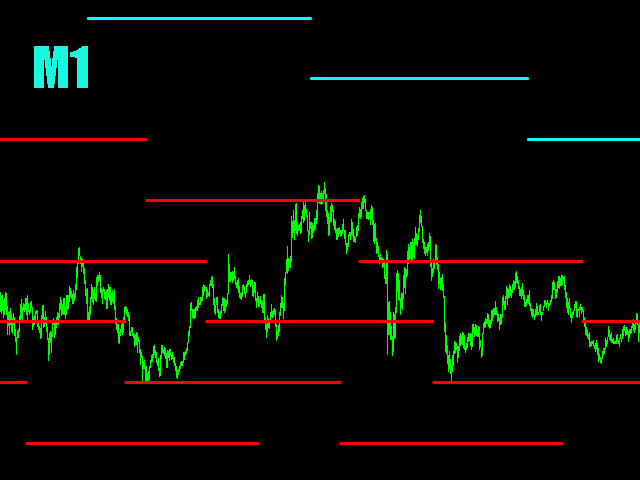
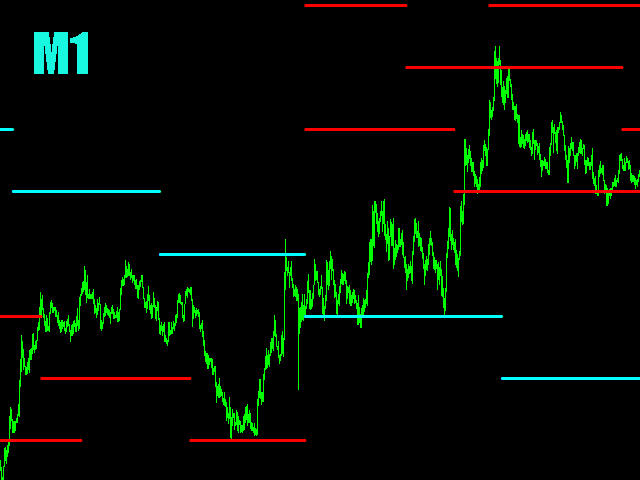
The indicator is designed for determining Fibonacci levels.

  • Does not repaint/redraw
  • The blue level shows the zero Fibonacci value (it is also the Pivot level)
  • Red levels show calculated Fibonacci levels (used as a rollback or reversal point)
  • Automatic period detection (periods can be entered manually)
  • Adjustable display calculation method.

Settings

  • BarsHistory - the number of bars to be used to display the indicator.
  • Method - method of calculation.
  • AutoPeriod - automated period calculation (true or false)
  • period - manual period specification.

Note: the manual period specification is active if AutoPeriod mode is set to false!

推荐产品
Fibonacci SR Indicator
Martin Eshleman
3 (2)
菲波纳奇支撑阻力指标 本指标创建支撑和阻力线。此指标基于菲波纳奇回撤和扩展级别。它会考虑菲波纳奇级别的多种组合,并在这些基础上绘制支撑/阻力线。此指标使用的顶部和底部由之字折线指标计算而来。如有必要,之字折线也可以在图表上绘制。 本指标考虑许多过去的反转点和菲波纳奇比率级别的组合,而当它看到多条线在相同的价格汇合,那么这将成为指标绘制的支撑/阻力线。未来的市场反转往往会正好出现在这些线附近。这是一个自动指标。所以,旧线将被删除,新线将随着市场的进步而绘制。 设置 Bars_Back - 向后一定数量的柱线用于所有计算。数量较少则较少反转点将被使用,因此,绘制的支撑和阻力线较少。向后更多柱线则有更多反转点将被使用,因此,绘制的支撑和阻力线较多。  Buffer_Space - 这表示每个已计算的菲波纳奇级别所需的汇合之间的最大点数。该数值越高,则确切的汇合必须越少。数字越低,则精确汇合必须更多,因此有较高的可靠性。例如, 让我们设为 10 点, 且指标运行在非分形的 4-位报价经纪商 (同样是 10 点)。此指标看到 3 个 菲波纳奇 回撤级别,分别在 1.4995, 1.5000,
FREE
Fibonacci Wave Bands
Luc Michael Botes
Fibonacci Wave Bands Indicator The Fibonacci Wave Bands indicator utilizes Fibonacci ratios to create dynamic bands around a central moving average. These bands are derived from key Fibonacci ratios (typically 38.2%, 50%, 61.8%) and adapt to market volatility, offering insights into potential support and resistance zones. Key Features: Fibonacci Levels: The indicator plots multiple bands above and below a central moving average based on Fibonacci ratios. Dynamic Support and Resistance: Bands ser
Trendlines Chart Patterns Indicator (MT4) Automated Chart Patterns & Breakout Signals for MT4: Trade with Precision! The "Trendlines Chart Patterns Indicator" is an advanced trading tool for MetaTrader 4 (MT4) , meticulously designed to identify high-probability buy and sell signals based on dynamically forming, robust trend lines and popular chart patterns . This powerful forex indicator automates the complex process of identifying patterns like triangles, flags, ranges, ascending/descending tr
Fibonacci calculator is used with Elliot Waves, it can generate remarkable results. A trader could use these levels or ratios to find high probability trades with very small stop loss. You may also use these ratios to find Elliott Waves extensions and to book profit near those levels. For Elliot Wave experts, Fibonacci calculator is a highly useful tool that can assist them in calculating Fibonacci extension and retracement levels for the market price. The indicator proves itself as a useful one
Lines for MT4
Radim Kucera
Do you need to check support and resistance lines? Do you need to find them really fast and automatically? Do you want to set your own settings how to find them? Indicator Lines is developed for finding support and resistance lines on chart. It does its job quickly and fully automatically. Main principle of algorithm is to get all extremes on chart (according to "Density" parameter). Then indicator tries to find minimally 3 points (according to "Minimal count of points" parameter) which can be u
MultiFiboDynamicMT4
Andrey Spiridonov
MultiFiboDynamicMT4 is a powerful, professional indicator for estimating the most important support and resistance levels. The main advantage is that it plots the Fibonacci levels at all timeframes simultaneously, which allows the trader to see the full picture of the possible price movement of the trading instrument! Advantages of the indicator The indicator is perfect for scalping and trading binary options. Suitable for beginners and experienced traders. Works on all timeframes. Works on any
FREE
Fibonaccitools
Aymn Sʿyd Ahmd Hsn Alkwmy
斐波那契回撤是交易者可以用來繪製支撐線、確定阻力位、下止損單和設定目標價格的流行工具。 斐波納契回撤是通過在股票圖表上取兩個極值點並將垂直距離除以關鍵斐波納契比率 23.6%、38.2%、50%、61.8% 和 100% 來創建的。 斐波那契工具指標將繪製斐波納契工具,例如 回撤、弧線、扇形、擴張、時區。 基於鋸齒形指標" 斐波那契回撤是交易者可以用來繪製支撐線、確定阻力位、下止損單和設定目標價格的流行工具。 斐波納契回撤是通過在股票圖表上取兩個極值點並將垂直距離除以關鍵斐波納契比率 23.6%、38.2%、50%、61.8% 和 100% 來創建的。 斐波那契工具指標將繪製斐波納契工具,例如 回撤、弧線、扇形、擴張、時區。 基於鋸齒形指標"
This indicators automatically draws the Support and resistances levels for you once you've dropped it on a chart.  It reduces the hustle of drawing and redrawing these levels every time you analysis prices on a chart. With it, all you have to do is dropped it on a chart, adjust the settings to your liking and let the indicator do the rest.  But wait, it gets better; the indicator is absolutely free!  Get the new and improved version here:  https://youtu.be/rTxbPOBu3nY Parameters Time-frame  -> T
FREE
Auto AndrewFork
Noor Ghani Rahman
1 (1)
Auto Pitchfork Indicator The indicator calculate the Pitch fork for the previous Day (Selectable) with multiple Support and Resistance lines from the Median price which acts as Magnet for the Price that if price touch the above warning (1) or below warning (1) lines and not cross up or down then there is maximum possibilities that it will return to the Median Line, and thus maintain the Price Action in Cyclic Pattern to the Market Move. You are able to select how many warning lines you want to k
Fibonacci Retracements Pro
Savia Forex Software Solutions
Fibonacci Retracements Pro The Fibonacci Retracements Pro is a powerful yet easy to use indicator. It automatically plots all the important Fibonacci retracement and extension levels for you. FRP is dynamic powerful and seamlessly adjusts to whatever timeframe you are analyzing. Fibonacci Retracement Pro is optimized for ALL timeframes and ALL Currency pairs, Indices, Commodities, and Cryptocurrency pairs. Trade with improved confidence and maximize your success rate. Benefits Dynamic and Power
The Arrow Scalper
Fawwaz Abdulmantaser Salim Albaker
1 (2)
Dear Friend..  I share with you this simple Expert Adviser .. it is full automatic  this Expert Adviser following the trend of the pair you install on or any stocks or indices , it is works like that: - when the trend on H4 chart show a start of up trend the expert will wait till the 15M & 1H charts show an up trend the EA will open a buy order directly , and do the same for down trend and open a sell order the buy or sell  order lot size and take profit and stop loss will measured manually  by
FREE
Tract
Andriy Sydoruk
Tract - Channel indicator, by which you can place orders like a classic channel indicator. Trading can be carried out inside the channel when the price reaches its borders and turns in the opposite direction from them. In such cases, reversal strategies are used. The channel indicator is designed to work with support and resistance levels and help traders find opportunities to enter the market. Another way to trade a breakout - assumes a situation when the price, upon reaching one or another cha
The Grid Inside
Luiz Godoy
5 (1)
The Grid Inside works on a counter trend mode, automatically opens a new order when it hits the price target due to the Fibonacci levels at 23.6 and 73.6. If the price goes the wrong way it opens another order with a calculated lot and position. All the positions are closed when it reaches the target profit defined on settings. As TGI does not use stop loss, I don't recommend you put on your account more than you can afford to lose, the higher the timeframe safer it gets. Once an order is trigge
Auto Fibo mw
DMITRII GRIDASOV
“Auto FIBO” Crypto_Forex 指标 - 是一款出色的交易辅助工具! - 指标自动计算并绘制斐波那契水平线和局部趋势线(红色)。 - 斐波那契水平线指示价格可能反转的关键区域。 - 最重要的水平线是 23.6%、38.2%、50% 和 61.8%。 - 您可以将其用于反转剥头皮交易或区域网格交易。 - 您还可以使用 Auto FIBO 指标来改进您当前的系统。 ................................................................................................................. 点击这里查看高质量的交易机器人和指标! 这是仅在 MQL5 网站上提供的原创产品。
Fibonacci theft   is an ultrascalping system that uses Fibonacci levels to launch a scalping system that allows   theft     a few pips from the market. This system allows the use of fibonacci levels, predetermined levels or a level chosen by the user. It also presents the option of using or not volume and impulse filters. Being a very aggressive scalping system, it should only be used in pairs with a low spread and low commissions. This system is suitable for small accounts and can be used wit
ForexAurum Fibonacci indicator is a useful tool for traders who are using Fibonacci combined with the ZigZag indicators. It uses the real-time calculation of the levels for all the timeframes and displays the results for you. In addition, you can setup RSI, ADX and Stochastic indicators to confirm entries. How to use it Just drag and drop the indicator on an 1 minute chart of any symbol. Then you can switch to a higher timeframe at anytime after the initialization. Recommendation Always drag a
This indicator Super Channel Pro indicator.Indicator displays trend movement. Indicator calculates automatically line. Features FiltPer - displays indicator channel period. deviation - displays indicator channel deviation. deviation2 - displays indicator channel deviation. How to understand the status: If the arrow is green, trend is up. If the arrow is red, trend is down. ///////////////////////////////////////////////////////////////////////////////////////////////////////////////////////////
NO REPAINT ADVANCED CHART PATTERN INDICATOR By definition, a price ( chart)  pattern is a recognizable configuration of price movement that is identified using a series of  trendlines  and/or curves. When a price pattern signals a change in trend direction, it is known as a reversal pattern; a continuation pattern occurs when the trend continues in its existing direction following a brief pause. Advanced Chart Pattern Tracker is designed to find the MOST ACCURATE patterns. A special script is a
这个指标可以检测通过手动和自动方法绘制在图表上的谐波图案。 添加您的评论,请 备注 该指标具有控制面板,并将保存每个(图表和时间框架)的设置。您可以将其最小化,以在图表上腾出更多空间,或者如果您更喜欢使用其他分析工具,可以按下关闭按钮隐藏图表上的所有指标数据。 当您使用此指标并更改设置、添加指标(如移动平均线或布林带)时,指标会自动保存您的编辑模板,您可以随时加载它们。 如果您使用的是Windows 10操作系统,请右键单击MetaTrader图标 > 兼容性 > 更改高DPI设置 > 系统(增强),以获得最佳的屏幕设置(应在高清设备上进行)。 该指标简单地基于谐波交易理论进行图表上的谐波图案检测。如果您希望深入学习,您可以搜索Scott Carney撰写的名为《谐波交易第1卷和第2卷》的书籍。 该指标具有价格和时间警示线。 指标将在您检测到的图案上绘制斐波那契扇形。 指标将绘制支撑/阻力射线。 指标具有批量计算器,帮助您管理风险。 您可以从较高时间框架手动加载绘制的对象到较低时间框架。 重置按钮将清除所有保存的设置(所有/当前)时间框架。 该指标具有警报/通知系统,将为您提供信号的目
Utility for show on charts the visual informations about: - a vertical line at start of each bar of selected timeframe - a vertical line at start of each day - a vertical line at start of each week - vertical lines at start / end of trading sessions selected - bid / ask prices, spread, money value for each point (of 1 standard lot) and last tick time recived" You can enable / disable each information and set the color for each line
FREE
Market Maker
Chantal Sala
The Market Maker indicator focuses on key levels as minimum, maximum, opening and closing of important time frames. An attentive observation of these levels will enable you to identify the proper direction of the trend. On these levels the Market Makers try to make a very hunt of Stop Loss. We recommend to use Daily values on H1 chart, Weekly values on H4 chart and Monthly values on D1 charts. Use it setting all three time frames on the same chart and you will see that these levels will be a gre
Free automatic fibonacci
Tonny Obare
4.67 (49)
Free automatic Fibonacci is an indicator that automatically plots a Fibonacci retracement based on the number of bars you select on the BarsToScan setting in the indicator. The Fibonacci is automatically updated in real time as new highest and lowest values appears amongst the selected bars. You can select which level values to be displayed in the indicator settings. You can also select the color of the levels thus enabling the trader to be able to attach the indicator several times with differe
FREE
Pivot levels Auto V1
Hafis Mohamed Yacine
What Is a Pivot Point? A pivot point is a technical analysis indicator, or calculations, used to determine the overall trend of the market over different time frames. The pivot point itself is simply the average of the intraday high and low, and the closing price from the previous trading day. On the subsequent day, trading above the pivot point is thought to indicate ongoing bullish sentiment, while trading below the pivot point indicates bearish sentimen How to Use Pivot Points The very ess
特别优惠 : ALL TOOLS ,每款仅 $35 ! New tools   will be   $30   for the   first week   or the   first 3 purchases !  Trading Tools Channel on MQL5 : Join my MQL5 channel to update the latest news from me 在波动剧烈的交易环境中,一款功能强大且直观的分析工具可以帮助您迅速抓住机会。Fibonacci Trend Scanner不仅结合了传统Fibonacci指标与SuperTrend功能,而且通过货币对扫描、多周期监控以及当趋势在多头与空头之间转换时的智能提醒,进一步扩大了其应用范围。 See more MT5 version at:   Fibonacci Trend MT5 Scanner See more products at:   All Products 1. 结合SuperTrend技术的趋势分析 Fibonacci Trend Scanner采用 SuperTrend 算法,可快速准确
Voenix
Lorentzos Roussos
4.58 (12)
谐波模式扫描仪和交易员。一些图表模式 包括的模式: ABCD 模式 加特利模式 蝙蝠图案 密码模式 3驱动模式 黑天鹅图案 白天鹅图案 Quasimodo 模式或 Over Under 模式 替代蝙蝠图案 蝴蝶图案 深蟹纹 蟹纹 鲨鱼纹 五O型 头肩形态 上升三角形图案 一二三模式 和 8 种自定义模式 Voenix 是一款多时间框架和多对谐波模式扫描仪,支持 25 种图表和斐波那契模式。它采用自定义块光学算法,无需重新绘制,无需依赖确认步骤即可迅速发现可能的模式(与锯齿形计算不同)。 它可以自动交易您选择的模式、发送通知或只是将它们收集在一个表格中以便于访问和评估。 交易最多可以有 3 个利润目标,并且,在每个目标关闭的订单百分比方面的差异。 还提供了一个简单的步进跟踪功能。 每种形态都可以用自己的止损、目标、止损计算模式、警报设置、交易设置进行调整,并且可以在交易(或通知)之前接受额外的过滤器 这些过滤器是 rsi、macd、布林带、随机震荡指标和基本支撑和阻力解决方案的基本指标。 模式被收集在一个快速访问表上,并且可以根据它们的出现时间、类型、它们出现的符号、它们的时间范围
Clever Trend Swing Levels
Carlos Forero
4.22 (9)
描述: 该指标通过之字形指标衡量趋势或修正水平。 它在图表中显示了检测到的每个低或高电平。 该指标有何用处? 该指标根据之字形参数确定趋势是开始,发展还是结束 该指标确定趋势的方向 组件 水平为正数或负数,取决于趋势的方向和回撤的数量。 其他建议指标 CEF计数水平旨在通过以下指标来工作和补充其信号: 一般指标 选择最佳货币进行交易(CEF点差货币点差) 趋势指标 确定趋势级别(CEF计数级别)(实际指标) 确定趋势强度(CEF趋势力) 信号工具 完整的策略信号指示器(CEF Scalper Pro) 查找订单块模式(CEF订单块信号) 查找市场市场格局(CEF TDI Pro信号) 其他非常有用的工具 确定范围扩展或收缩的概率(CEF范围预测器)
FREE
Crazy Dancing Levels
Mohamed yehia Osman
Crazy Dancing moving RES/SUP Levels Automatic redrawing of moving Supports and resistances levels  to indicate price breaking supports (signal SELL)  or breaking resistance levels (signal BUY) Very simple appearing indicator but very clever and smart too !!!! Main Inputs: # of bars for the support and resistances levels + the initial shift from start + moving average for filter signaling Smaller values for bars /shift inputs when using Higher Time frames (D1-H4) and the reverse higher values for
YK Fibo Pivot Indicator
Peechanat Chatsermsak
YK-Fibo Pivot Indicator: Trade Smarter with Fibonacci Pivot Points The YK-Fibo Pivot Indicator is a powerful technical analysis tool that combines the precision of Fibonacci retracements with the insights of Pivot Points. Whether you're a novice or seasoned trader, this indicator empowers you to spot profitable opportunities in the market with ease. Why Choose YK-Fibo Pivot? Pinpoint Support & Resistance: By calculating Fibonacci levels based on the previous day's high, low, and close prices, y
MTC Equidistant Channel
Abdelmadjid Hidouche
The MTC Equidistant Channel indicator is a helping tool for the traders who use: The supports and resistances lines; The trends; Fibonacci levels; It's a combination between the ZigZag indicator and the Equidistant chanel, It helps to detect the break-outs in many strategies and shows the possible entry points. The indicator capabilities : Drawing the Equidistant chanel automatically on the ZigZag indicator. The possibility of changing the ZigZag indicator settings. The indicator works on all ti
Crazy Dancing moving RES/SUP Levels Automatic redrawing of moving Supports and resistances levels  to indicate price breaking supports (signal SELL)  or breaking resistance levels (signal BUY) Very simple appearing indicator but very clever and smart too !!!! Main Inputs: # of bars for the support and resistances levels + the initial shift from start + moving average for filter signaling Smaller values for bars /shift inputs when using Higher Time frames (D1-H4) and the reverse higher values for
该产品的买家也购买
Gann Made Easy
Oleg Rodin
4.82 (148)
Gann Made Easy 是一个专业且易于使用的外汇交易系统,它基于使用先生理论的最佳交易原则。 W.D.江恩。该指标提供准确的买入和卖出信号,包括止损和获利水平。您甚至可以使用推送通知在旅途中进行交易。 购买后请联系我,免费获取交易提示、奖金和 GANN MADE EASY EA 助手! 您可能已经多次听说过江恩交易方法。通常 Gann 的理论不仅对于新手交易者而且对于那些已经有一定交易经验的人来说都是非常复杂的东西。这是因为江恩的交易方法在理论上并不那么容易应用。我花了几年时间来完善这些知识,并将最好的原则应用到我的外汇指标中。 该指标非常易于应用。您所需要的只是将其附加到您的图表并遵循简单的交易建议。该指标不断进行市场分析工作并寻找交易机会。当它检测到一个好的入口点时,它会为您提供一个箭头信号。该指标还显示止损和获利水平。 换句话说,当您像先生一样进行交易时,该指标会为您提供最佳江恩建议。江恩亲自告诉你此时此刻该做什么。但最好的部分是您不需要了解任何有关江恩交易原则的知识,因为该指标会为您完成整个市场分析工作。
Game Changer Indicator
Vasiliy Strukov
5 (7)
Game Changer 是一款革命性的趋势指标,适用于任何金融工具,可将您的 MetaTrader 平台升级为强大的趋势分析工具。该指标不会重绘,也不会出现滞后。它适用于任何时间范围,有助于识别趋势,发出潜在反转信号,可用作追踪止损机制,并提供实时警报,以便您快速做出市场反应。无论您是经验丰富的交易员、专业人士,还是寻求优势的初学者,这款工具都能帮助您自信、自律地进行交易,并清晰地了解潜在的趋势动态。 购买后立即联系我,即可获得个人奖励!您可以免费获得我们的强力支撑和趋势扫描指标,请私信我! 请注意,我不在 Telegram 上出售我的 EA 或特殊套件,它们仅适用于 MQL5,我的套件文件也仅在我的博客上提供。 请小心诈骗者 ,不要从其他人那里购买任何套件! 设置 启用趋势变化警报 - 真/假 - 趋势变化时在图表上显示警报 发送推送通知 - 真/假 - 启用手机推送警报通知 发送邮件通知 - 真/假 - 发送趋势变化的邮件通知到电子邮件
目前八折优惠! 对任何新手或专家交易者来说都是最好的解决方案! 这个仪表板软件适用于28种货币对。它基于我们的两个主要指标(高级货币强度28和高级货币冲动)。它对整个外汇市场提供了一个伟大的概述。它显示高级货币强度值,货币运动速度和28个外汇对在所有(9)时间段的信号。想象一下,当你可以使用图表上的单一指标观察整个市场,以确定趋势和或剥头皮的机会时,你的交易将得到改善 我们已经在这个指标中建立了一些功能,使你更容易识别强势和弱势货币,同时识别和确认潜在的交易。该指标以图形方式显示货币的强势或弱势是增加还是减少,以及它在所有时间段的表现。 增加的新功能是动态市场斐波那契水平,它适应当前的市场条件变化,这是一个已经在我们的高级货币强度28和高级货币冲动指标中使用的成熟的加分项。 在交易时,总是将弱势货币和强势货币配对,这个新指标将帮助你做到这一点。 用户手册:点击这里  https://www.mql5.com/en/blogs/post/708783 特点  显示每个时间段的ACS28和GAP-speed(冲动)的货币强度值。 列:颜色代码以7种颜色显示货币强度:强势
Meravith
Ivan Stefanov
5 (1)
该指标从每个点分析成交量,并计算该成交量的市场疲劳水平。 它由三条线组成: 牛市成交量疲劳线 熊市成交量疲劳线 表示市场趋势的线。该线根据市场是熊市还是牛市变化颜色。 您可以从任何选择的起点分析市场。一旦达到成交量疲劳线,确定一个新的起点来开始下一次分析。 您可以分析任何内容——趋势和修正。一个好的方法是每次当它达到趋势线或形成顶部或底部时移动指标。 趋势线与某一成交量疲劳线之间的距离越大,说明该方向的成交量越大。 趋势线可以作为开单的位置,而疲劳线则用于收集利润。 该系统非常独特,但又极其直观。 市场上没有类似的产品。 使用没有限制。可以在所有市场和所有时间框架中应用。 重要提示:在MetaTrader4测试器中检查时,双击紫色线条,然后左右移动它以分析市场。 如有任何问题,请随时联系我。
M1 Sniper
Oleg Rodin
4.89 (18)
M1 SNIPER 是一款易于使用的交易指标系统。它是一个专为 M1 时间框架设计的箭头指标。该指标可以作为独立的系统在 M1 时间框架下进行剥头皮交易,也可以作为您现有交易系统的一部分使用。虽然该交易系统专为 M1 时间框架交易而设计,但它也可以用于其他时间框架。我最初设计此方法是为了交易 XAUUSD 和 BTCUSD。但我发现这种方法在其他市场交易中也同样有用。 指标信号既可以顺势交易,也可以逆势交易。我教授一种特殊的交易技巧,帮助您利用指标信号进行双向交易。该方法基于使用特殊的动态支撑位和阻力位区域。 购买后,您可以立即下载 M1 SNIPER 箭头指标。此外,我还为所有 M1 SNIPER 工具用户免费提供下方屏幕截图所示的 Apollo Dynamic SR 指标!这两个指标的组合可以帮助您更轻松、更准确地利用 M1 时间框架进行交易。 购买后请联系我,免费获取交易提示和奖励指标! 祝您交易成功!
Scalper Inside PRO
Alexey Minkov
4.74 (69)
An exclusive indicator that utilizes an innovative algorithm to swiftly and accurately determine the market trend. The indicator automatically calculates opening, closing, and profit levels, providing detailed trading statistics. With these features, you can choose the most appropriate trading instrument for the current market conditions. Additionally, you can easily integrate your own arrow indicators into Scalper Inside Pro to quickly evaluate their statistics and profitability. Scalper Inside
Currency Strength Exotics
Bernhard Schweigert
4.88 (33)
目前8折优惠! 对任何新手或专家交易者来说都是最好的解决方案! 这个指标是专门用来显示任何符号的货币强度,如异国货币对、商品、指数或期货。它是同类产品中的第一个,任何符号都可以添加到第9行,以显示黄金、白银、石油、DAX、US30、MXN、TRY、CNH等的真实货币强度。这是一个独特的、高质量的、负担得起的交易工具,因为我们已经纳入了一些专有的功能和一个新的公式。想象一下,你的交易将如何改善,因为你能够准确地确定新趋势或剥头皮机会的触发点? 用户手册:点击这里   https://www.mql5.com/en/blogs/post/708876 它适用于所有时间框架。你将很快能够看到TREND! 根据新的基础算法设计,它使识别和确认潜在交易变得更加容易。这是因为它以图形方式显示了8种主要货币和一种符号的强弱。 该指标显示了8种主要货币(澳元加元瑞士法郎欧元英镑日元新西兰美元)的强弱线,再加上一个符号! 该指标显示了符号的真实价值。例如:对于XAUUSD(黄金):价格以美元报价。如果黄金在上涨,你怎么能知道是黄金的强势还是美元的弱势?只有当黄金走强时,我们才会进行交易。该指
Advanced Supply Demand
Bernhard Schweigert
4.91 (296)
现在优惠 33%! 任何新手或专业交易者的最佳解决方案! 该指标是一款独特、高质量、且价格合理的交易工具,因为我们已经整合了许多专有功能和新公式。 依据此更新,您将能够显示双重时间帧区域。 您不仅可以显示一个较高的时间帧,还可以同时显示图表时间帧,加上更高的时间帧:显示嵌套时区。 供需双方所有交易者都会喜欢它。 :) 重要信息披露 高级供需的最大潜力,请访问 https://www.mql5.com/zh/blogs/post/720245   想象您的交易如何得以改善,是因为您能够精准定位入场或目标位吗? 构建于新的底层算法,它可以更轻松地识别出买卖双方之间的潜在失衡。 这是因为它以图形方式展示供需最强劲区域,及其过去的表现(显示旧区域)。 这些功能旨在帮助您更轻松地发现最佳入场区域和价位。 现在您可以针对您的交易品种和时间帧来优化和编辑区域强度! 高级供需指标适用于所有产品和时间帧。 它是一个新的公式,非常新的功能是两个区域强度函数可由用户输入进行调整! 这在交易中是一大优势。 当您学习如何使用专有功能,例如带有价格游离最小 X 因子的区域强度时,您能够判断该区域强劲与否。 供需
Trend indicator AI
Ramil Minniakhmetov
5 (74)
趋势人工智能指标是一个伟大的工具,将加强交易者的市场分析结合趋势识别与可操作的进入点和逆转警报。 该指标使用户能够自信和精确地驾驭外汇市场的复杂性 除了主要信号,趋势Ai指标识别在回调或回调期间出现的次要入口点,使交易者能够利用既定趋势内的价格修正。 重要优势: *MT4及MT5工程 *明确买入或卖出信号 ·不重绘 *适用于所有资产 小心我不卖EA或设置电报它骗局. 所有设置免费在这里的博客。  重要! 购买后立即与我联系,以获得指示和奖金! 真实的操作监控以及我的其他产品可以在这里找到: https://www.mql5.com/en/users/mechanic/seller&nbsp ; 设置和输入: 建议为所有资源设置默认设置。 第...
M1 Arrow
Oleg Rodin
5 (19)
M1 Arrow - 基于市场的两个基本原则的盘中策略。 该算法基于使用附加过滤器对交易量和价格波动的分析。该指标的智能算法仅在两个市场因素合二为一时才会发出信号。该指标使用较高时间框架的数据计算 M1 图表上某个范围的波浪。为了确认波浪,该指标使用了成交量分析。 从理论上讲,该指标可以与其他时间框架一起使用,但您需要考虑到该指标最初是为在 M1 上交易而开发的这一事实。 该指标是一个现成的交易系统。交易者所需要的只是跟随信号。此外,该指标可以成为您自己的交易系统的基础。交易仅在分钟图表上进行。 尽管指标使用 MTF 原理,但指标算法尽可能稳定。 购买后,一定要写信给我!我将与您分享我的交易设置和建议!祝您交易成功!感谢您的关注!
SMC Easy Signal
Mohamed Hassan
4.73 (15)
3 copies left at $65, next price is $120 SMC Easy Signal was built to remove the confusion around the smart money concept by turning structural shifts like BOS (Break of Structure) and CHoCH (Change of Character) into simple buy and sell trading signals. It simplifies market structure trading by automatically identifying breakouts and reversals as they happen, allowing traders to focus on execution rather than analysis. Whether the market is continuing its trend or preparing to reverse, the i
购买此指标即可免费获得我的专业交易管理器。 首先,值得强调的是,这个交易系统是一个非重绘、非重画和非滞后的指标,这使得它非常适合手动和机器人交易。 在线课程,手册和下载预设。 “智能趋势交易系统 MT5”是专为新手和经验丰富的交易者量身定制的综合交易解决方案。它结合了超过 10 个优质指标,具有 7 多个强大的交易策略,使其成为适用于各种市场条件的多功能选择。 趋势跟随策略:提供精确的入场和止损管理,以有效地跟随趋势。 反转策略:识别潜在的趋势反转,使交易者能够利用区域市场的机会。 剃头策略:专为快速准确的日内交易和短期交易而设计。 稳定性:所有指标都不会重绘、不会重画和不会滞后,确保可靠的信号。 定制:支持自定义策略,以满足个人交易偏好。超过 7 种策略和组合可帮助您找到最佳策略。 信号清晰度:提供箭头信号,以指示清晰的入场和退出点。 实时警报:通过交易进出警报使交易者保持了解。 深入分析:提供更高时间框架的趋势分析和实时交易监控。 自适应颜色编码:利用蜡烛颜色编码来显示成交量、趋势和反转蜡烛信号。通过蜡烛颜色分析市场方向。 “智能趋势交易系统 MT5”赋予交易者必要的工具,以便在
本指标是实践实战交易完善的波浪自动分析的指标 !  案例... 注: 波浪分级用西方叫法不习惯,因受到缠论(缠中说禅)命名方式习惯的影响,我是将基础波浪命名为 笔 ,将二级波段命名为 段 ,同时具有趋势方向的段命名为 主趋段 (以后笔记中都是这种命名方式,先告知大家),但是算法上和缠论关系不大切勿混淆.反映的是本人分析盘面总结的 千变万化纷繁复杂的运行规律 . 对波段进行了标准化定义,不再是不同人不同的浪  ,   对人为干扰的画法进行了排除,在严格分析进场起到了关键的作用 . 使用这个指标,等于将交易界面提升美感,抛弃最原始的K线交易带你进入新的交易层次.如果不是为了交易,在宣传上也将使客户观感提升层次. 指标内容: 1. 基础波浪 (笔) : 首先我们找出了价格波动过程中的基础波动拐点,当然他的有序性低,为下一步的计算提供基础. 2. 二级波段( 段 ) :在基础波浪的基础上,通过算法分析得到层级更明显的二级波段,二级波段为波浪提供了分析基础 3. 波浪( 浪 ): 有着更清晰的趋势,更清晰直观的方向.分析一个波浪是否延续,需要看二级波段的形态,分析二级的构成,可以得出波浪后
PRO Renko System
Oleg Rodin
5 (29)
PRO Renko Arrow Based System for trading renko charts.  准确的信号交易任何外汇工具. 另外,我将免费提供系统的附加模块! PRO Renko系统是RENKO图表上高度准确的交易系统。该系统是通用的。 该交易系统可应用于各种交易工具。 该系统有效地中和了所谓的市场噪音,打开了获得准确反转信号的通道。 该指标易于使用,只有一个参数负责产生信号。 您可以很容易地使算法适应您感兴趣的交易工具和renko酒吧的大小。 我很乐意通过提供任何咨询支持来帮助所有客户有效地使用该指标。 祝您交易成功!购买后,立即写信给我! 我将与您分享我的建议和我的renko发电机。 另外,我将免费提供系统的附加模块!
FX Power MT4 NG
Daniel Stein
4.95 (20)
FX Power:分析货币强度,助您做出更明智的交易决策 概述 FX Power 是一款专业工具,帮助您全面了解主要货币和黄金在任何市场条件下的真实强度。通过识别强势货币用于买入,弱势货币用于卖出, FX Power 简化了交易决策,并帮助您发现高概率的交易机会。不论您是想跟随趋势还是通过极端的 Delta 值预测反转,这款工具都能完美适应您的交易风格。别再盲目交易——用 FX Power 让您的交易更加智慧。 1. 为什么 FX Power 对交易者极具价值 实时货币和黄金强度分析 • FX Power 实时计算并显示主要货币和黄金的相对强度,助您全面了解市场动态。 • 监控领先或落后资产,轻松识别值得交易的货币对。 全面的多时间框架视图 • 跟踪短期、中期和长期时间框架的货币和黄金强度,以便将您的交易策略与市场趋势保持一致。 • 无论是快进快出的短线交易还是更长期的投资策略, FX Power 都能为您提供所需的信息。 Delta 动态分析用于趋势和反转 • 极端 Delta 值常常预示反转机会,而平缓的 Delta 变化则确认趋势延续。 • 使用 Delta 分析,轻
Looking for a powerful yet lightweight swing detector that accurately identifies market structure turning points? Want clear, reliable buy and sell signals that work across any timeframe and any instrument? Buy Sell Arrow MT Swing is built exactly for that — precision swing detection made simple and effective. This indicator identifies Higher Highs (HH) , Higher Lows (HL) , Lower Highs (LH) , and Lower Lows (LL) with remarkable clarity. It is designed to help traders easily visualize market str
Dynamic Forex28 Navigator
Bernhard Schweigert
4.43 (7)
Dynamic Forex28 Navigator - 下一代外汇交易工具。 当前 49% 折扣。 Dynamic Forex28 Navigator 是我们长期流行的指标的演变,将三种功能合二为一: 高级货币强度 28 指标 (695 条评论)+ 高级货币 IMPULSE 带警报 (520 条评论)+ CS28 组合信号(奖励)。 有关指标的详细信息 https://www.mql5.com/en/blogs/post/758844 下一代强度指标提供什么? 您喜欢的原始指标的一切,现在通过新功能和更高的精度进行了增强。 主要特点: 专有货币强度公式。  所有时间范围内的平滑和准确的强度线。 非常适合识别趋势和精确进入。 动态市场斐波那契水平(市场斐波那契)。  此指标独有的独特功能。 斐波那契应用于货币强度,而不是价格图表。 适应实时市场活动以获得准确的反转区域。 实时市场动量。  第 9 行显示市场是活跃还是被动。 对于定时交易至关重要。 全面的警报和显示。  每种货币最强的买入和卖出动量。 ​​28 对的双重动量买入和卖出。 超买/超卖警告外部范围和止损。 反转
ACB Breakout Arrows
KEENBASE SOFTWARE SOLUTIONS
4.15 (34)
ACB Breakout Arrows 指标通过识别一种特殊的突破形态,为交易者提供关键的入场信号。该指标持续扫描图表中某一方向上趋于稳定的动能,并在主要行情启动之前给出准确的进场信号。  点击此处获取多品种、多周期扫描仪 - ACB Breakout Arrows MT4 专用扫描仪 主要功能 指标自动提供止损和止盈位置。 配备 MTF 多周期扫描仪面板,可跟踪所有时间周期的突破信号。 适用于日内交易者、波段交易者和剥头皮交易者。 采用优化算法,提高信号准确性。 提供特殊目标线,用于设置快速平仓点或无损平移位(Quick Profit Line)。 包括胜率、成功率、平均收益等表现分析指标。 不重绘,信号一旦出现即保持不变。 交易确认 -  建议结合使用 ACB Trade Filter 指标 以过滤低质量信号。 强买入: 上箭头 + 绿色柱状图 + 多头趋势。 强卖出: 下箭头 + 红色柱状图 + 空头趋势。 避免交易 :当柱状图为灰色且趋势为震荡时。 (可选) -  建议使用 KT  支撑与阻力位指标  来避免在关键支撑/阻力区域附近开仓。此类交易可能迅速转为亏损,造成不必
Currency Strength Wizard
Oleg Rodin
4.84 (55)
货币强度向导是一个非常强大的指标,为您提供成功交易的一体化解决方案。该指标使用多个时间范围内所有货币的数据来计算这个或那个外汇对的力量。此数据以易于使用的货币指数和货币电力线的形式表示,您可以使用它们来查看这种或那种货币的力量。 您所需要的只是将指标附加到您要交易的图表上,该指标将向您显示您交易的货币的真实强度。该指标还向您显示买卖量压力的极值,您可以在顺势交易时利用这些压力。该指标还显示了基于斐波那契的可能目标。该指标可用于各种交易时间范围。该指标支持各种货币对的交易。 该指标为您提供所有类型的警报,包括推送通知。 购买后请联系我。我将与您分享我的交易技巧,并免费为您提供丰厚的红利指标! 祝您交易愉快,获利丰厚!
Advanced Currency Strength28 Indicator
Bernhard Schweigert
4.91 (657)
目前26%的折扣 任何新手或专家交易者的最佳解决方案! 这个指标是一个独特的、高质量的、可负担得起的交易工具,因为我们纳入了一些专有的功能和一个新的公式。只需一个图表,你就可以读出28个外汇对的货币强度!想象一下,你的交易将如何得到改善,因为你的交易是在你的手中进行的。想象一下,你的交易将如何改善,因为你能够准确地确定新趋势或剥头皮机会的触发点? 用户手册:点击这里  https://www.mql5.com/en/blogs/post/697384 这是第一本,原版的! 不要买一个毫无价值的崇拜者的克隆品。 特别的 子窗口中的箭头显示强劲的货币势头GAP将指导你的交易! 当基础货币或报价货币处于超卖/超买区域(外盘斐波那契水平)时,在个人图表的主窗口中出现警告信号。 当货币力量从外围区间回落时,回撤/反转警报。 十字星模式的特别警报 可选择多个时间框架,以快速查看趋势! 货币强度线在所有的时间框架中都非常平稳,当使用较高的时间框架来识别总体趋势,然后使用较短的时间框架来确定精确的入口时,效果非常好。你可以根据自己的意愿选择任何时间框架。每个时间框架都由其自身进行了优化。
Trend Screener
STE S.S.COMPANY
4.79 (95)
趋势指标,趋势交易和过滤的突破性独特解决方案,所有重要趋势功能都内置在一个工具中! 它是 100% 非重绘多时间框架和多货币指标,可用于所有符号/工具:外汇、商品、加密货币、指数、股票。 限时优惠:支撑和阻力筛选指标仅售 50美元,终身有效。(原价 250 美元)(优惠延长) 趋势筛选器是有效的指标趋势跟踪指标,它在图表中提供带有点的箭头趋势信号。 趋势分析器指标中可用的功能: 1.趋势扫描仪。 2. 具有最大利润分析的趋势线。 3.趋势货币强度计。 4. 带有警报的趋势反转点。 5. 带有警报的强趋势点。 6. 趋势箭头 每日分析示例,每日信号表现...等与我们的趋势筛选指标,可以在这里找到: 点击这里 限时优惠:Trend Screener Indicator 仅售 50 美元且终身可用。原价 125$) 通过访问我们的 MQL5 博客,您可以找到我们所有的高级指标以及分析示例、每日信号表现...等。 : 点击这里 我们的趋势系统由 2 个指标组成: 1. Trend Screener Indicator:显示趋势仪表盘、图表中的趋势线、入场点...等。 2. Trend
Day Trader Master
Oleg Rodin
5 (15)
Day Trader Master 是一个完整的日间交易者交易系统。该系统由两个指标组成。一个指标是买入和卖出的箭头信号。这是你得到的箭头指示器。我将免费为您提供第二个指标。第二个指标是专门设计用于与这些箭头结合使用的趋势指标。 指标不重复也不迟到! 使用这个系统非常简单。您只需按照当前趋势方向的箭头信号,显示为双色线。蓝色是买入趋势。红色是一种销售趋势。蓝色箭头是买入信号。红色箭头是卖出信号。您需要箭头的颜色和信号的方向来匹配趋势线的颜色。 箭头指标主要是为 M5 和 M15 时间间隔的日内交易而创建的。但从技术上讲,该系统可以用于其他时间间隔。 指示器配备带有推送消息功能的弹出警报。 购买后一定要写信给我!我将为您提供与系统交易的个人建议,以及我的趋势指标。此外,还有丰厚的奖励等着您!
特别优惠 : ALL TOOLS ,仅 $35 一个! 新工具   将以   $30   在   第一周   或   前 3 笔购买 销售!  Trading Tools Channel on MQL5 : 加入我的 MQL5 频道获取最新动态 Volumatic Support/Resistance Levels Scanner 是一款支撑/阻力指标,为价格结构加入成交量背景。通过显示交易活动在近期转折点附近的聚集情况,它帮助用户了解买入或卖出兴趣最活跃的位置。 查看 MT5 版本:  Volumatic Support Resistance Levels MT5 Scanner 查看更多产品:  All P roducts 1 · 概览 该指标从最近的高点和低点绘制价格区间,并为每个区间叠加成交量直方图。直方图厚度会随当前市场活动而扩展或收缩,使用户能够衡量市场对特定价格水平的关注度。 2 · 关键概念 价格区间 — 在最近价格转折点绘制的水平带。 成交量直方图 — 根据区间附近成交量百分位变化宽度的填充带。 高成交量标记 — 当区间成交量超过用户设定阈值时出现的圆圈。 Bars
Entry Points Pro
Yury Orlov
4.62 (172)
这是一款 MT4 的趋势指标,可提供准确的入场交易信号,且无重绘或延迟。 它可应用在任何金融资产:外汇、加密货币、贵金属、股票、指数。 最好的结果出现在 M15+ 的时间帧内。 指标的 MT5 版本 重要! 购买后请联系我,以便获取详细指南和奖励。 视频 (6:22) - 一个信号赢取的利润等于指标价格的三倍。 视频 (4:44) - 它如何在测试器中工作,我的提示和技巧。 视频 (1:44) - 有关它如何处理加密货币和指数的几句话。 大多数交易者在 Entry Points Pro 指标的帮助下,在第一个交易周内就改善了他们的交易结果。 Entry Points Pro 指标的益处 入场信号无重绘或延迟 如果信号出现,并得到确认(如果信号所在烛条已收盘),则它不会再消失;不像是重绘指标,它会导致重大的财产损失,因为它们可以在显示信号后再将其删除。 无差错开仓 指标算法可令您找到入场交易(买入或卖出资产)的理想时机,从而提高每位交易者的成功率。 Entry Points Pro 可操作任何资产 它允许您在 MT4 平台上交易任何经纪商提供的加密货币、股票、金属、指数、商品
Hidden Cycles
Lev Vladimirovic Marushkin
5 (1)
Black Friday Sale – Limited Time! Grab Hidden Cycles for only $129 (regular price $179 ). This is your chance to boost your strategy with a powerful, easy-to-use cycle-based trading tool. Offer ends soon — don’t miss it! Based on Universal Laws — NOT Some Guy’s Algorithm: Let the market adjust to the Hidden Cycles Geometry — not the other way around. Most indicators are based on a man-made formula. They often lag, fail over time, or need constant re-optimization.  Hidden Cycles is different.
Adaptive Volatility Range
Stanislav Konin
5 (3)
Adaptive Volatility Range [AVR] is a powerful tool for identifying key trend reversal points. AVR accurately reflects the Average True Range (ATR) of volatility, taking into account the Volume-Weighted Average Price (VWAP). The indicator adapts to any market volatility by calculating the average volatility over a specific period, ensuring a stable rate of profitable trades. You receive not just an indicator but a professional automated trading system , AVR-EA . Advantages: Automated Trading Sys
Smc Blast Signal
Mohit Dhariwal
SMC Blast Signal with FVG, BOS and trend Breakout The SMC Blast Signal  is a  Precise trading system for Meta Trader 4 that uses Smart Money Concepts (SMC) , including Fair Value Gaps (FVG) and Break of Structure (BOS) , to identify high-probability trades. It incorporates a Trend Filter using a higher timeframe moving average, ensuring trades align with the prevailing market trend. TREND SIGNAL-FVG DETECTION-BOS DETECTION-TRADE CONFIRMED-Precise Signal entries on m15  Best TF-M15 AND ABOVE Be
Upper and Lower Reversal - 早期预测反转时刻的系统。允许您在价格变动通道的上限和下限的边界处找到价格转折点。 指示器永远不会重新着色或改变信号箭头的位置。红色箭头是买入信号,蓝色箭头是卖出信号。 适应任何时间范围和交易工具 该指标不会重新绘制,仅在蜡烛收盘时起作用。 信号警报有多种类型 该指标易于使用,只有 2 个外部可配置参数: Channel Length - 调整构建信号的价格通道的长度。 Signal Normalization - 改变信号箭头的质量水平,参数越高 - 错误信号越少(对于 BTC、黄金和高波动性工具,变化几个数量级) Alerts play sound / Alerts display message / Alerts send notification / Send email - 当输入信号箭头出现时使用通知。 Sound for signals - 信号箭头的声音文件。
Advanced Currency IMPULSE with ALERT
Bernhard Schweigert
4.91 (489)
目前31%的折扣!! 对任何新手或专家交易者来说都是最好的解决方案! 这个指标是一个独特的、高质量的、负担得起的交易工具,因为我们已经纳入了一些专有的功能和一个秘密的公式。只需一张图表,它就能给出所有28种货币对的警报。想象一下,你的交易将如何改善,因为你能够准确地确定新趋势或剥头皮机会的触发点 建立在新的基础算法上,它使识别和确认潜在交易变得更加容易。这是因为它以图形方式显示了一种货币的强势或弱势是否正在加速,并测量了这种加速的速度--把它想象成你汽车中的速度表。当你加速时,事情显然会发生得更快,这在外汇市场上也是一样的,即如果你配对的货币正在向相反的方向加速,你就会发现一个潜在的有利可图的交易。 货币动量的垂直线和箭头将指导你的交易! 动态的市场斐波那契23水平被用作警报触发器,将适应市场活动。如果冲动触及黄色触发线,您将在MetaTrader或您的电子邮件或推送警报中收到警报。然后你就知道作为一个交易员应该做什么。货币对和方向已经给出。只要点击警报按钮,就可以切换到该货币对或打开一个新的图表,以便进一步分析。警报级别可以通过用户输入来改变,可以选择3个敏感度级别。 尽
Binary Trader Master 是一个基于箭头的指标,可预测蜡烛的收盘价。它仅在一根蜡烛内进行分析。当蜡烛打开时,需要一些时间来进行分析并预测蜡烛的收盘价。然后它产生一个信号。该指标还允许您应用可用于分析的时间限制,这意味着您实际上可以告诉指标允许在蜡烛内进行分析的时间。该指标监控蜡烛中的特殊交易量模式。该分析实际上预测了当前 (0) 蜡烛的收盘价。由于此类蜡烛通常具有强劲的成交量,因此这些信号也具有良好的获利潜力,也可用于外汇交易。二元和外汇交易者都可以从该指标中受益。 由于指标与单个蜡烛的主体一起使用,因此指标仅在实时或视觉策略测试模式下提供信号! 信号不要重绘! 购买后请联系我!我会为您提供交易说明,免费赠送您丰厚的红利!
作者的更多信息
Forex Fraus MAD DOG
Dmitriy Zaytsev
3.5 (2)
The Expert Advisor of the Forex Fraus is designed for scalping the EURUSD (for five-digit quotes) and adapted for the accounts with fast execution of orders. Operation Principle When a signal is received, the orders are opened by accumulation using tick data; The robot does not apply indicators and other analytical systems. The signals are calculated using H1 and M1 chart processing results; The EA has three operation modes; Normal : uses the filter for trend trading; Turbo : uses the filter th
FREE
Pivot Candles
Dmitriy Zaytsev
The indicator is designed to determine the pivot level for a group of candlesticks and the trend direction. no repainting calculation is done on an active candle if candlesticks are above the main line, the trend is upward if candlesticks are below the main line, the trend is downward breakdown of the main line signals a trend change or a price rebound two display modes, normal and with acceleration (ModeLite) an auxiliary line displays the resistance line Configurations BarsHistory - how many
FREE
Forex Fraus Dobby
Dmitriy Zaytsev
3.67 (3)
The Expert Advisor of the Forex Fraus family, the system is designed for scalping the EUR/USD pair on the M1 timeframe (for five digit quotes), and adapted for the accounts with fast execution of orders. Operation Principle Buys at the extreme Lows and sells at the extreme Highs of the Stochastic indicator values. When a signal is received the orders are opened by injection, using tick data. Positions are closed by Trailing Stop Not closed positions are closed at the opposite trade Built-in adj
FREE
Индикатор реализован для определения классического канала движения цены, который используется на крупных биржевых площадках. Не перерисовывается Синий уровень - это уровень поддержки  Красный уровень - это уровень сопротивления  Белый уровень - является Pivot-уровнем  Настройки Period_SEC  - ввод  значения периода . Примечание:  Индикатор определяет уровни только на пятизначных котировках! Метод торговли:  Открытие позиций осуществляется от уровней , именно на их значениях происходит отскок цены
FREE
Borey
Dmitriy Zaytsev
The indicator detects price channels, reversal points and trend direction. All timeframes. No repainting. Channel borders are formed by support/resistance levels. Calculation is done on an active candle. If the red line is above the green one, a trend is bullish. If the red line is below the green one, a trend is bearish. After the price breaks through the green line, the indicator starts building a new channel. The indicator works well with the Forex_Fraus_M15.tpl template https://www.mql5.com/
FREE
Forex Fraus Gringotts
Dmitriy Zaytsev
1 (1)
The Expert Advisor of the Forex Fraus family, the system is designed for scalping the EURUSD M1 (for five-digit quotes) and adapted for the accounts with fast execution of orders. Operation Principle Buys when passing 100% of the bearish candle volume and sells when passing 100% of the bullish candle volume; When a signal is received, the orders are opened by injection, using tick data; Positions are closed by Trailing Stop; Not closed positions are closed at the opposite trade; Built-in adjust
Forex Fraus Edelweiss
Dmitriy Zaytsev
3.25 (4)
The Expert Advisor of the Forex Fraus family, the system is designed for scalping and adapted for the accounts with fast execution of orders. Operation Principle It buys and sells based on the values of the internal indicator; When a signal is received, the orders are opened by injection, using tick data; Always sets a stop loss; Positions are closed by Trailing Stop; Not closed positions are closed at the opposite trade; Built-in adjustable risk management block. Depending on the balance, it m
Neonik
Dmitriy Zaytsev
The indicator identifies trends and micro-trends, perfectly suited for those who prefer scalping. It has been developed for working on the M1 timeframe, however it also shows clear trends on the higher timeframes for long-term positions. The indicator does not redraw. The history data of the charts and prices are used for indication. This is the basis for the indicator. If the price is in the blue channel, the trend is bullish. If the price is in the red channel, the trend is bearish. It allows
AntiPhase
Dmitriy Zaytsev
5 (1)
The indicator identifies the trend change points. Does not redraw. Calculation is done on an active candle. Lines crossing is used as a trend change point. If the price is above the two lines, there is an uptrend. If the price is below the two lines, there is a downtrend. The indicator allows you to accurately enter the market during a trend change. It can also be used in custom strategies on a detected trend. 3 modes of notification on trend changes. Sound, arrows, sending push-notifications. I
Sticky SAR
Dmitriy Zaytsev
This indicator is designed for determining the trend direction and price reversal points. This indicator is a heavily modified version of Parabolic SAR. Does not repaint/redraw Calculation on an current candle If the price is above the indicator, trend is ascending. If the price is below the indicator, trend is descending. Trade: If the color and the trend direction changed, open a position and close it by take profit, or hold it until the next trend change. It is also possible to trade rebounds
Forex Fraus Oris
Dmitriy Zaytsev
Принцип работы Покупает и продаёт на основании показаний внутреннего индикатора; После появления сигнала , выставляет сетку. Встроен регулируемый блок риск-менеджмента. В зависимости от баланса следит за величиной исполняемого ордера, распределяя риски; Не использует стандартные индикаторы. Присутствует блок отправки PUSH-уведомлений на смартфон.(после каждой сделки отправляет сообщение на смартфон с данными о текущем балансе и профите).   Тестирование Скачайте бесплатную копию Forex Fraus Oris
筛选:
befonk
69
befonk 2020.11.03 15:27 
 

用户没有留下任何评级信息

回复评论