Channels Plus SR

Channels + S & R Indicator (CSRI)

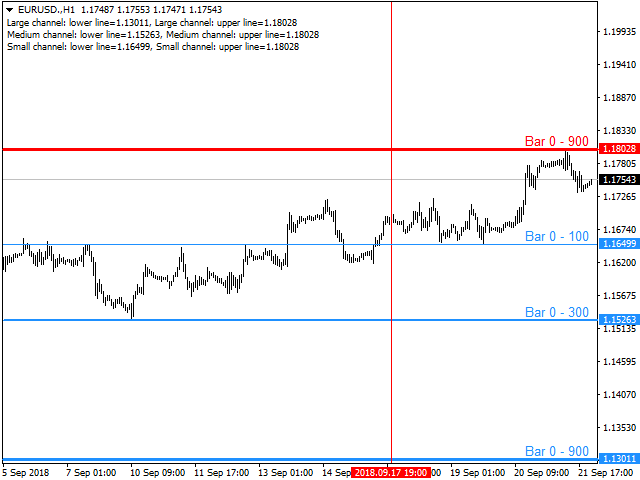
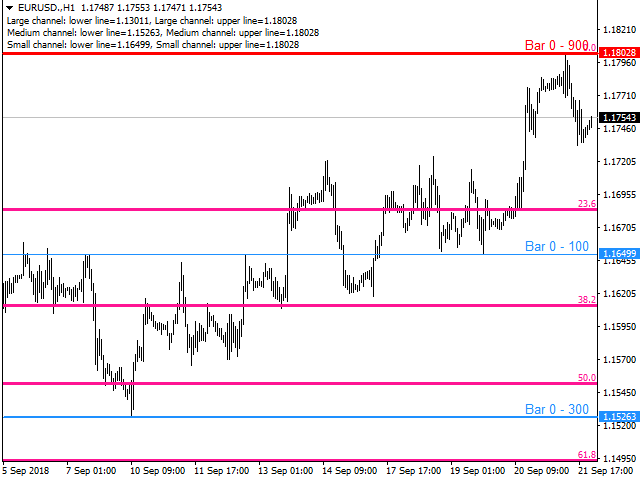
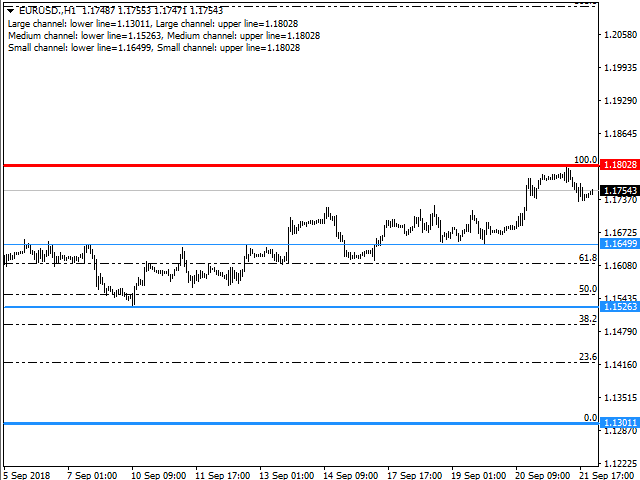
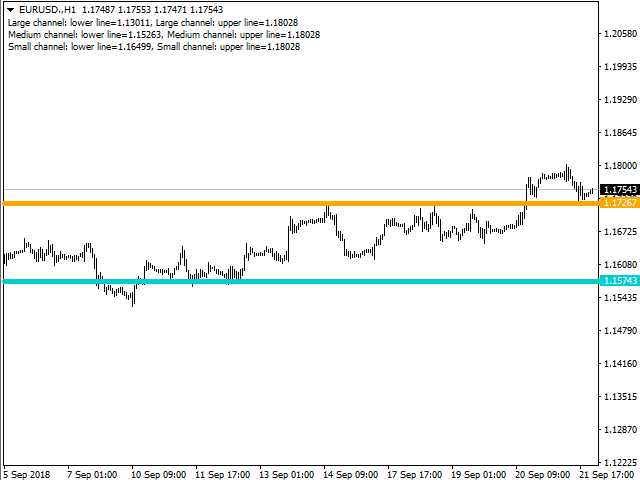
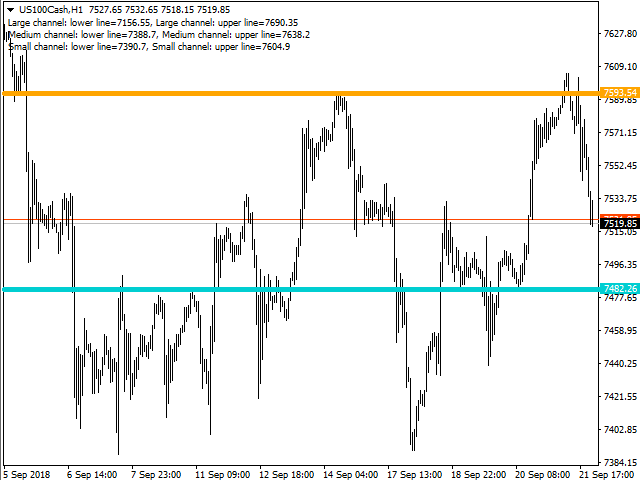
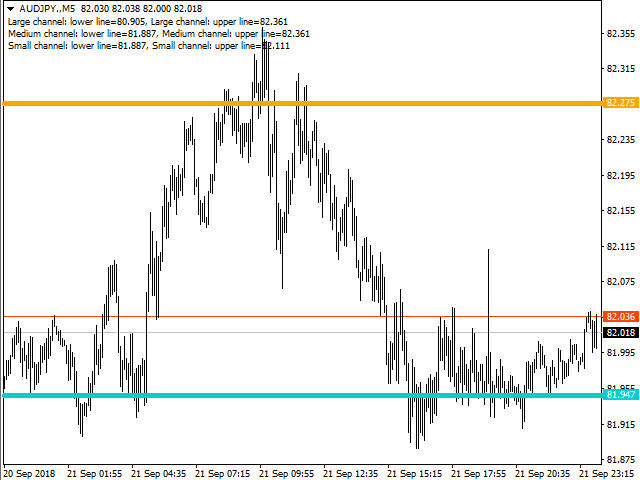
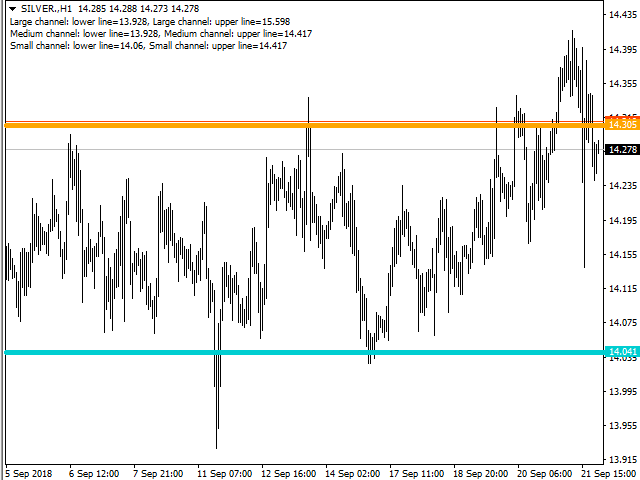
Indicator draws 3 channels (Large, Medium, Small) within bars’ range of current timeframe and pair / instrument. It can identify Support and Resistance levels within any chosen channel. Additionally Fibonacci levels can be drawn for Large Channel. All lines and levels can be customized by color and width.


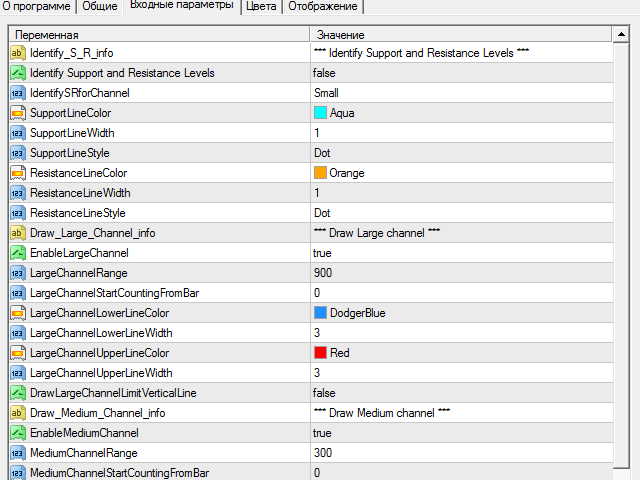
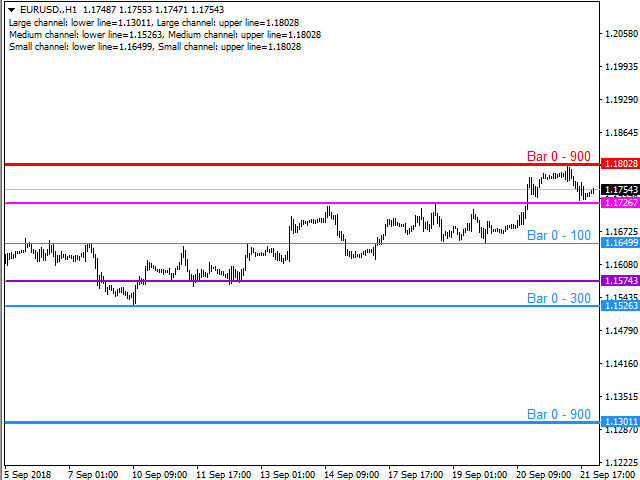
Identify Support and Resistance Levels for any Channel:

  • IdentifySupportAndResistanceLevels - Identify Support and Resistance Levels
  • IdentifySRforChannel – Identify Support and Resistance Levels for Channel:
    • Small – small channel
    • Medium – medium channel
    • Large – large channel
  • SupportLineColor – Support Line Color
  • SupportLineWidth – Support Line Width
  • SupportLineStyle – Support Line Style
  • ResistanceLineColor – Resistance Line Color
  • ResistanceLineWidth – Resistance Line Width
  • ResistanceLineStyle – Resistance Line Style


Calculate and Draw Large Channel:

  • EnableLargeChannel – Enable Large Channel
  • LargeChannelRange – Large Channel Range
  • LargeChannelStartCountingFromBar – Large Channel Start Counting From Bar
  • LargeChannelLowerLineColor – Large Channel Lower Line Color
  • LargeChannelLowerLineWidth – Large Channel Lower Line Width
  • LargeChannelUpperLineColor – Large Channel Upper Line Color
  • LargeChannelUpperLineWidth – Large Channel Upper Line Width
  • DrawLargeChannelLimitVerticalLine – Draw Large Channel Limit Vertical Line


Calculate and Draw Medium Channel:

  • EnableMediumChannel – Enable Medium Channel
  • MediumChannelRange – Medium Channel Range
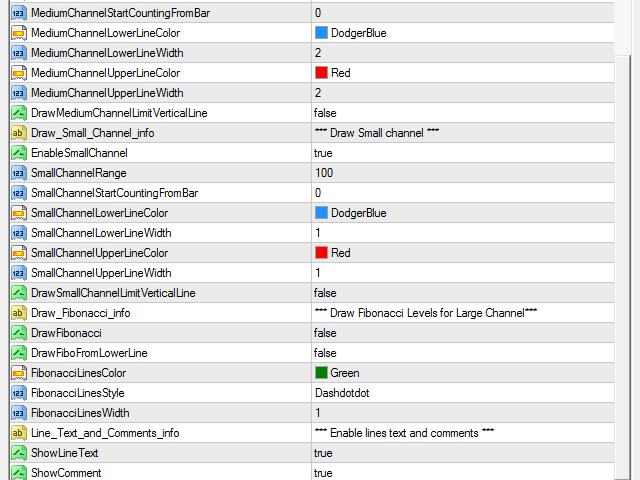
  • MediumChannelStartCountingFromBar – Medium Channel Start Counting From Bar
  • MediumChannelLowerLineColor – Medium Channel Lower Line Color
  • MediumChannelLowerLineWidth – Medium Channel Lower Line Width
  • MediumChannelUpperLineColor – Medium Channel Upper Line Color
  • MediumChannelUpperLineWidth – Medium Channel Upper Line Width
  • DrawMediumChannelLimitVerticalLine – Draw Medium Channel Limit Vertical Line


Calculate and Draw Small Channel:

  • EnableSmallChannel – Enable Small Channel
  • SmallChannelRange – Small Channel Range
  • SmallChannelStartCountingFromBar – Small Channel Start Counting From Bar
  • SmallChannelLowerLineColor – Small Channel Lower Line Color
  • SmallChannelLowerLineWidth – Small Channel Lower Line Width
  • SmallChannelUpperLineColor – Small Channel Upper Line Color
  • SmallChannelUpperLineWidth – Small Channel Upper Line Width
  • DrawSmallChannelLimitVerticalLine – Draw Small Channel Limit Vertical Line


Draw Fibonacci Levels for Large Channel:

  • DrawFibonacci – Draw Fibonacci
  • DrawFiboFromLowerLine – Draw Fibonacci From Lower Line
  • FibonacciLinesColor – Fibonacci Lines Color
  • FibonacciLinesStyle – Fibonacci Lines Style
  • FibonacciLinesWidth – Fibonacci Lines Width


Enable lines text and comments:

  • ShowLineText – Show Line Text
  • ShowComment – Show Comment


推荐产品
Fibonacci Trend Marker
Grigoriy Malychenko
斐波那契趋势标记 ( Fibonacci Trend Marker ) 是一种趋势指标,通过使用斐波那契回撤水平分析当前K线相对于前几根K线的最高-最低 (HL) 范围的行为。它通过K线颜色的变化,直观地跟踪趋势强度,提示可能的趋势减弱或反转。 特点: 专为趋势交易者设计,帮助基于斐波那契水平快速识别趋势变化。 在市场波动性充足且有3-5根K线形成明显趋势时,适用于任何时间框架。 K线大小自动适应图表比例,确保缩放时显示正确。 对趋势变化的高度敏感性源于对当前K线的实时分析,使其非常适合在M1和M5时间框架上进行剥头皮交易。 如何交易? 入场: 在前一根已关闭的K线颜色变化后开仓。例如,如果一根K线在红色后关闭为蓝色,表明上升趋势—开启买入 (Buy) 交易。 离场: 当前一根K线的颜色反转时平仓,或在达到目标时平仓,例如趋势方向上的1-2根K线,具体取决于市场波动性。 当前(未关闭)K线的颜色会随报价变化而改变,这对剥头皮交易者尤其有用,可在K线完成前提前平仓。 设置: 周期 (Period) — 设置用于计算的前几根K线的数量(例如3、5、10)。 斐波水平 (Fibo
Moving pivot Average Fibonacci The  indicator compares the selected period with its counterpart from the previous period. The indicator determines the moving Fibonacci levels for the day or any time interval to assess the price movement range from the time average. The indicator helps predict the expected high or low for the day based on historical time data. The pivot line can be considered an average trend line and use it in a variety of trading strategies. If you have any question about the
XFibo Auto Fibonacci
Welinton Dos Reis Goncalves
5 (1)
Use with disciplined risk management. Fibonacci entry system based on the golden zone 38.2 - 61.8 where the entry is confirmed at 23.6 with indications of Take Profit 3:1. Automatically plotted Fibonacci contains retracement and expansion Fibonacci in a single indicator. Up to 77% win rate with this system. FTMO challenge pass with 0.50% risk and 1.50% R:R.
Transition Trend
Tatiana Savkevych
The Transition Trend indicator shows the points of potential market reversal. The indicator's smart algorithm detects the trend, filters out market noise and generates entry signals and exit levels. Simple, visual and efficient trend detection. Uses just one parameter for settings. The indicator does not redraw and does not lag. You can set up message alerts as sound or email. Works on all currency pairs and all timeframes. Ready-made trading system.
VaviStar is an indicator based on trend retracements determined by ZigZag segments. It is theorized, and statistics confirm, that stocks react to certain retracement levels. Many use Fibonacci retracement levels (23.6%, 38.2%, 61.8%). It is assumed that once the price goes beyond the 61.8% retracement, we can already speak of a trend reversal. This indicator allows you to comfortably chart a segment of the ZigZag with the relative operating levels chosen. With a reversal mindset , you can use it
Introduction This indicator detects volume spread patterns for buy and sell opportunity. The patterns include demand and supply patterns. You might use each pattern for trading. However, these patterns are best used to detect the demand zone (=accumulation area) and supply zone (=distribution area). Demand pattern indicates generally potential buying opportunity. Supply pattern indicates generally potential selling opportunity. These are the underlying patterns rather than direct price action. T
Neuro Poseidon MT4
Daria Rezueva
4.95 (37)
Neuro Poseidon is a new indicator by Daria Rezueva. It combines precise trading signals with adaptive TP/SL levels - creating best possible trades as a result! Message me and get  Neuro Poseidon Assistant  as a gift to automize your trading process! What makes it stand out? 1. Proven profitability on all assets and timeframes 2. Only confirmed BUY and SELL signals present on the chart 3. Adaptive TP & SL levels generated by the software for each trade 4. Easy to understand - suitable for all
My indicator is 1000%, it never repaints, it works in every time period, there is only 1 variable, it sends notifications to your phone even if you are on vacation instead of at work, in a meeting, and there is also a robot version of this indicator With a single indicator you can get rid of indicator garbage It is especially suitable for scalping in the m1 and m5 time frames on the gold chart, and you can see long trends in the h1 time frame.
Super Trend Channels
Muhammed Emin Ugur
Super Trend Channels MT4 Indicator Looking for a versatile and powerful channel indicator for your MetaTrader 4 trading platform? Look no further than the "Super Trend Channels" indicator! This advanced tool is designed to help traders identify trend channels accurately, enabling you to make informed trading decisions with confidence. Key Features: Multi-Channel Support: The "Super Trend Channels" indicator supports multiple channels simultaneously. You can visualize various channel types, inclu
Double Fractal Entry Bot trades automatically using fractal breakouts or rebounds. It detects precise entry points, places SL and TP based on market structure, and includes logic to manage risk and avoid false signals. Simple, smart, and powerful. This product is also available for MetaTrader 5 =>  https://www.mql5.com/en/market/product/143608 Double Fractal Entry Bot is an intelligent trading robot based on the proven logic of the Double Fractal Entry indicator. It analyzes price using upper a
Fibonacci Sniper
Elmira Memish
3.67 (3)
Fibonacci Sniper MT4 - No Repaint Features:  - Indicator sends signals and notifications on key Fibonacci Retracement and Fibonacci Extensions Levels - Once the buy/sell signal is set, targets ( TP1 TP2 TP3 )and stop loss levels are drawn by the indicator. - Fibonacci Calculations and Custom Patterns are identified by the last 3 or 5 Zig Zag exterum. - You can easily identify key harmonic patterns like Gartley, Bat, Butterfly and Crab patterns. Important Settings:  - Choose the Zig Zag Set
黃牛終端介面軟體是一個指標,它不從事自動買賣交易。 此指標顯示當前交易區域,當出現剝頭皮交易機會時可以進入交易。 當出現倒賣訊號時,相關交易對的右側,綠松石色燈亮起,並在其上方寫有確切的交易方向。 之後,點擊綠松石按鈕即可進入交易。 將開啟一個新分頁。 隨後,預計蠟燭收盤,這是進入倒賣交易的條件。 為了透過黃牛終端進行成功的黃牛交易; 請務必觀看說明部分中的影片。 像士兵一樣堅持使用黃牛終端軟體 。 每個交易對的右側有 5M、15M 和 DIRECTION 欄。 首先,點擊“通知”按鈕並將其設為綠色。 您無需一直注視著螢幕。 只需等待綠松石燈訊號或 Metatrader 警報訊息聲音即可。 閱讀上面寫的確切操作方向(也是方向欄文字),它是綠松石色的。 在確切的交易方向上,點擊綠松石按鈕進行倒賣。 在為剝頭皮交易打開的新選項卡中,像獵人一樣等待 pinbar 或吞噬蠟燭關閉。 當 pinbar 或吞沒蠟燭收盤是建倉條件時,按照黃牛終端指示的方向建倉。 在與持倉入場方向相反的一側添加止損單。 (例如,如果是多頭交易,則止損單的位置是最後收盤蠟燭的最低價位。) 然後,將您的止盈訂單新增
Fifty Pro
Ivan Stefanov
5 (1)
FIFTY 指标现在提供自动化版本,无需手动绘制水平线。此版本可自动在图表上绘制每日、每周、每月和年度水平线,确保准确性并节省时间。此外,提供按钮以切换这些水平线的可见性,实现完全自定义。对于喜欢手动操作的用户,免费版本仍然可用且功能齐全,让交易者可以根据自己的需求选择手动或自动工具。 最符合逻辑的指标之一。 高度可靠。 FIFTY 指标现在提供自动化版本,无需手动绘制水平线。此版本可自动在图表上绘制每日、每周、每月和年度水平线,确保准确性并节省时间。此外,提供按钮以切换这些水平线的可见性,实现完全自定义。对于喜欢手动操作的用户,免费版本仍然可用且功能齐全,让交易者可以根据自己的需求选择手动或自动工具。 最符合逻辑的指标之一。 高度可靠。
"Battles between bulls and bears continue to influence price development long after the combat has ended, leaving behind a messy field that observant technicians can use to manage risk and find opportunities. Apply "trend mirror" analysis to examine these volatile areas, looking for past action to impact the current trend when price turns and crosses those boundaries." - Investopedia.com RSI Mirrors and Reflections is a robust technique using multiple RSI periods, mirrors and reflections based o
FCK Hedging AI
Patel Hitendrakumar Mahendrabhai
No Grid, No Martingale, No Scalping, No News Headaches. Recommendations for Gold (XAUUSD), BTC, US30, GBPUSD, EURUSD and other volatility pairs. Message me for set file and demo file ,  FCK Hedging AI is the advanced Hedging system.   It was designed to exploit existing market inefficiencies. FCK Hedging AI  is an expert adviser that you can use to design and implement automated hedging strategies. The primary objective of a forex hedging strategy is to reduce or eliminate the impact of adverse
NO REPAINT ADVANCED CHART PATTERN INDICATOR By definition, a price ( chart)  pattern is a recognizable configuration of price movement that is identified using a series of  trendlines  and/or curves. When a price pattern signals a change in trend direction, it is known as a reversal pattern; a continuation pattern occurs when the trend continues in its existing direction following a brief pause. Advanced Chart Pattern Tracker is designed to find the MOST ACCURATE patterns. A special script is a
Projection Trend
Tatiana Savkevych
Projection Trend - a Forex arrow indicator without redrawing does not change its signals when the market situation changes, does not adjust to the chart. The signals given by him are unambiguous. Traders build a trading system that provides good signals 80-90% of the time. The indicator showing the points of entry and exit from the market with arrows is able to bring results not only in the Forex market, but also when working with binary options. You can buy it and install it in MetaTrader you
Trend and Lines
Oliver Hinrichs
This indicator draws lines at the open, close, high and low price of the last chart candle from the set timeframe. In addition, a label shows whether it was an up or down candle. The standard settings follow the original idea of ​​getting the price data from the daily timeframe for day trading/scalping, but since this indicator is fully customizable, you can also set a different timeframe. Based on the drawn price lines, you can then also display Fibonacci levels. This function can also be
Hello Guys! I want to share with you a very useful tools. Anyone of us who has used MT4 for some time knows how impractical this platform can be for discretionary trading. That's why I created this graphical interface!  Interface is very simple, all the info that you need are in the video and in the screenshot. NB: Before to run the EA Interface, remember to copy the file in the comment in your MT4 folder "Controls". PATH: .../MQL4/INCLUDE/CONTROLS NB: unfortunately the interface can't be test
Pattie Breakout ORB EA
Patrick Jeannot
4.75 (4)
Pattie Opening Range Breakout (ORB) is a range of price variation, which for each session, it generates a combination of support and resistance levels, positioning itself in favor of breaking out of the bands, when it is exceeded on the upside is a signal to buy or enter long and when it is exceeded on the downside it is a signal to sell or enter short. Pattie Break Out  EA  is a specialized trading tool designed to automate  time session-based breakouts . The EA operates by drawing a price rang
Signal Eskiya
Vitalii Zakharuk
Signal Eskiya, in addition to channel lines, reflects entry signals in the form of arrows. Trading strategies using the channel indicator belong to the classic methods of technical analysis, are easy to execute, and therefore available even to beginners. Price ranges work equally well on any trading assets and timeframes, they can be used both independently and with additional confirmation from oscillators and market volumes. American traders say: “Trend is your friend”, which means “Trend is
The indicator scans for TD Sequential signals in multiple timeframes for the all markets filtered and shows the results on Dashboard. Key Features Dashboard can be used for all markets It can scan for signals on MN1, W1, D1, H4, H1, M30, M15 ,M5, M1 timeframes Parameters UseMarketWatch: Set true to copy all symbols available in market watch MarketWatchCount : Set the number of symbols that you want to copy from the market watch list. CustomSymbols: Enter the custom symbols that you want to be a
Dear Trader It is my pleasure to introduce to you my tool called the " Forex Sniper Indicator" . The major aim of this tool is to help serious traders and investors in all type of Financial Markets to catch price next movement right at the moment the price direction is about to change. This tool can be used to snipe the price direction in both down trend, uptrend and ranging markets. This tool can be used as the stand alone tool though it may be combined with other tools as well. My goal is to h
Hello Seasonal Traders! The seasonality trading strategy works because the smart money is doing the same thing every single year more often than not. The month of the year or the day of the week and the time of the day can call the shots in any market.   The seasonal cycle is another useful tool in your trading arsenal. I'm not saying to trade solely off of seasonality and forget anything else. I'm only giving you another trading tool that you can incorporate into your own trading strategy to ga
This is based on Demark's TD Sequential and TD Combo set of indicators. It mostly has the TD Sequential features. It contains the Arrows Indicator showing Buy/Sell signals and the scanner dashboard. Both are for MT4 (Metatrader 4) Platform. Read in detail in this blog post. And get extra indicators here: https://www.mql5.com/en/blogs/post/749596 and commentary about signals and how to wait for right time: https://www.mql5.com/en/blogs/post/759157 Feature List: - Set TD Setup (9), Countdown (13
MQL5 博客: https://www.mql5.com/en/blogs/post/768823 MT4 版本: https://www.mql5.com/en/market/product/171247 MT5 版本: https://www.mql5.com/en/market/product/171248 斐波那契投影 [tambangEA] 是一款专业的仪表盘式交易分析工具,旨在帮助交易者直接在图表上识别市场结构、斐波那契投影目标、成交量反应区和方向延续区域。 该工具可自动检测最新的波动结构,构建基于斐波那契的投影水平,突出显示控制点区域,并显示斐波那契带的增量信息。它专为希望以清晰、结构化和可视化的方式解读市场走势,而无需手动绘制每个斐波那契投影的交易者而设计。 此工具的创建原因 许多交易者会手动使用斐波那契水平线,但手动预测可能速度较慢、结果不稳定且主观性较强。 此工具通过自动显示以下内容来简化流程: 最新的波动结构 斐波那契回撤和预测水平线 0.618 区域的 C 点预测 T1、T2 和 T3 目标区域 POC 和成交量分布区域 基于斐波那
本指标是实践实战交易完善的波浪自动分析的指标 !  案例... 注: 波浪分级用西方叫法不习惯,因受到缠论(缠中说禅)命名方式习惯的影响,我是将基础波浪命名为 笔 ,将二级波段命名为 段 ,同时具有趋势方向的段命名为 主趋段 (以后笔记中都是这种命名方式,先告知大家),但是算法上和缠论关系不大切勿混淆.反映的是本人分析盘面总结的 千变万化纷繁复杂的运行规律 . 对波段进行了标准化定义,不再是不同人不同的浪  ,    对人为干扰的画法进行了排除,在严格分析进场起到了关键的作用 . 使用这个指标,等于将交易界面提升美感,抛弃最原始的K线交易带你进入新的交易层次.如果不是为了交易,在宣传上也将使客户观感提升层次. 指标内容: 1. 基础波浪 (笔) : 首先我们找出了价格波动过程中的基础波动拐点,当然他的有序性低,为下一步的计算提供基础. 2. 二级波段( 段 ) :在基础波浪的基础上,通过算法分析得到层级更明显的二级波段,二级波段为波浪提供了分析基础 3. 波浪( 浪 ): 有着更清晰的趋势,更清晰直观的方向.分析一个波浪是否延续,需要看二级波段的形态,分析二级的构成,可以得出波浪
Up down v8
Guner Koca
Up down v8 indicator is no repaint counter trend indicator . it try to find market up down points. it works all timeframes and all pairs. suitable for beginner and experienced trader. there is wave and c values to set defaults. minimum processed value cnt can be equal to wave value. traders can change them suitable up down points on different time frames. indicator use moving averages  histograms and volatilty trigger. when red histogram is over volatility level that is tops. . when blue histogr
TD Combo Metatrader 4
Samil Bozuyuk
5 (1)
TD Combo is better when you have sharp directional moves, because it requires only thirteen price bars from start to finish compared to TD Sequential which needs at least 22 bars. The criteria for a Setup within TD Combo are the same with those required for a Setup within TD Sequential. The difference is that the count starts at bar 1 of the setup and not from bar 9 and TD Combo requires four conditions to be satisfied simultaneously. Requirements for a TD Combo Buy Countdown - Close lower or
This is a simple and efficient indicator based on market logic. The indicator creates a range chosen by a trader. Trader selects only two parameters. The first one is the number of candles that define the frame. The second one is the number of candles needed for confirmation frame. The indicator shows all situations in history and works with the actual movement of the market. The indicator works on all timeframes . You are not limited by use of different timeframes, the indicator is able to adap
该产品的买家也购买
Gann Made Easy
Oleg Rodin
4.84 (165)
Gann Made Easy 是一个专业且易于使用的外汇交易系统,它基于使用先生理论的最佳交易原则。 W.D.江恩。该指标提供准确的买入和卖出信号,包括止损和获利水平。您甚至可以使用推送通知在旅途中进行交易。 购买后请联系我,即可免费获得交易指导和超棒的额外指标! 您可能已经多次听说过江恩交易方法。通常 Gann 的理论不仅对于新手交易者而且对于那些已经有一定交易经验的人来说都是非常复杂的东西。这是因为江恩的交易方法在理论上并不那么容易应用。我花了几年时间来完善这些知识,并将最好的原则应用到我的外汇指标中。 该指标非常易于应用。您所需要的只是将其附加到您的图表并遵循简单的交易建议。该指标不断进行市场分析工作并寻找交易机会。当它检测到一个好的入口点时,它会为您提供一个箭头信号。该指标还显示止损和获利水平。 换句话说,当您像先生一样进行交易时,该指标会为您提供最佳江恩建议。江恩亲自告诉你此时此刻该做什么。但最好的部分是您不需要了解任何有关江恩交易原则的知识,因为该指标会为您完成整个市场分析工作。
Trend Catcher ind
Ramil Minniakhmetov
5 (3)
趨勢捕捉指標 趨勢捕捉指標結合了作者獨有的客製化自適應趨勢分析指標,用於分析市場價格趨勢。它透過過濾掉短期噪音,並專注於潛在的動能強度、波動性擴張和價格結構行為,來識別真實的市場方向。此外,它還結合了平滑和趨勢過濾等客製化指標,例如移動平均線、相對強弱指標 (RSI) 和波動率過濾器。 您可以在這裡查看實際運行情況以及我的其他產品: https://www.mql5.com/en/users/mechanic/seller 請注意,我不會在 Telegram 上出售 EA 或任何設置,那是騙局。所有設定都可以在我的部落格上免費取得。 重要提示!購買後請立即聯繫我,以獲取使用說明和額外獎勵! 請注意,我不會在 Telegram 上出售 EA 或任何設置,那是騙局。所有設定都可以在我的部落格上免費取得。
M1 Sniper
Oleg Rodin
5 (24)
M1 SNIPER 是一款易于使用的交易指标系统。它是一个专为 M1 时间框架设计的箭头指标。该指标可以作为独立的系统在 M1 时间框架下进行剥头皮交易,也可以作为您现有交易系统的一部分使用。虽然该交易系统专为 M1 时间框架交易而设计,但它也可以用于其他时间框架。我最初设计此方法是为了交易 XAUUSD 和 BTCUSD。但我发现这种方法在其他市场交易中也同样有用。 指标信号既可以顺势交易,也可以逆势交易。我教授一种特殊的交易技巧,帮助您利用指标信号进行双向交易。该方法基于使用特殊的动态支撑位和阻力位区域。 购买后,您可以立即下载 M1 SNIPER 箭头指标。此外,我还为所有 M1 SNIPER 工具用户免费提供下方屏幕截图所示的 Apollo Dynamic SR 指标!这两个指标的组合可以帮助您更轻松、更准确地利用 M1 时间框架进行交易。 购买后请联系我,免费获取交易提示和奖励指标! 祝您交易成功!
Dynamic Forex28 Navigator
Bernhard Schweigert
4.43 (7)
Dynamic Forex28 Navigator - 下一代外汇交易工具。 当前 49% 折扣。 Dynamic Forex28 Navigator 是我们长期流行的指标的演变,将三种功能合二为一: 高级货币强度 28 指标 (695 条评论)+ 高级货币 IMPULSE 带警报 (520 条评论)+ CS28 组合信号(奖励)。 有关指标的详细信息 https://www.mql5.com/en/blogs/post/758844 下一代强度指标提供什么? 您喜欢的原始指标的一切,现在通过新功能和更高的精度进行了增强。 主要特点: 专有货币强度公式。  所有时间范围内的平滑和准确的强度线。 非常适合识别趋势和精确进入。 动态市场斐波那契水平(市场斐波那契)。  此指标独有的独特功能。 斐波那契应用于货币强度,而不是价格图表。 适应实时市场活动以获得准确的反转区域。 实时市场动量。  第 9 行显示市场是活跃还是被动。 对于定时交易至关重要。 全面的警报和显示。  每种货币最强的买入和卖出动量。 ​​28 对的双重动量买入和卖出。 超买/超卖警告外部范围和止损。 反转
MetaBands M4
Vahidreza Heidar Gholami
3.5 (6)
MetaBands使用强大且独特的算法绘制通道并检测趋势,以便为交易者提供进出交易的潜在点。它是一个通道指标和强大的趋势指标。它包括不同类型的通道,可以通过使用输入参数简单地合并以创建新通道。MetaBands使用所有类型的警报通知用户市场事件。 功能 支持大多数通道算法 强大的趋势检测算法 能够合并不同类型的通道 多时间帧和多货币(信号矩阵) 所有类型的警报功能(声音、屏幕闪烁、推送通知、电子邮件、弹出窗口、箭头) 它永远不会重绘 趋势检测 MetaBands使用在通道内振荡的蓝色线来检测趋势。当该线遇到通道的上界时,表明开始下跌趋势,当它遇到下界时,表明开始上涨趋势。如果蓝线接近中线,则市场处于整理期。 该指标使用独特的方法来检测趋势。一开始可能看起来有些复杂,但如果您观看视频教程,您就会意识到它是多么强大且易于使用。 入场和出场信号 当趋势变化或价格穿过上下通道时,MetaBands会立即通过不同的方法提醒交易者,这些方法可以在指标设置中启用。 信号矩阵 要监视来自不同时间框架的多个符号并在一个地方查看信号,请单击右上角按钮或按键盘上的M键以打开信号矩阵。该矩阵可以快速概览
Scalper Inside PRO
Alexey Minkov
4.68 (69)
Scalper Inside PRO Scalper Inside PRO 是一款日内趋势与剥头皮指标,采用独家的内置算法来评估市场方向和关键目标位。该指标会自动计算进场点、出场点以及多个止盈目标位,并显示详细的绩效统计数据,让您能够看到不同品种和策略在历史数据上的表现。这有助于您选择符合当前市场状况的交易品种。您还可以将自己的箭头指标连接到 Scalper Inside PRO,并快速查看它们的统计数据和历史信号。 Scalper Inside PRO 使用手册及参数说明: 点击阅读 该指标适用于任何品种和时间周期(日内交易推荐使用 M5),并包含多种内置策略。它既可作为独立的剥头皮工具使用,也可作为您交易系统的分析组件。 主要功能 基于独家的新一代趋势检测算法 Next-Generation Trend Detection Algorithm (NG TDA) 进行趋势识别。 自动计算进场点和出场点,并提供多级止盈目标(TP1、TP2、TP3)。 三种内置策略和一个优化器,用于将信号适配到当前品种和时间周期(仅在实时模式下可用)。 提供品种和策略在历史数据上的详细绩效统计。 提
Advanced Supply Demand
Bernhard Schweigert
4.91 (300)
现在优惠 30%! 任何新手或专业交易者的最佳解决方案! 该指标是一款独特、高质量、且价格合理的交易工具,因为我们已经整合了许多专有功能和新公式。 依据此更新,您将能够显示双重时间帧区域。 您不仅可以显示一个较高的时间帧,还可以同时显示图表时间帧,加上更高的时间帧:显示嵌套时区。 供需双方所有交易者都会喜欢它。 :) 重要信息披露 高级供需的最大潜力,请访问 https://www.mql5.com/zh/blogs/post/720245   想象您的交易如何得以改善,是因为您能够精准定位入场或目标位吗? 构建于新的底层算法,它可以更轻松地识别出买卖双方之间的潜在失衡。 这是因为它以图形方式展示供需最强劲区域,及其过去的表现(显示旧区域)。 这些功能旨在帮助您更轻松地发现最佳入场区域和价位。 现在您可以针对您的交易品种和时间帧来优化和编辑区域强度! 高级供需指标适用于所有产品和时间帧。 它是一个新的公式,非常新的功能是两个区域强度函数可由用户输入进行调整! 这在交易中是一大优势。 当您学习如何使用专有功能,例如带有价格游离最小 X 因子的区域强度时,您能够判断该区域强劲与否。 供需
Gann 方块指标是一种强大的市场分析工具,基于 W.D. Gann 在其“市场预测数学公式”一文中介绍的数学概念。该指标融合了与平方数(如 144、90 和 52)有关的 Gann 技术,以及平方 9。此外,它还融入了  关于如何将平方 9 与通道和星形图案结合使用的方法。 用户手册和使用方式: 在使用该指标之前,我们建议您阅读用户手册,并与我们联系以获得任何澄清。您可以在我们的网站上找到完整的用户手册。 该指标提供了 MT5 的完整版本供购买,也提供了 MT4 的免费版本供测试。提供了两个版本的链接供您方便使用。 主要特点和功能: Gann 方块指标为您的交易环境提供了全套工具,使您能够基于几何图案和 Gann 的概念做出明智的决策。以下是主要特点: 平方 9 分析: 该指标可以绘制与平方 9 有关的各种元素,包括水平线、星形图案、网格、Gann 扇形等。这在您的图表上提供了 Gann 的几何概念的视觉表示。 Gann 方块: 该指标绘制了 Gann 方块 52、90 和 144,使您能够可视化和分析它们与价格走势的关系。 自由 Gann 星形图案: 该指标使您能够直接在图表上绘制
Breakout Arrows Mt4
Michael Oko Oboh
5 (1)
Trend Breakout Arrows Indicator The Trend Breakout Arrows Indicator is a momentum-based signal tool designed to identify potential bullish and bearish breakout opportunities. It displays clear arrow signals directly on the price chart, helping traders quickly recognize possible trend changes and continuation setups. Up Arrow (Buy Signal) A magenta up arrow appears below a candle when bullish momentum begins to strengthen. This signal indicates that buying pressure may be overtaking selling press
Neo Wave PRO
Nikolay Raykov
5 (1)
Price & Time Market Structure Indicator A professional market structure tool that analyzes waves through both price and time — not price alone. Main Description NeoWave PRO is a professional market structure indicator for MetaTrader 4 designed for traders who want to move beyond traditional one-dimensional wave tools such as ZigZag, swing indicators, and basic high/low systems. Most wave indicators analyze only one thing: Price. But a real market wave is not only a price movement. A true wave de
本产品已针对 2026 年市场进行更新,并针对最新 MT5 版本进行了优化。 价格更新通知: Smart Trend Trading System 目前价格为 $99 。 接下来的 30 次购买 后,价格将上涨至 $199 。 特别优惠: 购买 Smart Trend Trading System 后,请发送私信给我,即可免费领取 Smart Universal EA ,并将您的 Smart Trend 信号转换为自动交易。 Smart Trend Trading System 是一套完整的交易系统,具备不重绘、不回绘、不延迟的特点,专为希望获得更清晰信号、更准确趋势方向以及更有组织交易方式的交易者打造。 Online course , manual and download presets . 它将 10 多种交易工具 整合到一个系统中,包括趋势检测、反转区域、Smart Cloud、移动止损逻辑、支撑与阻力、K线着色、提醒以及多周期分析。 该系统旨在帮助您应对不同的市场环境: 趋势市场: 识别主要趋势,发现回调,跟随动能,并通过止损指导和移动止损选项寻找更清晰的入场机会。 震荡
BTMM State Engine Pro MT4
Garry James Goodchild
BTMM State Engine Pro is a MetaTrader 4 indicator for traders who use the Beat The Market Maker approach: Asian session context, kill zone timing, level progression, peak formation detection, and a multi-pair scanner from a single chart. It combines cycle state logic with a built-in scanner dashboard so you do not need the same tool on many charts at once. What it does Draws the Asian session range; session times can follow broker server offset or be set in inputs. Tracks level progression (L
IQ FX Gann Levels
INTRAQUOTES
5 (2)
IQ FX Gann Levels a precision trading indicator based on W.D. Gann’s square root methods . It plots real-time, non-repainting support and resistance levels to help traders confidently spot intraday and scalping opportunities with high accuracy. William Delbert Gann (W.D. Gann) was an exceptional market analyst, whose trading technique was based on a complex blend of mathematics, geometry, astrology, and ancient mathematics which proved to be extremely accurate. Setup & Guide:  Download  MT5 Ver
PRO Renko System
Oleg Rodin
5 (30)
PRO Renko Arrow Based System for trading renko charts.  准确的信号交易任何外汇工具. 另外,我将免费提供系统的附加模块! PRO Renko系统是RENKO图表上高度准确的交易系统。该系统是通用的。 该交易系统可应用于各种交易工具。 该系统有效地中和了所谓的市场噪音,打开了获得准确反转信号的通道。 该指标易于使用,只有一个参数负责产生信号。 您可以很容易地使算法适应您感兴趣的交易工具和renko酒吧的大小。 我很乐意通过提供任何咨询支持来帮助所有客户有效地使用该指标。 祝您交易成功!购买后,立即写信给我! 我将与您分享我的建议和我的renko发电机。 另外,我将免费提供系统的附加模块!
GOLD Impulse with Alert
Bernhard Schweigert
4.67 (12)
这个指标是我们2个产品 Advanced Currency IMPULSE with ALERT  +   Currency Strength Exotics 的一个超级组合。 它适用于所有时间框架,并以图形方式显示8种主要货币和一种符号的强势或弱势冲动! 该指标专门用于显示任何符号的货币强度加速,如黄金、异国货币对、商品、指数或期货。这是它的第一个指标,任何符号都可以被添加到第9行,以显示黄金、白银、石油、DAX、US30、MXN、TRY、CNH等的真实货币强度加速(冲动或速度)。 建立在新的基础算法上,它使识别和确认潜在的交易更加容易。这是因为它以图形方式显示了一种货币的强势或弱势是否正在加速,并测量了这种加速的速度--把它想象成你汽车中的速度表。当你加速时,事情显然会发生得更快,这在外汇市场上也是一样的,即如果你配对的货币正在向相反的方向加速,你就会发现一个潜在的有利可图的交易。 动态市场斐波那契28水平被用作警报触发器,将适应市场活动。如果冲动击中黄色触发线,你将收到警报。然后你就知道作为一个交易员应该做什么。货币对和方向已经给出。只需点击警报按钮,就可以切换到该货
Enigmera
Ivan Stefanov
5 (8)
ENIGMERA: 市场的核心 重要提示:MQL5.com 演示版本在策略测试器中运行,可能无法完全反映 Enigmera 的功能。请查看描述、截图和视频了解详细信息。如有任何问题,请随时联系我! 该指标的代码已完全重写。版本 3.0 增加了新功能并修复了自指标发布以来积累的错误。 简介 这个指标和交易系统是金融市场的一种独特方法。ENIGMERA 使用分形周期来精确计算支撑和阻力水平。它展示了真实的积累阶段,并提供了方向和目标。无论是在趋势中还是在修正中,这个系统都能工作。 它是如何工作的 指标的大部分功能通过图表左侧的按钮控制,使得能够快速响应不同的市场情况。 按钮 ON/OFF – 显示或隐藏整个指标。 Channel – 激活支撑通道,显示可接受的偏差范围。 Dev1 (第一偏差) – 指示价格在支撑偏差内的波动,信号表示市场正在整合或积累力量。 Dev2 (第二偏差) – 显示价格在偏差之间的波动,表示趋势形成和方向。 Dev3 (第三偏差) – 表示趋势的显著加速和高波动性。 45deg (45度) – 显示市场的节奏和相对于 45 度线的运动稳定性。 Tgt1/2
Harmonic Pattern Plus MT4
Young Ho Seo
4.44 (18)
Introduction Harmonic Patterns are best used to predict potential turning point. Traditionally, Harmonic Pattern was identified manually connecting peaks and troughs points in the chart. Manual harmonic pattern detection is painfully tedious and not suitable for everyone. You are often exposed under subjective pattern identification with manual pattern detection. To avoid these limitations, Harmonic Pattern Plus was designed to automate your harmonic pattern detection process. The functionality
Current event:  https://c.mql5.com/1/326/A2SR2025_NoMusic.gif A. 什么是 A2SR ?   * 这是一个领先的技术指标(没有重绘,没有滞后)。  -  指导 : -- 在  https://www.mql5.com/en/blogs/post/734748/page4#comment_16532516 -- 和  https://www.mql5.com/en/users/yohana/blog A2SR 在确定支撑(需求)和阻力(供应)水平方面有一种特殊的技术。 与我们在网上看到的普通方式不同,A2SR 在确定实际 SR 级别时有一个独创的概念。 原技术不是从网上拿来的,也没有在网上公开过。 A2SR 将根据您的交易风格自动选择 SR 级别。 即使您正在更改时间范围,但 SR 级别仍将保留在其位置上。 因为实际的 SR 不是从你使用的时间范围内获得的。 A2SR 拥有完整的交易工具 。 实际支持(需求)和阻力(供应)的真正概念。 新闻事件和央行讲话的市场情绪。 新闻事件和趋势的主要货币强度 (MCS) 的真正概念
Day Trader Master
Oleg Rodin
5 (15)
Day Trader Master 是一个完整的日间交易者交易系统。该系统由两个指标组成。一个指标是买入和卖出的箭头信号。这是你得到的箭头指示器。我将免费为您提供第二个指标。第二个指标是专门设计用于与这些箭头结合使用的趋势指标。 指标不重复也不迟到! 使用这个系统非常简单。您只需按照当前趋势方向的箭头信号,显示为双色线。蓝色是买入趋势。红色是一种销售趋势。蓝色箭头是买入信号。红色箭头是卖出信号。您需要箭头的颜色和信号的方向来匹配趋势线的颜色。 箭头指标主要是为 M5 和 M15 时间间隔的日内交易而创建的。但从技术上讲,该系统可以用于其他时间间隔。 指示器配备带有推送消息功能的弹出警报。 购买后一定要写信给我!我将为您提供与系统交易的个人建议,以及我的趋势指标。此外,还有丰厚的奖励等着您!
Market Structure Patterns MT4
Samuel Manoel De Souza
5 (18)
Market Structure Patterns   is an indicator based on   smart money concepts   that displays   SMC/ICT   elements that can take your trading decisions to the next level. Take advantage of the   alerts ,   push notifications   and   email messages   to keep informed from when an element is formed on the chart, the price crosses a level and/or enters in a box/zone. Developers can access the values of the elements of the indicator using the   global variables  what allows the automation of trading d
PZ ABCD Retracement
PZ TRADING SLU
4 (5)
该指标找到AB = CD回撤形态。 AB = CD回调模式是一种4点价格结构,其中初始价格区间被部分回调,然后与回调完成后等距移动,这是所有谐波模式的基本基础。 [ 安装指南 | 更新指南 | 故障排除 | 常见问题 | 所有产品 ] 可定制的图案尺寸 可定制的AC和BD比率 可定制的突破时间 可定制的线条,颜色和大小 它根据CD纤维水平显示SL和TP水平 视觉/声音/推送/邮件警报,用于模式和突破 AB = CD Retracements可以扩展和重新绘制很多内容。为了使事情变得更容易,该指标实施了一个转折:它在向交易发出信号之前等待正确方向的Donchian突破。最终结果是带有非常可靠的交易信号的重新粉刷指示器。输入donchian突破时段作为输入。 看涨回撤是蓝色的 空头回撤是红色的 请注意,价格模式(例如AB = CD)可以扩展,指标必须重新绘制以跟随该模式的扩展。如果图案重涂超出了参数中输入的AC / BD / AB = CD比率,则该图案将消失,因为它将不再有效。要交易这些模式,请求助于donchian突破信号。 输入参数 幅度:AB = CD模式的大小 突围
Trend Lines PRO
Roman Podpora
5 (1)
TREND LINES PRO 帮助您了解市场真正的方向转变点。该指标显示真实的趋势反转点以及主要参与者重新入场的时机。 您可以看到 BOS线、 趋势变化和更高时间框架的关键水平——无需复杂的设置或不必要的干扰。信号不会重绘,并在K线收盘后仍然保留在图表上。 VERSION MT 5    -   与……搭配使用时,可发挥其最大潜力   RFI LEVELS PRO 指示器 该指标显示的内容: 实际变化 趋势(BOS 线) 一旦信号出现,它就始终有效!这与会重绘的指标有着重要的区别,后者可能会发出信号后又改变信号,从而导致资金损失。现在,您可以更精准、更准确地进入市场。此外,还有一个功能,会在箭头出现后为K线着色,直到达到目标价位(止盈)或出现反转信号为止。 重复条目   以及主要玩家的充值 为了提高寻找入场点时的视觉清晰度,我们创建了一个模块,该模块首先显示买入/卖出区域,并在该区域内寻找最佳入场点。此外,我们还加入了智能逻辑来管理止损位,该逻辑会随着时间的推移逐步降低止损位的大小,从而降低入场交易时的初始风险(移动止损位)。 信号强度水平(BOS) 该指标采用三个显著性等级来衡量
The Propfolio Master Suite is the ultimate all-in-one analytical workstation for professional traders. Combining the power of the Beat The Market Maker (BTMM) methodology, Smart Money Concepts (SND/Liquidity), and Advanced Volume Profile, this suite replaces multiple different indicators with one optimized engine. Monitor up to 14 pairs simultaneously from a single chart, instantly identify market cycles, and seamlessly map institutional footprints with the click of a button. The Command Center
Legacy of Gann
Pavel Zamoshnikov
4.83 (12)
The indicator very accurately determines the levels of the possible end of the trend and profit fixing. The method of determining levels is based on the ideas of W.D.Gann, using an algorithm developed by his follower Kirill Borovsky. Extremely high reliability of reaching levels (according to K. Borovsky  - 80-90%) Indispensable for any trading strategy – every trader needs to determine the exit point from the market! Precisely determines targets on any timeframes and any instruments (forex, met
RFI levels PRO
Roman Podpora
5 (1)
该指标能够准确显示反转点和价格回落区域。     行业领军人物 。您能洞察新趋势的形成,并以最高的精准度做出决策,掌控每一笔交易。 与……结合时,展现其最大潜力     趋势线专业版   指标  VERSION MT5 该指标显示的内容: 新趋势开始时的反转结构和反转水平及其激活。 显示屏   获利了结   和   止损   风险回报比最低的水平     RR 1:2       。 具有智能减值逻辑的止损。 显示指定指标中两种趋势类型的反转形态。 指标: 根据     趋势线     (全球趋势变化) 潮流专业版     (趋势快速变化) 简单有效   扫描器   实时趋势(新增)。 多时间框架工具筛选。 展示   利润   在 LOGIC AI 信号之后。 以下列出今日走势积极的金融工具。(RB键) 能够为终端启用通知(警报)功能,并向移动设备推送通知。 逻辑人工智能     — 利用人工智能寻找最佳切入点。 只有在启用 MTF(多时间框架分析)模式时,该功能才可用。 兼容性。 当与趋势线指标结合使用时,该指标能发挥其最大潜力。 这     RFI LEVELS PRO    
Advanced Currency IMPULSE with ALERT
Bernhard Schweigert
4.9 (490)
目前40%的折扣!! 对任何新手或专家交易者来说都是最好的解决方案! 这个指标是一个独特的、高质量的、负担得起的交易工具,因为我们已经纳入了一些专有的功能和一个秘密的公式。只需一张图表,它就能给出所有28种货币对的警报。想象一下,你的交易将如何改善,因为你能够准确地确定新趋势或剥头皮机会的触发点 建立在新的基础算法上,它使识别和确认潜在交易变得更加容易。这是因为它以图形方式显示了一种货币的强势或弱势是否正在加速,并测量了这种加速的速度--把它想象成你汽车中的速度表。当你加速时,事情显然会发生得更快,这在外汇市场上也是一样的,即如果你配对的货币正在向相反的方向加速,你就会发现一个潜在的有利可图的交易。 货币动量的垂直线和箭头将指导你的交易! 动态的市场斐波那契23水平被用作警报触发器,将适应市场活动。如果冲动触及黄色触发线,您将在MetaTrader或您的电子邮件或推送警报中收到警报。然后你就知道作为一个交易员应该做什么。货币对和方向已经给出。只要点击警报按钮,就可以切换到该货币对或打开一个新的图表,以便进一步分析。警报级别可以通过用户输入来改变,可以选择3个敏感度级别。 尽
IQ FX Strength  answers the single most important question in trading: "Who is truly driving the market right now?" Designed with a stunning Hybrid UI, this tool separates true trend moves from market noise, allowing you to catch "Explosive" moves before the crowd sees them. System Requirement: For higher accurate signal and optimal, smoother performance of this indicator without any lag, a good CPU (with   RAM of  atleast 8GB or above) and fast internet connection is highly recommended. IQ FX
Block Master Pro
Stanislav Konin
5 (3)
The Block Master Pro indicator is designed to visually identify areas on the chart where significant volumes from major market participants are likely concentrated. These areas, known as order blocks, represent price ranges where large players place their orders, potentially signaling a price reversal and movement in the opposite direction. Key Features: Order Block Identification: Block Master Pro effectively identifies order blocks by pinpointing price ranges where large orders are placed. Th
FX Volume
Daniel Stein
4.63 (38)
FX Volume:从经纪商视角洞察真实市场情绪 简要概述 想要提升您的交易策略? FX Volume 可提供零售交易者和经纪商的持仓实时数据——远早于诸如 COT 之类的延迟报告。不论您希望获得持续稳定的收益,还是想在市场中多一分制胜的砝码, FX Volume 都能帮您识别重大失衡、确认突破以及完善风险管理。立即开启体验,让真实的成交量数据为您的交易决策带来革新! 1. 为什么 FX Volume 对交易者格外有用 极具准确度的早期预警 • 快速捕捉有多少交易者正在买入或卖出某个货币对——比大多数人提前一步。 • FX Volume 是 唯一 能够整合多家零售经纪商真实成交量数据并以简洁方式呈现的工具。 强力风险管理 • 及时识别多头或空头仓位的巨大不平衡,这往往预示着潜在的趋势反转,帮助您更自信地设置止损和目标位。 • 独家而真实的数据让每一次交易决策更具可靠性。 优化进场与出场点 • 发现“过度集中”的交易(大多数交易者都在同一方向),并通过真实成交量来确认突破。 • 避免依赖常见指标可能带来的误导信号,而是利用真实的实时成交量。 适配各种交易策略 • 将 FX
Delta Fusion Pro
Francesco Secchi
5 (2)
Delta Fusion Pro – 高级订单流分析,专为日内交易设计 Delta Fusion Pro 是一款专业的 MetaTrader 4 指标,能够揭示市场中的主动订单流,实时显示机构压力的强度和方向。与传统的成交量指标不同,它分析买盘(Ask)与卖盘(Bid)之间的成交量差值(Delta),用于提前预测反转、确认趋势并识别专业兴趣区域。 主要特点 智能自动调节系统 根据以下条件自动调整所有参数: 交易品种类型(外汇、加密货币、指数、大宗商品、股票) 操作周期 市场波动率(ATR) 最近平均成交量 无需手动配置,适合新手交易者——指标自动完成校准! 核心功能 净Delta与累计Delta 计算主动买盘/卖盘成交量差值,支持自定义 EMA 平滑 实时显示方向性压力 可自定义直方图颜色(买入/卖出) 价格/成交量背离 自动检测常规与隐藏背离 强度分类:强/中/弱 高级过滤:成交量确认、趋势、时间距离 图形信号(彩色箭头) 市场失衡 识别显著的买盘/卖盘比例失衡(可配置比率) 最小成交量阈值验证 图表显示彩色点(多头/空头) Infusion Volume 检测异常成交量峰值(
作者的更多信息
ClosureMaster Utility closes all orders and offers 7 additional modes. If you have dozens or even hundreds of orders and need to close them all or some of them selectively by comment, magic number, buy only, sell only, if Stop Loss is not set, only profitable or losing trades, then ClosureMaster Utility can take care of this task. External parameters: Close all Losing trades Close all Profitable trades Close all orders without Stop Loss Close Buy orders only Close Sell orders only Close by Magic
FREE
CandleTrend EA
Elvira Akhsanova
This Expert Advisor is based on previous candlestick's price direction. Seven modes of operation with option to reverse signal. Assuming that current trend can be identified by checking status of one recent candlestick I have added additional strategies: 2/2, 2/3, 3/3, 3/5, 4/5, 5/5 candlesticks. For "1/1 Candles (Mode 1)": if previous candlestick's base currency has increased in value in reference to quote currency (close price is higher than open price) - uptrend is presumed and buy order is p
UniFractal Trader
Elvira Akhsanova
UniFractal Trader is based on 5-modes proprietary 1-bar fractal algorithm in combination with Moving Average, signal filtering by VMeter indicator, Trailing Stop and option to reverse trade signal. Standard fractal indicator uses 2-bar verification process, which means that order cannot be sent until 3rd bar after fractal. Fractal algorithm of this expert allows to trade on 2nd bar away from fractal, which means entering each position 1 bar earlier before trend ends. This expert considers FIFO(
VMeter EA
Elvira Akhsanova
VMeter EA is Expert Advisor based on proprietary VMeter Indicator. Recommended Signal Settings: Sensor Range 35, Minimum Low-Level Bars 2 and Compare Price Dependencies 6 for optimal results on M5 or H1 on any pair. Order Settings (Take Profit, Stop Loss and Slippage are set in pips: 1 pip=10 points=0.00010): TakeProfit - Take Profit in pips StopLoss - Stop Loss in pips Lot - Lot Size Slippage - Order Slippage in pips Magic - Magic Number Order_Comment - Order's comment Signal Settings by VMet
筛选:
Quantum Trader
3015
Quantum Trader 2022.04.15 11:46 
 

用户没有留下任何评级信息

Elvira Akhsanova
1350
来自开发人员的回复 Elvira Akhsanova 2022.06.01 09:04
Thank you!
回复评论