Candle Pattern Finder
- 指标
- 版本: 2.4
- 更新: 20 十一月 2021
- 激活: 20

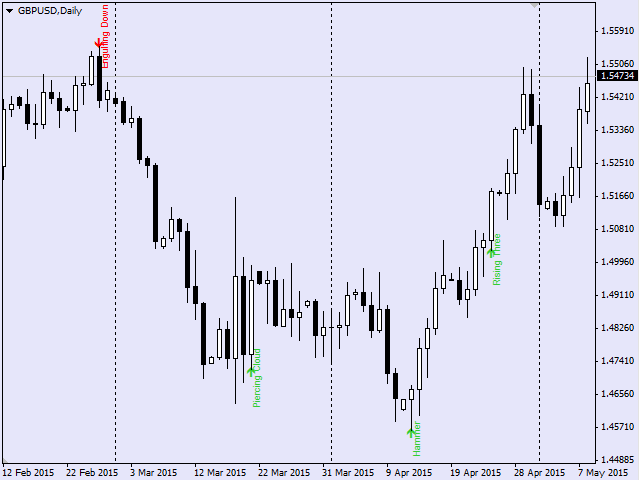
The indicator finds candlestick patterns based on Gregory L.' Morris "Candlestick Charting Explained: Timeless Techniques for Trading Stocks and Futures".
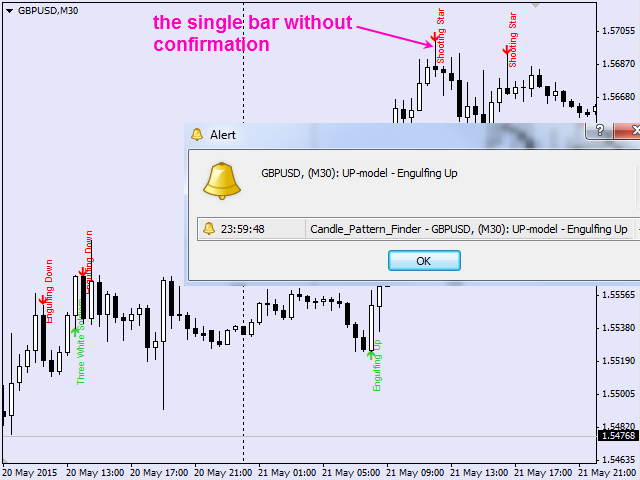
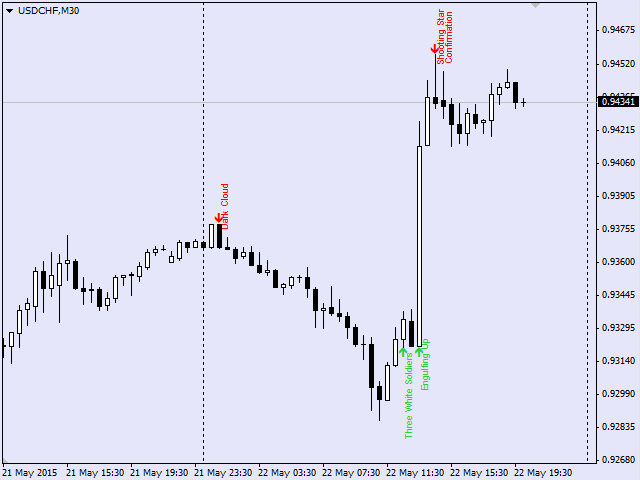
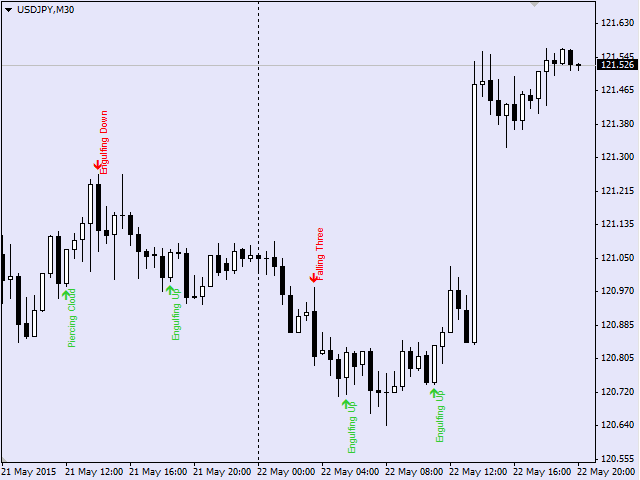
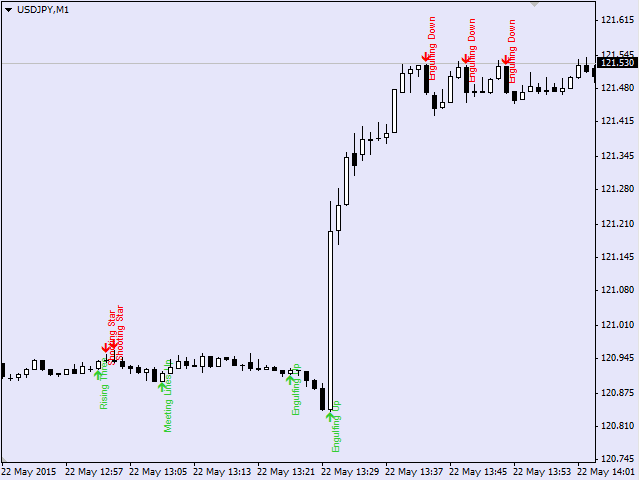
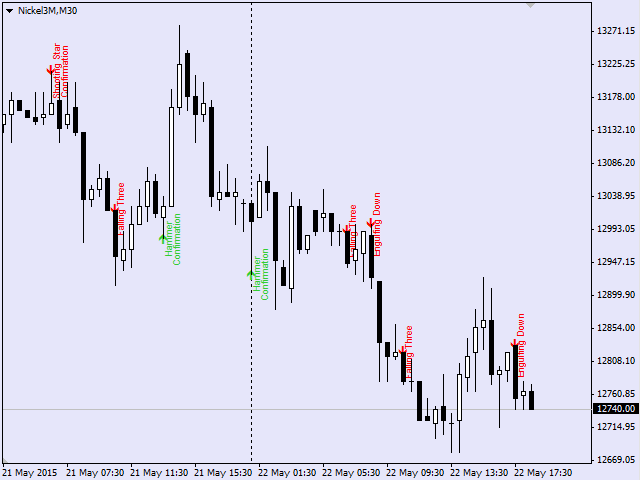
If a pattern is detected, the indicator displays a message at a bar closure.
If you trade using the MetaTrader 5 terminal, then you can download the full analogue of the "Candle Pattern Finder for MT5" indicator
It recognizes the following patterns: Bullish/Bearish (possible settings in brackets):
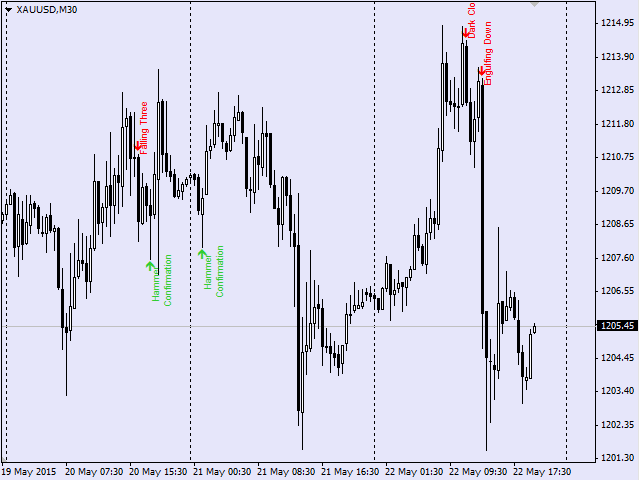
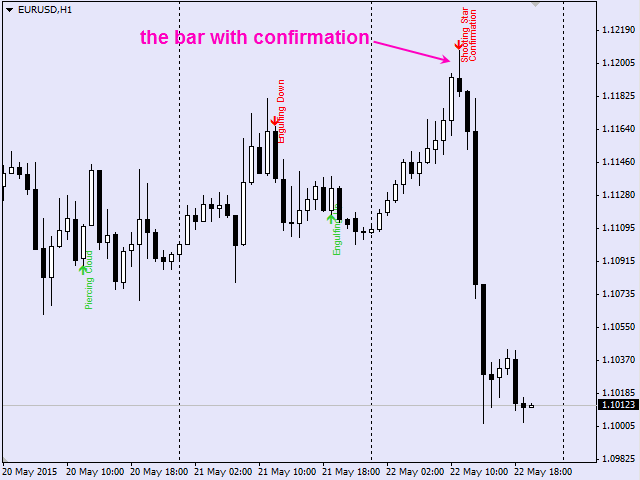
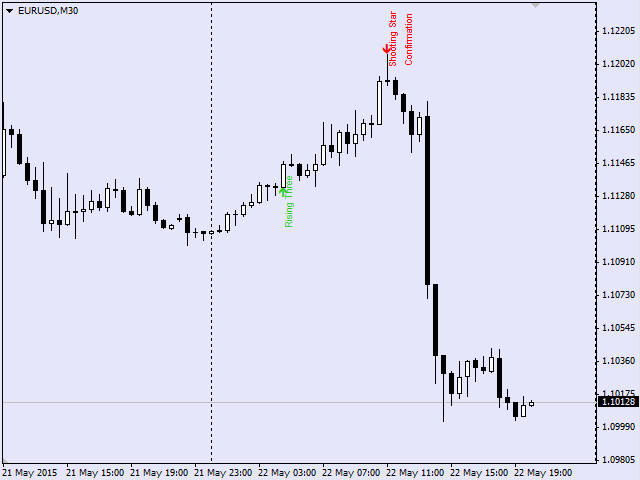
- Hammer / Shooting Star (with or without confirmation*)
- Inverted Hammer / Hanging Man(with or without confirmation*)
- OutSide Bar
- Engulfing (high or low sensibility**)
- Piercing Line / Dark Cloud Cover (high or low sensibility**)
- Three White Soldiers / Identical Three Crows (high or low sensibility**)
- Morning Star / Evening Star
- Rising Three Methods / Falling Three Methods
- Marubozu (including Closing/Opening Marubozu)
- Meeting Lines
- Harami, including Harami Cross
- Doji, including Evening/Morning Doji Star
- Thrusting Line
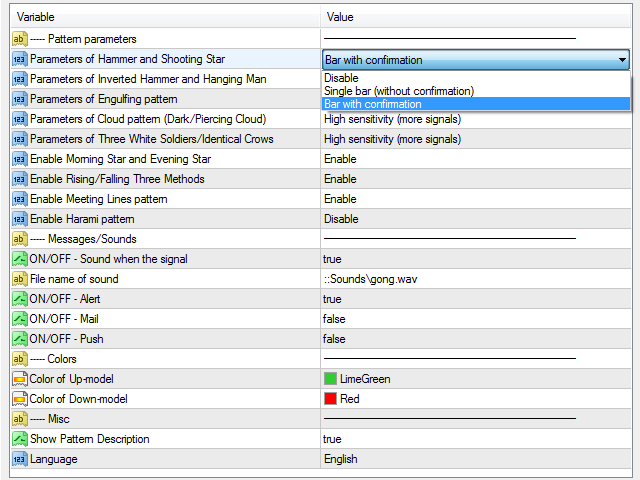
* - "Without confirmation" - a signal occurs straight at the closure of the bar that forms the candlestick pattern. "With confirmation" - the indicator waits for the next (confirming) bar closure.
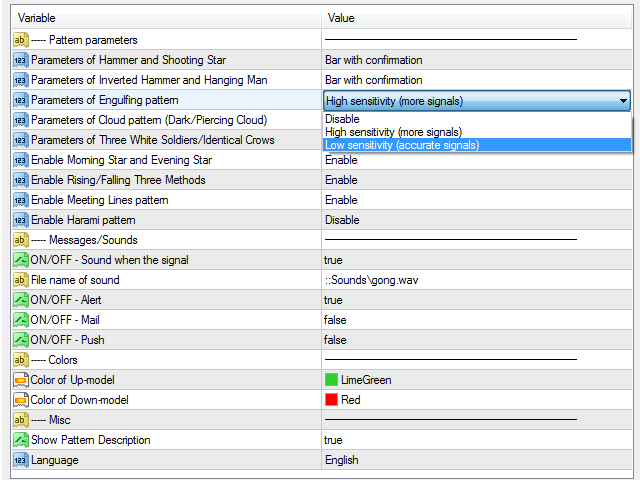
** - "Low sensibility" - the pattern is recognized in strict conformity with the description from the book by Gregory L. Morris. "High sensibility" - uses additional criteria that take into account a variety of pattern options in the Forex market, which are not used on the stock market. This has increased the number of correct signals without increasing the number of false ones.
Features:
- The indicator implements virtually all candlestick patterns available for Forex from the book by G. Morris.
- The indicator is not tied to the size and shape of candlesticks, since it uses the intellectual recognition technique, which is similar to human perception - patterns are recognized so as a human eye would visually recognize them.
- You can choose to recognize separate candlestick patterns. Flexible settings for each pattern.
- Three languages are supported: English, Russian and Portuguese (the Language parameter). You can also add names of the candlestick patterns in your mother tongue (send me a private message).
- Sound and text notifications of pattern formation. Emails and push notifications to mobile devices (parameters ON/OFF-Mail and ON/OFF-Push).
If you want to scan candlestick patterns for all instruments and timeframes at once, then pay attention to the "Candle Pattern Dashboard for MT4" indicator
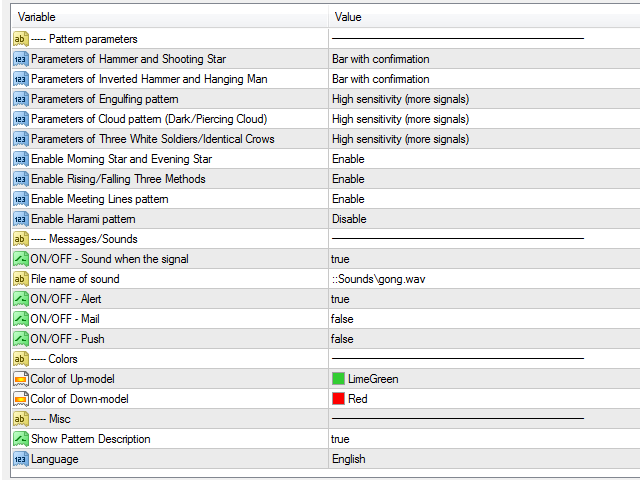
Parameters:
Parameters of candlestick patterns
- Parameters of Hammer and Shooting Star (Disable / Single bar (without confirmation) / Bar with confirmation)
- Parameters of Inverted Hammer and Hanging Man (Disable / Single bar (without confirmation) / Bar with confirmation)
- Enable OutSide Bar pattern (Disable / Enable)
- Parameters of Engulfing pattern (Disable / High sensitivity / Low sensitivity)
- Parameters of Cloud pattern (Dark/Piercing Cloud) (Disable / High sensitivity / Low sensitivity)
- Parameters of Three White Soldiers/Identical Crows (Disable / High sensitivity / Low sensitivity)
- Enable Morning Star and Evening Star (Disable / Enable)
- Enable Rising/Falling Three Methods (Disable / Enable)
- Enable Marubozu (including Closing/Opening Marubozu) (Disable / Enable)
- Enable Meeting Lines pattern (Disable / Enable)
- Enable Harami pattern (Disable / Harami shadows can walk out of shadows of a prev.candle / Harami shadows can not go beyond the shadow of the prev.candle)
- Doji patterns (Disable / Single Doji candle (without confirmation) / Doji candle with confirmation (is Morning/Evening Doji Star)
- Thrusting Line
Alerts, E-mail, Push-messages
Color Settings
Other Settings
- Show Pattern Description – show/hide pattern descriptions
- Language – English or Russian
You can test the functionality of the program by downloading the test version from the Comments tab


I have enjoyed this for a while now. It is very neat on my chart, all patterns are included with some detail and fully customisable. My one gripe was its covered the whole chart’s history but this has now been fixed with the bars back update. So i can give this a perfect 5 stars.