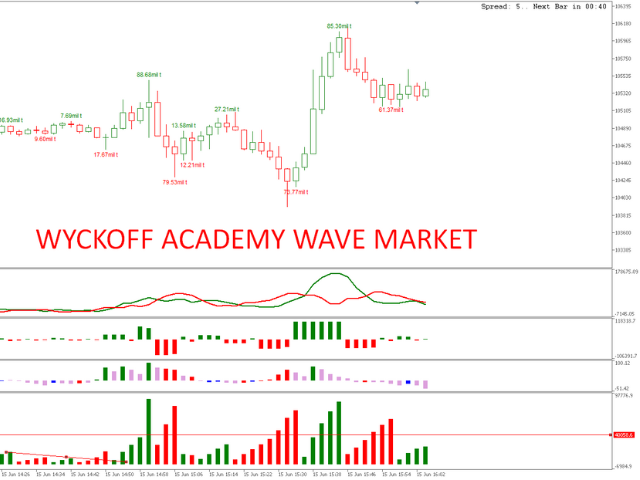
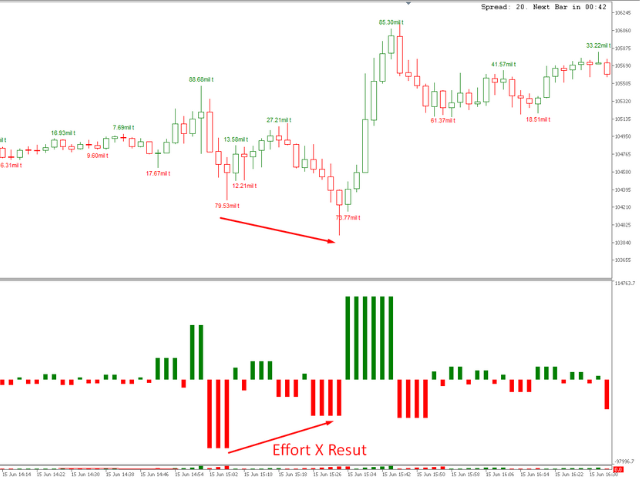
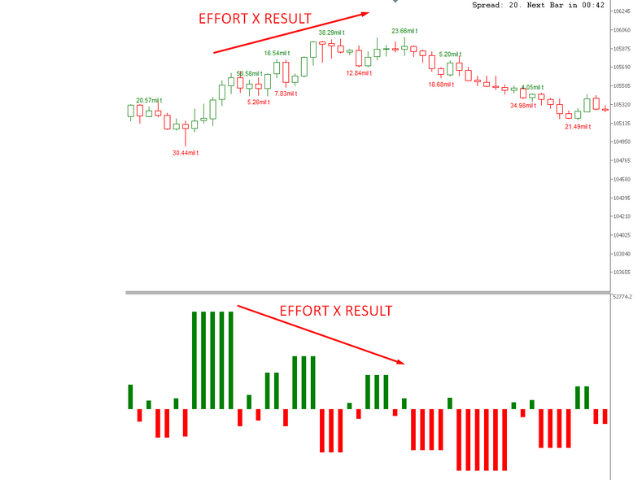
WAPV Box Effort x Result
- 指标
- 版本: 1.0
- 激活: 5

WA_PV_BOX_EFFORT X MT5 的结果 WAPV Box Effort x Result Indicator 是 Package Indicators 组(Wyckoff Academy Wave Market)的一部分。 MT5 的 WAPV Box Effort x Result Indicator 可帮助您阅读价格和交易量。它的阅读包括协助识别努力x结果 在图表创建的波浪中。 当方框为绿色时,MT5 的 WAPV Box Effort x Result Indicator 表示交易量有利于需求,而当方框为红色时 量有利于供应。 方框越大,成交量相对于价格的位移越大。如果价格的上升波与 Box 的大小不成比例,则 努力x结果。 以一种非常直观的方式,我们可以识别出数量和价格之间的这种差异。 MT5 的 WAPV Box Effort x Result Indicator 还允许您通过将指标置于零轴下方来改善可视化。 以即时交易量和实际交易量在市场上运作 看图片: