Force and Weakness Trading

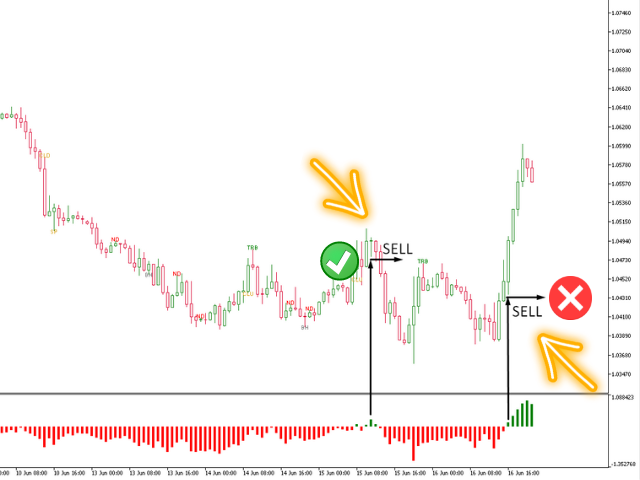
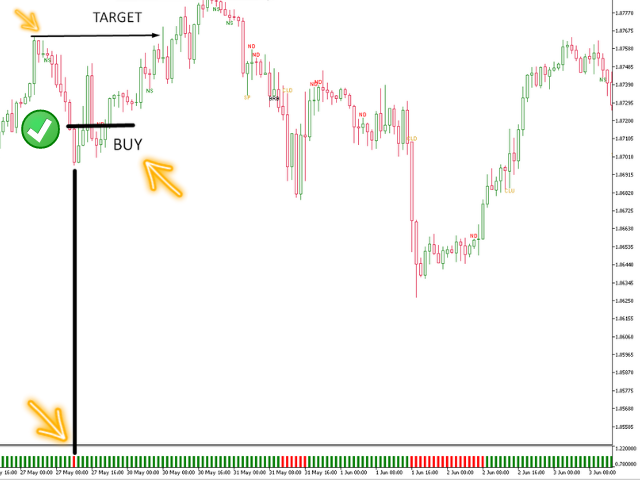
The Force and Weakness Indicator for MT5 Forex is part of the (Wyckoff Academy Price and Volume) Toolkit The Force and Weakness Indicator for MT5 Forex was developed to identify the Strength and Weakness of volume in an accumulated way. Enabling the vision of a panorama between price and volume. The Indicator can be used as an oscillator and as a histogram. As usual it has all the premises of R. Wyckoff's three laws when put together with the price: Cause and Effect, Effort x Result and Supply and Demand.
推荐产品
Chart Patterns full
Mohamed Amr Mohamed Osama Abdelwahab
Chart Patterns in Depth — 专业图表形态检测指标 本指标自动检测、绘制并管理专业价格行为交易者使用的16种经典图表形态:对称三角形、上升三角形、下降三角形、头肩顶及头肩底、杯柄形态及反向杯柄、下降楔形、上升楔形、看涨矩形、看跌矩形、旗形、三角旗形、双顶/双底、三顶/三底。 核心功能 • 确认后提供完整交易设置:入场(买入/卖出)、止盈以及两个止损位直接绘制在图表上,并显示点数距离和盈亏比。 • 结构性止损,配有经过校准的安全缓冲(目标测量值的7% / 14% / 21%),根据每个形态的内部结构分别设定。 • 入场纪律:只有当突破K线之后的下一根K线收盘于边界之外时才发出信号——自动过滤假突破。 • "假设情景"引擎:虚线投影提前告诉您,如果价格上涨、横盘或下跌,将形成哪种形态,以及每种突破情景的预计目标位。一键开关。 • 交易持久化:设置确认后,其价位线将保留在图表上,直到止盈或止损真正触发——新形态不会抹去正在运行的交易计划。 • 冲突管理:可选择如何处理方向相反的信号(最新优先/最先优先/同时显示并警告)。 • 推荐模式(默认开启):仅交易持续形态,
Cycle Projection Pro is a cyclical analysis indicator for MetaTrader 5, designed for the Daily timeframe. It identifies and projects recurring price cycles forward in time, helping you estimate when — not how much — the market may be approaching a turning point. How it works The indicator sums six harmonic cycles with explicit periods — Weekly, Biweekly, Monthly, Quarterly, Semiannual, Annual — each independently adjustable and can be turned on or off. Their combination produces a composite wav
RBreaker
Zhong Long Wu
RBreaker Gold Indicators 是黄金期货一种短线日内交易策略,它结合了趋势跟踪和日内反转两种交易方式,既能捕捉趋势行情的利润,又能在行情反转时及时止盈并顺势反手。 该策略曾连续15年被美国《Futures Truth》杂志评选为前十大最赚钱的交易策略之一,具有很长的生命周期,至今仍在国内外普遍使用与研究。 本指标结合了2026年期货黄金的走势,依据14日ATR指标,分别定义了突破系数A,观察系数B,反转系数R更合理的数值,非常不错的指标,已实现年稳定盈利,值得推荐~ 以上指标适合高波动品种,参数适合期货黄金,股指期货等,如果需要其他品种行情,需要单独设定 突破系数A,观察系数B,反转系数R,进行回测才能使用。 欢迎指标售后有问题可以加+V:504282029
BTC Trend Scalper MT5 趋势捕捉版 — 针对 BTCUSD 的精准动量交易 大家好,交易者们! 我是   BTC Trend Scalper MT5   — 一个智能的比特币交易专家顾问,旨在通过纪律严明的风险管理捕捉动量行情。 我 不是 马丁格尔策略。 我 不是 网格系统。 我 不是 赌博机器人。 我是一个 趋势跟踪型 scalper ,专为那些明白保护资本比追逐每一根蜡烛更重要的交易者而设计。 我的专长是什么? 比特币 (BTCUSD) 我的使命是什么? 在严格控险的同时,捕捉高概率的方向性行情。 为什么叫“趋势捕捉”? 许多比特币 EA 试图预测顶部和底部。 许多 scalper 对市场的每一次波动都过度交易。 我采取不同的方法。 我等待。 我通过蜡烛结构识别动量,通过趋势分析确认方向,然后仅在市场条件一致时入场。 当动量出现时,我参与。 当动量消失时,我离开。 没有情绪。 没有犹豫。 我的三层智能系统 第一层:动量蜡烛识别 我的入场系统刻意简单而有效。 对于买入: 前一根蜡烛收盘看涨。 对于卖出: 前一根蜡烛收盘看跌。 如果启
Overview The Market Perspective Structure Indicator is a comprehensive MetaTrader indicator designed to provide traders with a detailed analysis of market structure across multiple timeframes. It identifies and visualizes key price action elements, including swing highs and lows, Break of Structure (BOS), Change of Character (CHOCH), internal structures, equal highs/lows, premium/discount levels, previous levels from higher timeframes, and trading session zones. With extensive customization opt
RVE Echo Indicator MT5 — Rejection Velocity Echo RVE Echo Indicator is a custom MetaTrader 5 technical indicator designed to detect abnormal price rejection, sharp velocity changes, and possible reversal zones in the market. RVE stands for Rejection Velocity Echo . The indicator studies how strongly price moves compared to its recent rejection behavior, then highlights moments where the current price movement appears unusually aggressive. This can help traders identify possible exhaustion, rejec
Swing Point Model
Minh Truong Pham
Introducing the Swing Point Model Indicator – A Professional Trading Tool The Swing Point Model Indicator is an innovative tool designed for traders who want to capture market structure and identify potential trading opportunities. With a logical and transparent approach, the Swing Point Model helps you gain deeper market insights and make precise trading decisions. This is multiple Timeframe indicator so you can choose Higher timeframe for detect Swing point model What Is the Swing Point Model?
IVISTscalp5
Vadym Zhukovskyi
5 (6)
[iVISTscalp5]:通过时间研究市场行为的实验室 TLV Framework | Liquidity Activation Points ⸻ 项目概述 iVISTscalp5 是在 VISTmany 项目框架下开发的多层级时间与价格结构指标。 该系统通过 Liquidity Activation Points(时间激活点 / timings)预测: 市场启动时间 方向 运动范围 iVISTscalp5 指标可使用默认参数应用于任何金融工具。 ⸻ 实际价值 iVISTscalp5 并不是作为传统技术指标而开发的。 它的核心理念是: 让任何人都能够通过“时间”研究市场行为。 ⸻ Time Language VISTmany (TLV) — 项目的核心概念 t(p) t(p) 是 timings 被激活的价格水平。 ⸻ p(p) p(p) 是 iVISTscalp5 指标构建的核心价格水平。 最强的市场反应通常出现在: t(p) 与 p(p) 相互作用时。 ⸻ 在 TLV(Time Language VIST
Liquidity Order Blocks MT5
Johan Adrian Nieto Resendiz
Liquidity Order Blocks MT5 Liquidity Order Blocks MT5 is a professional visual indicator for MetaTrader 5 designed to help traders identify and monitor potential bullish and bearish liquidity areas directly on the chart. The indicator detects pivot-based order block zones and displays each zone with a structured visual breakdown of estimated bullish volume, bearish volume, relative strength and delta. Its purpose is to make liquidity areas easier to read, compare and monitor during market analys
Fibonacci Sniper XAUUSD
Luis Paulo de Oliveira
GOLD FIBONACCI SNIPER M5 Description GOLD FIBONACCI SNIPER M5 is a professional MetaTrader 5 indicator specially developed for XAUUSD (Gold) on the M5 timeframe. The indicator uses Fibonacci retracements combined with trend analysis, volatility filters, candle rejection patterns, and market strength confirmation to identify high-probability entry opportunities. The system automatically detects retracement zones between the 38.2, 50, and 61.8 Fibonacci levels, which are commonly considered instit
Chỉ báo này sẽ thông báo cho bạn nếu cấu hình xu hướng thành công. Tín hiệu theo xu hướng không nên được tăng theo, nhưng tín hiệu mua ở mức giá thấp theo mô hình giao dịch thông thường của bạn, hoặc tín hiệu bán ở mức giá tốt, là một lựa chọn rất tốt. Hãy thiết lập nó trên khung thời gian lớn hơn và theo dõi các khung thời gian nhỏ hơn, bám sát các xu hướng chính. Tôi thường thiết lập ba khung thời gian gần nhau nhất và không bao giờ đi ngược tín hiệu của INdicator này. INdicator   này không có
NeuroCycle
Dmitriy Didenko
NeuroCycle is a self-learning indicator designed primarily for binary options and short-term scalping. The system automatically searches for suitable parameters of its built-in trading model for a selected market period. The main optimization principle is what I call the Rule of Three Variables: Time, Sample Size, and Probability. The idea is simple: Time The training period should be long enough for the market to pass through different conditions and regimes. Sample Size A sufficiently la
Fibonacci Trend Pro
Syamsurizal Dimjati
FIBONACCI TREND Pro Smart Market Structure + Multi-Timeframe SuperTrend Dashboard The   FiboSuper   indicator is an advanced trading system designed for MetaTrader 5 that blends three core methodologies of technical analysis:   Trend Following (EMA & SuperTrend) ,   Market Structure (ZigZag & Auto-Fibonacci) , and   Multi-Timeframe Confluence (Live Dashboard) . 1. On-Chart Components SuperTrend Line (Blue / Orange Dots): Blue Dots (Up Trend):   Indicates a   Bullish   market environment. Focus s
BosMaster
Evgenii Savinov
Title: BOS MASTER MT5 Description: BOS MASTER is a professional analytical tool based on the Smart Money Concepts (SMC) . The indicator automatically detects and marks Break of Structure (BOS) , helping traders identify changes in market direction and trend shifts with high precision. Key Features: Automatic BOS Detection: Scans the chart for key highs and lows and highlights the exact moment of a structure break. Interactive Filter Button: Switch directly on the chart between "Body Break" (cons
CosmiCLab FIBO
Kirils Subins
CosmiCLab SMC FIBO CosmiCLab SMC FIBO is a professional trading indicator designed for traders who use Smart Money Concepts (SMC), market structure analysis and Fibonacci retracement levels. The indicator automatically detects market swings and builds Fibonacci levels based on the latest impulse movement. It also identifies market structure changes such as BOS (Break of Structure) and CHOCH (Change of Character), helping traders understand the current market direction. CosmiCLab SMC FIBO also pr
This indicator builds a Pivot Anchored Volume Profile (VAP/VPOC approximation using tick volume) and automatically splits the profile into pivot-to-pivot segments , giving you a clean, TradingView-like view of where volume concentrated during each swing. It draws a horizontal histogram for every segment and highlights the Value Area and key levels, making it easy to spot acceptance/rejection zones, high-volume nodes, and potential support/resistance. Key Features Segmented Volume Profile (Pivot-
Fibaction
Abdelkhalek Orabi
Indicator Name: Fibaction – price action candle Detector Description: Fibo Signal Boxes is a powerful Smart Money Concept (SMC)-inspired indicator that auto-detects price action candles. bullish hammers and shooting stars, then draws precise Fibonacci entry zones and multiple take-profit levels directly on the chart. as for the SL personally i use 40 pips rules  Key Features: Detects bullish hammer and shooting star reversal candles. Automatically draws Fibonacci entry and TP boxes. as
Scalping Lines System MT5 是一款专为交易黄金 (XAUUSD) 而设计的短线交易系统,适用于 M1-H1 时间框架。 它整合了趋势、波动率和超买/超卖市场分析指标,并将其集成到一个振荡器中,用于识别短期信号。 信号线的主要内部参数已预先配置。 部分参数可供手动调整:“趋势波持续时间”,用于根据趋势移动平均线 (MA) 调整趋势方向上一系列信号的持续时间;以及“信号线平滑处理”,用于调整信号线的生成方式。 该指标在开盘价计算信号线时不会重绘。在其他价格下,信号箭头可能会闪烁。 信号在蜡烛图收盘后出现,并提供多种警报类型。 推荐使用的时间框架:M1-M5-M15-M30-H1。 该指标最初设计用于黄金交易,但也适用于交易波动性高、点差低的资产,例如比特币和加密货币、白银以及股票指数差价合约(如纳斯达克100指数等)。 对于某些其他交易品种(例如欧元/美元、英镑/美元),该指标可用于15分钟及以上的时间框架。 如何使用该指标进行交易。 对于“卖出”信号: 蓝色下降箭头位于顶部。 震荡指标顶部会出现一个蓝色箭头,箭头后的蓝线表示信号支撑持续时间
TrapSniper Pro
Alex Amuyunzu Raymond
TrapSniper Pro is a professional-grade indicator built to detect genuine price action setups while identifying potential market manipulation zones. It combines advanced candlestick pattern recognition with smart filtering logic to highlight areas where institutional players may be trapping liquidity before major price reversals or continuations. This tool is designed for traders who rely on price action, smart money concepts, and clean chart analysis without unnecessary noise. It provides visual
WAPV adh Supply and Demand Forex
Eduardo Da Costa Custodio Santos
The WAPV ADH Supply and Demand Forex Indicator is part of a set of Indicators called (Wyckoff Academy Wave Market) The WAPV ADH Forex Supply and Demand Indicator for MT5 is intended to identify the winning side between buyers and sellers. Its reading is very simple, when the green line is above the red line demand is in command, when the red line is above the green line supply is in command. The more positive the green and red lines, the higher the volume input, the closer to zero or negative, t
CRT Candle Range Theory HTF MT5 - Ultimate CRT Indicator: 高级ICT概念与马来西亚SnR交易系统 使用最先进的 Candle Range Theory 指标掌握做市商的足迹。释放 Smart Money Concepts (SMC) 的真正力量,并使用 Ultimate CRT Indicator 像机构一样精确交易。该指标专为严肃的交易者打造,自动化了高效的蜡烛范围理论 (CRT)——ICT概念 (Inner Circle Trader) 的核心支柱,并通过马来西亚支撑与阻力 (SnR) 入场方法和 FVG (不平衡) 区域的致命精度对其进行了强化。 无论您是在 MT5 上交易外汇、加密货币还是指数,该算法都能消除市场噪音,过滤虚假突破,并将高概率、高回报的交易区域直接传送到您的图表上。 CRT Indicator 的核心功能: Absolute Extreme SnR Entry Engine: 与依赖滞后吞没形态的传统指标不同,我们的系统采用了马来西亚 SnR 技术。它在严格的时间窗口内扫描绝对最高的 Buy-Sell(阻
Tma Poc Gold
Ignacio Agustin Mene Franco
POC + TMA SCALPER GOLD - Expert Advisor Professional DESCRIPTION: Automated trading system designed specifically for XAU/USD, combining Point of Control (POC) with Triangular Moving Average (TMA) to identify high-volume and trending zones. It uses advanced risk management with dynamic trailing stops and an intelligent grid system. TECHNICA
Big Black Shark MT5
Yaroslav Varankin
Tool for Identifying Potential Reversal Points and Trend Direction This tool is excellent for identifying potential market reversal points and trend direction. It works well in combination with confirming indicators such as MACD, Stochastic, RSI, which are standard on all MT5 platforms. Together, they form a reliable trading strategy. The settings allow for adjusting the channel’s distance and period. It is recommended to enter a trade when the signal line crosses the upper channel boundary and
TrendMagiX MT5
Radek Reznicek
5 (6)
Unique trend trading algorithm with advanced filtering and many features which should become a part of your trading arsenal. This indicator can give you also trading advisors (with take profit target), success rate scanner and much more. Important information For additional detailed information you can visit the 747Developments website. Features Easy to use (just drag and drop to the chart) Possible to use with any trading instrument Possible to use on any time-frame Take profit advisors Succ
VTX OmniBoard Pro
Ling Chung Cheung
VTX OMNIBOARD PRO 是一款专为 MetaTrader 5 设计的机构级多周期、多品种量化分析工作站。依托先进的趋势分析算法、数学期望评估及自营交易(Prop Firm)风控监控系统,交易者无需切换图表即可在单一主图上纵览全局并精准控制风险。 无论您是日内超短线(Scalper)、波段交易者还是 Prop Firm 考核交易者, VTX OMNIBOARD PRO 都能将复杂的市场动态与账户健康数据转化为一目了然的可视化图表。 核心优势与特色功能 全方位 9 维历史回溯分析: 支持按日(Daily)、周(Weekly)、月(Monthly)、年(Yearly)、品种(Symbol)、Magic ID、订单注释(Comment)、交易时区时段(亚盘/欧盘/美盘)及星期几进行多维数据拆解。 Prop Firm 考核风控雷达: 实时监控每日浮动/已实现亏损缓冲空间、整体最大回撤限制及阶段目标进度,全方位保护资金安全。 量化数学期望与夏普引擎: 实时计算单笔交易数学期望(Mathematical Expectancy)、夏普比率、获利因子(Profit Factor)及平均盈亏比
Maximum Trend Arrows OT MT5
Mulweli Valdaz Makulana
STRICTLY FOR BOOM INDEX ONLY!!!!! Here I bring the Maximum Trend Arrows OT1.0 MT5 indicator. This indicator is made up of a combination of different trend indicators for entries and exits, for entries an orange arrow will paint on the chart below the current market and a red flag for closing of trades and it produces buy arrows only. When the orange arrow appears, it will appear along with it's sound to notify you. The 1H timeframe is recommended, don't use it anywhere else than on the 1H timefr
GDS Renko Pip ST Chart - Pip-Based Renko Chart Indicator for MetaTrader 5 GDS Renko Pip ST Chart is a pip-based Renko chart indicator for MetaTrader 5. It helps traders build and study cleaner Renko price movement using a practical fixed pip or point-based brick structure. This tool is designed as a Renko chart foundation for manual analysis. It does not predict the market, does not generate buy or sell signals and does not decide whether a trade should be opened. Renko EDGE EA Golden Delta | A
Structure King AI Signal
Shingala Gautamkumar
Structure King AI Signal Structure King AI Signal is a professional MetaTrader 5 trading indicator designed to help traders analyze market structure, trend direction, multi-timeframe confirmation and trade management from one clean dashboard. Key Features • Market Structure & Trend Analysis • BUY / SELL Signals • Multi-Timeframe (HTF) Confirmation • Entry Price Levels • Dynamic Stop Loss (SL) • TP1 / TP2 / TP3 Levels • ATR Volatility Analysis • ADX Trend Strength Filter • Adaptive Market Filter
Has rsi signal
Evgenii Savinov
HAS RSI Signal — 带有止损/止盈计算的专业趋势指标 HAS RSI Signal 是一款强大的交易工具,结合了经典指标与现代噪声过滤算法。该指标通过 Heiken Ashi Smoothed (HAS) 平滑蜡烛图和 RSI 震荡指标进行市场分析,在趋势反转或价格退出超买/超卖区域时,为交易者提供清晰的人场信号。 主要优势: 双重过滤: 使用 Heiken Ashi Smoothed 算法消除市场“噪音”,同时通过 RSI 确认动能强度。 自动计算点位: 指标不仅提供信号,还会根据当前市场波动率 (ATR) 自动计算 止损 (Stop Loss) 和 止盈 (Take Profit) 点位。 视觉直观: 信号以彩色蜡烛图的形式直接显示在主图表上,保持交易界面的整洁有序。 多维度通知: 内置终端弹窗警报、声音提示以及手机推送通知 (Push),确保您不会错过任何交易机会。 核心原理: 指标持续监控 RSI 的极端区域。当价格离开临界区且 HAS 算法确认方向转变时,即生成交易信号。ATR 参数允许止损和止盈根据市场当前的波动性进行动态调整。 核心参数设置: InpPeri
Divergent Stochastic Filter II Catch Reversals Early, Filter Noise, Trade with Confidence The Edge: Why This Stochastic is Different  Every trader knows the Stochastic oscillator. But knowing when to trust its signals, that's the real challenge. The Divergent Stochastic Filter II transforms this classic indicator into a precision reversal detection system by adding critical elements: divergence intelligence, signal filtering and exhaustion detection.  While standard Stochastic oscillators fire s
该产品的买家也购买
Trend Sniper X
Sarvarbek Abduvoxobov
4.9 (42)
Trend Sniper X 是一款适用于 MetaTrader 5 的多周期趋势跟踪指标,可帮助交易者清晰精准地识别趋势方向和潜在的反转点。 适用于 MT4: https://www.mql5.com/en/market/product/193245 价格信息: 当前价格为促销价,随着后续更新和新功能的推出,价格可能会有所变动。 赠品优惠: 购买后联系作者,即可免费获取该指标的 Auto-Trade Assistant EA(自动交易助手 EA)。 Code2Profit 频道 通过多时间框架分析掌控市场! 如何使用 Trend Sniper X 最大化您的胜率:核心规则与交易时段技巧 技术规格 平台 MetaTrader 5 指标类型 多时间周期趋势指标 运行时间周期 任何图表时间周期,可独立选择更高的时间周期 (M1–MN1) 主要交易品种 外汇、黄金 (XAUUSD) 及其他差价合约 (CFD) 推荐账户 任何账户类型 可视化 彩色趋势蜡烛 (买入/卖出/微弱/变化) + 买入/卖出箭头 附加模块 交易时段方框 (悉尼、东京、伦敦、纽约) 主要功能 多时间周期趋势分析: 直接在
Smart Trend Trading System — MetaTrader 5 购买后,请在 MQL5 上给我发消息,即可免费获得 Smart Universal Expert Advisor,以及在线课程、PDF 手册和私人群组访问权限。 STTS 将趋势方向、入场和出场信号、反转区域及重要价格水平集中呈现在图表上。您可以根据系统手动交易,也可以连接单独的兼容 EA,按照您选择的设置自动执行交易。 一套系统,四种交易思路 STTS 将交易方法分为四大类: • 剥头皮交易 — 跟踪短期信号和市场波动。 • 趋势交易 — 评估方向,寻找趋势中的交易机会。 • 反转交易 — 识别潜在的转折区域和方向变化。 • 成交量交易 — 利用成交量相关信息评估市场活跃程度。 入场和出场箭头、趋势信息、支撑与阻力位及反转区域,帮助您直接在图表上分析交易形态。 先从一种方法开始。了解其信号和设置后,再探索其他方法。 从信号到自动化 Smart Universal Expert Advisor 可连接 STTS,让您自动执行受支持的交易信号。 启用自动交易前,请配置指标连接、仓位大小和交易管理设置
SuperScalp Pro
Van Minh Nguyen
4.56 (36)
SuperScalp Pro - Professional Multi-Layer Confluence Scalping System SuperScalp Pro 是一款高级剥头皮交易指标,在经典 Supertrend 的基础上加入了多个智能确认过滤器。它可以帮助您识别概率更高的 Buy/Sell 交易机会,同时显著减少虚假信号。 清晰的 Buy 和 Sell 箭头会直接显示在图表上,基于 ATR 的 Stop Loss 和 Take Profit 水平会实时自动计算。 购买后,请联系我获取设置指导和推荐配置。 使用 SuperScalp Pro Auto Trader 轻松实现信号自动化: [Auto Trader] 下载推荐设置文件: [Set File] 完整文档请参阅产品博客: [User Guide] 加入官方频道获取最新更新: [Official Channel] 您将获得什么 SuperScalp Pro Indicator – 多层级 Buy/Sell 信号,并自动计算基于 ATR 的 Stop Loss 和 Take Profit。 免费 VM Auto SLTP
全新王者降临 - 指标 + 订单管理提示(TP1 + TP2 + TP3)+ 可选 Telegram 信号发送器 INCLUDED(免费) (完整交易与信号系统) 我们最强的黄金 EA: Gold Slayer 该指标包含先进的交易策略、可自定义订单管理系统,以及结合 Envelope 扩展的均值回归系统,并通过 RSI 等多重智能确认过滤器进行验证,以捕捉高概率反转入场机会,提供 BUY 与 SELL 信号。 你不仅能够学习如何交易,还能学会如何高效管理多个仓位,并利用之前盈利的持仓来覆盖亏损交易。 专为 M5 周期打造并优化,在 BTCUSD 和 XAUUSD 上表现尤为出色,因为这些市场的流动性能够让信号更加干净、可靠。 该指标会自动生成清晰的多头(Long)与空头(Short)信号,同时基于 ATR 自动计算入场位、止损位和止盈位,让风险管理从一开始就融入系统之中。 多 TP 系统设有三个渐进式目标位,你可以在 TP1 锁定部分利润、在 TP2 继续持仓,并在更大的行情中将仓位持有至 TP3,而这正是平均风险回报比真正开始大放异彩的地方。 默认参数开箱即用,已经针对稳定表现进行
SMC Intraday Formula
VividMind Digital Solutions
5 (26)
让我们先坦诚一点。 没有任何一个指标可以单独让你实现盈利。如果有人告诉你可以,那他是在向你兜售一个梦想。任何显示完美买卖箭头的指标都可以被做得看起来毫无瑕疵——只需要放大历史中的某一段并截取成功交易的截图。我们不会这样做。 SMC Intraday Formula 是一个工具。 它为你读取市场结构,标记出概率最高的价格区域,并用简单直白的语言准确告诉你当前智能资金的行为轨迹。你仍然需要做决定。你仍然需要执行交易。但现在,你是带着精确性执行,而不是靠希望。 我们已经在黄金(XAUUSD)以及主要外汇货币对的日内剥头皮交易中使用该指标将近三年。这是我们在 M1、M5、M15 和 M30 上的日常主力工具。它之所以有效,是因为它不试图预测未来——它展示的是当前正在形成的高概率交易机会,并解释 为什么 。 它与其他所有指标有什么不同? 大多数交易指标只做一件事。移动平均线交叉。振荡指标触及某个水平。出现一个箭头。你进场交易。你亏损。你责怪指标。重复。 SMC Intraday Formula 将多个机构级概念整合为一个统一的市场解读: - 斐波那契共振引擎 不只是普通的斐波那契水平——该指标
Entry Points Pro for MT5
Yury Orlov
4.52 (151)
传奇回归:Entry Points Pro 10。 这款传奇指标曾 3 年稳居 MQL5 Market 前三,如今全面重启。 数百条热情好评(两个版本合计 589 条),每天有数千名交易者用它交易,演示版下载 31,000+   MT4+MT5  次。 五年来我读过你们的每一条评价——在第 10 版里,我没有给出许诺,而是把答案直接做进了产品。指标作者自 1999 年入市, 珍视诚信、自己的声誉和自己的客户 。 Entry Points Pro 给出的入场信号严格不重绘。 而且这一次不再只是作者的一面之词,而是可验证的事实:确认信号只在 K 线收盘后标出,自动化测试记录到 零重绘 (在 EURUSD、XAUUSD 和 BTCUSD 上共 2,486,568 次不变量检查——0 次违规)。测试方法完全公开——您可以在策略测试器中自行复现。 购买后请务必第一时间给我发私信。 我会发给您 扩展版说明书《交易者圣经》 ——使用本指标交易的完整指南——并告诉您如何免费获得 赠品:市场扫描器 ,它能同时分析多个品种和多个时间周期,并在一个界面上显示 Entry Points Pro 此刻在哪里表现
Neuro Poseidon MT5
Daria Rezueva
4.75 (52)
Neuro Poseidon is a new indicator by Daria Rezueva. It combines precise trading signals with adaptive TP/SL levels - creating best possible trades as a result! Message me and get  Neuro Poseidon Assistant  as a gift to automize your trading process! What makes it stand out? 1. Proven profitability on all assets and timeframes 2. Only confirmed BUY and SELL signals present on the chart 3. Adaptive TP & SL levels generated by the software for each trade 4. Easy to understand - suitable for al
M5 Sniper
MeanFX
5 (3)
让您的交易优势尽在视野之中! M5 Sniper 是 MeanFX 推出的一款全新指标。它将 精准的交易信号 与 自适应 TP/SL 水平 相结合——从而创造出最佳的统计交易机会! 每售出 5 份,价格上涨一次,下一价格为 69$ 购买后请给我发消息,以获取技巧/指南和奖励 EA 它有哪些突出优势? 经过验证的统计表现 ,适用于 Gold XAUUSD( 几乎适用于每一种资产 ,专注于掌握一个时间周期,而不是试图面面俱到却无法获得稳定的结果) 每天每个交易品种 1 至 8 笔交易 ,具有较高的胜率百分比,并让所有统计优势站在我们这一边 图表上 仅显示已确认的 BUY 和 SELL 信号 自适应 TP 和 SL 水平 ,由指标针对每笔交易生成 平均胜率 75%+ 平均 Signal Ratio 最低 1.1+ 警报 和通知也会发送至 手机 **适合 Prop Firm(资金管理公司)**的交易方式 易于理解——适合 所有经验水平 的交易者 创作者提供的个人支持 100% 不重绘、不重新绘制、不滞后 奖励自动化 Expert Advisor(EA) 背后的策略: M5 Sniper 基于
M1 Sniper MT5
Oleg Rodin
5 (7)
M1 SNIPER   是一款易于使用的交易指标系统。它是一个专为 M1 时间框架设计的箭头指标。该指标可以作为独立的系统在 M1 时间框架下进行剥头皮交易,也可以作为您现有交易系统的一部分使用。虽然该交易系统专为 M1 时间框架交易而设计,但它也可以用于其他时间框架。我最初设计此方法是为了交易 XAUUSD 和 BTCUSD。但我发现这种方法在其他市场交易中也同样有用。 指标信号既可以顺势交易,也可以逆势交易。我教授一种特殊的交易技巧,帮助您利用指标信号进行双向交易。该方法基于使用特殊的动态支撑位和阻力位区域。 购买后,您可以立即下载 M1 SNIPER 箭头指标。此外,我还为所有 M1 SNIPER 工具用户免费提供下方屏幕截图所示的 Apollo Dynamic SR 指标!这两个指标的组合可以帮助您更轻松、更准确地利用 M1 时间框架进行交易。 购买后请联系我,免费获取交易提示和奖励指标! 祝您交易成功!
Adaptive Price Action Engine 买指标,免费送EA 自适应多时间框架趋势与K线形态智能分析系统 市场环境始终在变化,不同的市场阶段中,并非所有 Price Action 形态都具有相同的参考价值。 Adaptive Price Action Engine 旨在适应不断变化的市场条件,将 趋势结构、多时间框架分析、K线形态与统计优化 整合到一个统一的分析框架中。 两种自适应模式 Dual Alpha Trend Mode(双 Alpha Trend 模式) 自动搜索适合的 Alpha Trend 参数,并结合低周期与高周期市场结构,使指标能够根据近期市场行为动态调整趋势识别。 Candlestick + Alpha Mode(K线 + Alpha 模式) 将 Alpha Trend 市场状态与 22种多空K线形态 相结合。系统不会简单地对所有形态一视同仁,而是对不同的形态组合进行统计评估,并识别在特定市场环境下表现出更强历史统计特征的配置。 主要功能 趋势参数自动优化 多时间框架市场状态分析 22种多头与空头 Price Action K线形态 对数千种可能
ARIPoint
Temirlan Kdyrkhan
1 (4)
ARIPoint is a powerful trading companion designed to generate high-probability entry signals with dynamic TP/SL/DP levels based on volatility. Built-in performance tracking shows win/loss stats, PP1/PP2 hits, and success rates all updated live. Key Features: Buy/Sell signals with adaptive volatility bands Real-time TP/SL/DP levels based on ATR Built-in MA Filter with optional ATR/StdDev volatility Performance stats panel (Success, Profit/Loss, PP1/PP2) Alerts via popup, sound, push, or email Cu
Gann Made Easy MT5
Oleg Rodin
5 (11)
Gann Made Easy   是一个专业且易于使用的外汇交易系统,它基于使用先生理论的最佳交易原则。 W.D.江恩。该指标提供准确的买入和卖出信号,包括止损和获利水平。您甚至可以使用推送通知在旅途中进行交易。 购买后请联系我,即可免费获得交易指导和超棒的额外指标! 您可能已经多次听说过江恩交易方法。通常 Gann 的理论不仅对于新手交易者而且对于那些已经有一定交易经验的人来说都是非常复杂的东西。这是因为江恩的交易方法在理论上并不那么容易应用。我花了几年时间来完善这些知识,并将最好的原则应用到我的外汇指标中。 该指标非常易于应用。您所需要的只是将其附加到您的图表并遵循简单的交易建议。该指标不断进行市场分析工作并寻找交易机会。当它检测到一个好的入口点时,它会为您提供一个箭头信号。该指标还显示止损和获利水平。 换句话说,当您像先生一样进行交易时,该指标会为您提供最佳江恩建议。江恩亲自告诉你此时此刻该做什么。但最好的部分是您不需要了解任何有关江恩交易原则的知识,因为该指标会为您完成整个市场分析工作。
Scalper Vault MT5
Oleg Rodin
5 (1)
Scalper Vault 是一套功能强大且配置完善的交易系统,专为追求日内交易稳定性的交易者而设计。 作为一套完整且独立的交易系统,该高精度指标能够为外汇和二元期权交易者提供机构级的市场分析。 购买后请联系我,获取我的独家交易技巧以及一份超值赠品! Scalper Vault 能够消除凭感觉交易和复杂的各种手动分析,让您只需专注于执行交易,并运用简单易行的交易技巧进行操作。 精准的顺势交易信号:其核心算法通过分析市场结构,仅在市场主导趋势的方向上提供高胜率信号,从而大幅减少错误的入场操作。 精确的顶部与底部探测:系统能够识别市场动能耗尽的状态,从而锁定潜在的反转区域。 基于江恩(Gann)理论的买卖区域:系统会自动绘制江恩数学市场点位,让您能清晰洞察大型机构交易者在何处寻求买入或卖出。 100% 不会重绘(Non-Repainting):一旦K线收盘,生成的信号便会永久固定在图表上。绝无动态偏移,绝无虚假信号——您在历史数据中所见,即为该指标的真实表现。 广泛的市场适用性:适用于各类货币对、黄金、指数以及加密货币交易。
Auto Optimized SpeedAngle 是一款机构级的动量向量化系统,通过持续的前瞻优化(Walk-Forward Optimization, WFO)彻底消除了曲线拟合(curve-fitting)。该指标没有采用在市场 状态转换时容易失效的静态输入参数,而是利用出样外验证(Out-of-Sample, OOS) dynamically 动态重新校准设置,从而确保显示的 信号代表真正的统计优势,而非历史巧合。 核心机构级架构 前瞻优化引擎(Walk-Forward Optimization Engine): 核心算法持续扫描数千种回溯周期(lookback)与阈值组合,严格将数据划分为样本内(in-sample)和样本外(out-of-sample)。只有当参数配置在未知数据环境中证明具备数学优越性时,系统才会对其进行 adoption。 量化目标函数(Quantitative Objective Functions): 优化引擎不一味追求绝对毛利,而是聚焦于机构级的稳定性指标。用户可针对系统质量数(SQN)、期望值(每笔交易的平均 R 倍数)或净 R 值进行优化,从而优
Tokyo mt5 Indicator
Vasiliy Strukov
5 (10)
Tokyo Indicator(东京指标)直观地展示了趋势方向、潜在交易信号及市场状况。 其采用颜色编码的阶梯式趋势线,以蓝色标识看涨阶段,以洋红色标识看跌阶段。配套的方向箭头会在趋势发生变化时,标示出潜在的买入与卖出机会。 内置的综合仪表盘将当前信号、市场倾向、动能、波动率及信号质量整合于同一视图中,方便交易者在观察价格走势的同时评估指标数据,无需在不同面板间切换。 凭借清晰的图表显示和简洁的市场概览,Tokyo Indicator 支持以系统化的方式进行趋势分析与交易确认。 适用于任何时间周期及各类交易品种,尤其适合黄金交易。 购买后请立即联系我,以获取专属赠品!您可以免费获得我们的“强力支撑与趋势扫描”(Strong Support and Trend Scanner)指标,请私信我! 设置说明与使用手册请见此处。 请注意:我不会在 Telegram 上出售我的 EA 或特殊参数设置(set files);我的 EA 仅在 Mql5 平台上提供,而参数设置文件仅在我的博客(此处链接)上发布。请务必警惕诈骗,切勿从他人处购买任何参数设置! 设置 ShowHUD —— 在图表上显示
Entry In The Zone and SMC Multi Timeframe is a real-time market analysis tool based on Smart Money Concepts (SMC), designed to analyze market structure, price direction, and key trading zones. It supports both Single-Timeframe and Multi-Timeframe Analysis, providing a clearer view of overall market structure across multiple timeframes, with real-time BUY / SELL signals designed with a strict focus on No-Repaint principles. The signals are designed to help filter unclear setups and evaluate tradi
Trend Catcher ind mt5
Ramil Minniakhmetov
5 (18)
趨勢捕捉指標 趨勢捕捉指標結合了作者獨有的客製化自適應趨勢分析指標,用於分析市場價格趨勢。它透過過濾掉短期噪音,並專注於潛在的動能強度、波動性擴張和價格結構行為,來識別真實的市場方向。此外,它還結合了平滑和趨勢過濾等客製化指標,例如移動平均線、相對強弱指標 (RSI) 和波動率過濾器。 您可以在這裡查看實際運行情況以及我的其他產品: https://www.mql5.com/en/users/mechanic/seller 請注意,我不會在 Telegram 上出售 EA 或任何設置,那是騙局。所有設定都可以在我的部落格上免費取得。 重要提示!購買後請立即聯繫我,以獲取使用說明和額外獎勵! 請注意,我不會在 Telegram 上出售 EA 或任何設置,那是騙局。所有設定都可以在我的部落格上免費取得。
您好,交易员! 大多数散户交易者依赖于滞后的网页脚本。真正具有交易优势需要机构化的架构。 Astro AI 指标并非标准的图表叠加层。它是一个编译后的神经网络,包含两个代理,直接运行在您的终端上。 以下是该系统背后的具体技术: 1. 代理 1:分析师(图神经网络 - GNN) 市场并非孤立的价格柱;它们是相互关联的数据网络。 功能:代理 1 使用图神经网络来映射这些复杂的非线性关系。 优势:标准指标仅考虑单一的历史移动平均线,而我们的 GNN 可以实时处理深层的市场结构关系,在散户交易量发挥作用之前揭示隐藏的相关性。 2. 代理 2:执行器(近端策略优化 - PPO) 模式识别只是成功的一半。基于当前市场波动做出正确的决策,才是预测模型与滞后模型之间的区别所在。 功能:代理 2 使用 PPO(一种先进的强化学习算法)来确定最佳入场点。 优势:它持续调整交易策略,而非使用静态的“超买”或“超卖”线。它会分析当前市场状况并计算最可能的成交点。 执行桥接:通过 ONNX 集成到交易终端 如果执行速度慢,模式识别就毫无用处。我们已通过 ONNX(开放神经网络交换平台)
Divergence Bomber
Ihor Otkydach
4.89 (94)
购买该指标的每位用户将额外免费获得以下内容: 原创工具“Bomber Utility”,该工具会自动跟踪每一笔交易,设置止损和止盈点,并根据策略规则自动平仓; 适用于不同交易品种的指标设置文件(Set 文件); 三种不同风险模式下的 Bomber Utility 设置文件:“最低风险”、“平衡风险” 和 “观望策略”; 一套详细的 视频操作手册,帮助您快速完成安装、配置并开始使用本交易系统。 注意: 要获取以上所有赠品,请通过 MQL5 的私人消息系统联系卖家。 我为您介绍原创的自定义指标 “Divergence Bomber”(背离轰炸机),它是一套基于 MACD 背离交易策略 的“全功能”交易系统。 该技术指标的主要任务是识别 价格与 MACD 指标之间的背离,并发出交易信号(包括推送通知),指示未来价格可能的运动方向。平均而言,这些信号的准确率超过 98%。有关该指标如何工作的详细说明,请观看本页面上的视频演示。 该系统使用 止损订单 和 动态回撤平仓机制 来管理交易。 Divergence Bomber 指标的主要特点: 支持交易的品种: AUDCAD、AUDCHF、AUDS
PainX GainX Blue Spike Fusion AI Advanced Synthetic Index Spike Detection Indicator for MetaTrader 5 Discover potential spike setups with a clear, organized, and professional trading interface. PainX GainX Blue Spike Fusion AI is a specialized indicator designed for traders who monitor synthetic indices and want a structured way to observe potential price spike opportunities. The indicator combines signal monitoring, market-condition analysis, visual alerts, and event tracking in one convenient
Unix Scalper
Issam Kassas
4 (4)
Unix Scalper — MetaTrader 5 购买后,请在 MQL5 上给我发消息,即可免费获得 Smart Universal Expert Advisor,以及在线课程、PDF 手册和私人群组访问权限。 发现交易形态,看清交易计划,选择执行方式。 UNIX Scalper 将市场分析、BUY/SELL/WAIT 决策以及 Entry、Stop Loss、TP1 和 TP2 水平集中在一个清晰的面板中。 看清信号与交易计划 • 明确的决策:BUY、SELL 或 WAIT。 • 明确的价格水平:Entry、Stop Loss、TP1 和 TP2。 • 多时间周期概览:比较面板中各时间周期的信号。 • 辅助分析:趋势、动量、成交量、波动率、支撑与阻力,以及市场质量。 • 灵活的布局:Minimized、Compact、Standard 或 Full。 查看信号,检查价格水平,再判断该交易形态是否符合您的交易规则。 从黄金和比特币开始 建议首先使用的交易品种:XAUUSD 和 BTCUSD。 探索短期剥头皮交易和较高时间周期分析。选择历史K线范围,通过表现曲线查看所选设置
Volatility Master for MetaTrader is a real-time dashboard tool that scans up to  50 symbols  to identify high-volatility , trending markets instantly. With bullish/bearish signals, customizable alerts, and a user-friendly interface, it helps you avoid range-bound conditions and focus on high-probability trades. Clarity leads to confidence. Trade confidently and protect your capital effectively with this powerful dashboard. We don't offer free or bonus indicators in exchange of reviews from you.
Atomic Analyst MT5
Issam Kassas
4.48 (62)
Atomic Analyst — MetaTrader 5 购买后,请在 MQL5 上给我发消息,即可免费获得 Smart Universal Expert Advisor,以及在线课程、PDF 手册和私人群组访问权限。 Atomic Analyst 将价格行为、趋势方向、入场和出场信号、止损位及多个止盈位集中呈现在图表上。 看清信号,理解交易形态 Atomic Analyst 将分析结果整理为清晰的可视化信息: • 买入和卖出箭头,用于识别潜在的入场机会。 • 止损位和多个止盈位,帮助规划交易。 • 趋势、强度和动量读数,用于评估市场方向。 • 多时间周期分析,用于比较更广泛的市场背景。 • 彩色K线和提醒,帮助您跟踪变化的市场条件。 结合辅助分析查看信号,再判断该交易形态是否符合您的交易规则。 从短期形态到更大级别的行情 您可以将 Atomic Analyst 用于剥头皮交易、日内交易,或跟踪持续时间更长的市场走势。 建议从 H1 时间周期开始。建议交易品种包括 EURUSD、AUDUSD 和 XAUUSD。 从信号到自动化 Smart Universal Expert A
Market Structure Order Block Dashboard MT5 是一款专为希望直接在图表上解读市场结构和主要价格反应区域的交易者设计的MT5指标。它结合了BOS、ChoCH、订单块(Order Blocks)、公允价值缺口(FVG)、流动性、Kill Zones、成交量分布图以及一个紧凑的面板,便于快速分析。 本指标面向使用市场结构、ICT和Smart Money概念作为决策框架的交易者。它可以帮助以更结构化的方式识别趋势延续、可能的反转、价格失衡、流动性目标和关注区域。 面向买家的资源 购买后可通过MQL5私信申请获取完整的PDF使用指南和参数配置建议。通过MQL5私信提供直接技术支持。 1.20版本带来两项重要新增: Pending BOS / Pending ChoCH 检测 和 可拖动面板 (按住面板标题栏即可将其拖动到图表任意位置,不影响图表本身)。当K线收于前一摆动点之外时,Pending Breaks 立即显示待确认的结构突破,无需等待经典的摆动确认。 重要 本产品仅为指标。它不会自动开仓、平仓或管理仓位。它不是EA(智能交易系统)。 主要功能 市场
Break and Retest Hunter
Mohamed Hassan
5 (2)
Break and Retest Hunter is a powerful MetaTrader 5 indicator designed to automatically identify support and resistance levels, breakout structures, and potential retest opportunities in real time. Bonus Indicator: After purchasing Break and Retest Hunter , contact me to receive Trade Indicator Assistant EA completely free as a bonus utility. $65 for the next 10 copies . Next price is $120.  Combining adaptive market analysis, clear BUY/SELL signals, Fibonacci-based profit targets, and a premiu
FiboSniper Pro
Van Minh Nguyen
5 (3)
FiboSniper Pro – Multi-Filter Fibonacci System with Auto SL/TP and Control Panel FiboSniper Pro 是一款技术指标,将动态 Fibonacci Envelopes 与多个确认过滤器相结合,以生成经过筛选的 Buy 和 Sell 信号。Fibonacci 水平基于 Moving Average 和 ATR 计算,然后通过 ADX、EMA、RSI、ATR、Volume、Time 和 Candle 结构进行过滤。该指标直接在图表上显示基于 ATR 自动计算的 Stop Loss 和 Take Profit 水平,并提供交互式控制面板,以便快速调整参数。 购买后,请联系我以获取推荐的设置文件和详细使用说明。 使用 Auto Trader X 自动执行 FiboSniper Pro 信号: [Auto Trader X] 用户指南和设置文件: [Click here] 完整文档请参阅产品博客: [Click here] 加入官方频道获取最新更新: [Click here] 专为偏好结构化入场和清晰风险管理
Quantum TrendPulse
Bogdan Ion Puscasu
5 (26)
介绍 Quantum TrendPulse   ,这是一款终极交易工具,它将 SuperTrend   、   RSI 和 Stochastic 的强大功能整合到一个综合指标中,以最大限度地发挥您的交易潜力。该指标专为追求精准和效率的交易者而设计,可帮助您自信地识别市场趋势、动量变化以及最佳进入和退出点。 主要特点: 超级趋势整合: 轻松跟随当前的市场趋势并乘上盈利浪潮。 RSI 精度: 检测超买和超卖水平,非常适合把握市场逆转时机,可用作 SuperTrend 的过滤器 随机精度: 利用随机振荡在波动的市场中寻找隐藏的机会, 用作超级趋势的过滤器 多时间范围分析: 从 M5 到 H1 或 H4,在不同时间范围内关注市场动态。 可定制的警报: 当您的自定义交易条件得到满足时收到通知,这样您就不会错过任何交易。 无论您是新手还是经验丰富的交易员,   Quantum TrendPulse 都能为您提供所需的优势,帮助您增强策略并自信地进行交易。借助这一强大的指标,将洞察力转化为利润 — 掌控您的交易! ***购买 Quantum TrendPulse,即可免费获得 Quantum Tr
FX Power MT5 NG
Daniel Stein
5 (33)
FX Power:分析货币强度,助您做出更明智的交易决策 概述 FX Power 是一款专业工具,帮助您全面了解主要货币和黄金在任何市场条件下的真实强度。通过识别强势货币用于买入,弱势货币用于卖出, FX Power 简化了交易决策,并帮助您发现高概率的交易机会。不论您是想跟随趋势还是通过极端的 Delta 值预测反转,这款工具都能完美适应您的交易风格。别再盲目交易——用 FX Power 让您的交易更加智慧。 1. 为什么 FX Power 对交易者极具价值 实时货币和黄金强度分析 • FX Power 实时计算并显示主要货币和黄金的相对强度,助您全面了解市场动态。 • 监控领先或落后资产,轻松识别值得交易的货币对。 全面的多时间框架视图 • 跟踪短期、中期和长期时间框架的货币和黄金强度,以便将您的交易策略与市场趋势保持一致。 • 无论是快进快出的短线交易还是更长期的投资策略, FX Power 都能为您提供所需的信息。 Delta 动态分析用于趋势和反转 • 极端 Delta 值常常预示反转机会,而平缓的 Delta 变化则确认趋势延续。 • 使用 Delta 分析,轻
Axiom Matrix
Issam Kassas
5 (8)
购买后,请在 MQL5 上给我发消息,即可免费获得 Smart Universal Expert Advisor,以及在线课程、PDF 手册和私人群组访问权限。 扫描市场。比较机会。选择下一张图表。 Axiom Matrix (MetaTrader 5) 将多品种、多周期分析整合到一个面板中。无需逐一检查所有图表,即可找到值得关注的市场。 扫描市场报价中的品种或自选品种,覆盖多个周期。 比较趋势、动量、成交量、波动率及市场质量信息。 通过 Best Axiom Pick、信号状态及可点击单元格查看交易机会。 Axiom Matrix 是分析面板,不执行交易。 面板将多个品种与周期的信息集中显示,便于比较不同市场的状态。您可以从市场报价或自选列表开始扫描,再通过可点击的单元格打开对应图表进行进一步分析。显示的分析结果不代表收益保证。 查看截图,了解界面,并阅读客户评价。 如有产品、设置或技术支持方面的问题,请直接在 MQL5 上给我发消息。 — Issam 交易存在风险。历史结果不保证未来表现。请先在模拟账户中测试您的设置。
PZ Divergence Trading MT5
PZ TRADING SLU
3.71 (7)
棘手的发现和频率稀缺是最可靠的交易方案之一。该指标使用您喜欢的振荡器自动查找并扫描常规和隐藏的发散。 [ 安装指南 | 更新指南 | 故障排除 | 常见问题 | 所有产品 ] 容易交易 发现常规和隐藏的分歧 支持许多知名的振荡器 根据突破实现交易信号 显示适当的止损和获利水平 可配置的振荡器参数 可自定义的颜色和尺寸 按条形过滤大小差异 实现绩效统计 它实现了电子邮件/声音/视觉警报 为了提供广阔的市场前景,可以使用不同的振荡器在同一张图表中多次加载该指标,而不会产生干扰。该指标支持以下振荡器: RSI CCI MACD OSMA 随机 动量 很棒的振荡器 加速器振荡器 威廉姆斯百分比范围 相对活力指数 由于差异可能会扩大很多,尤其是在外汇市场中,因此该指标产生了转折:它在等待交易突破之前等待donchian突破确认差异。最终结果是带有非常可靠的交易信号的重新粉刷指示器。 输入参数 幅度:用于寻找差异的之字形周期 振荡器-选择要加载到图表的振荡器。 突破期-交易信号的突破期,以柱为单位。 发散类型-启用或禁用发散类型:隐藏,常规或两者。 最小散度单位为条形-最小散度单位为条形
作者的更多信息
HLC bar MT5 Wyckoff
Eduardo Da Costa Custodio Santos
創建 MT5 的指標“HLC_bar_MT5 Wyckoff”是為了方便交易時的分析。 HLC Bar 由 Richard Wyckoff 使用,目前廣泛用於“VSA”操作。 Wyckoff 發現使用 High、Low 和 Close 使圖表更清晰、更易於分析。 指標“HLC_bar_MT5 Wyckoff”允許: # 改變條寬; # 保持條形相同的顏色; # 並突出顯示以相同價格開盤和收盤的柱。 顏色和寬度很容易在設置中修改 要使用該指標,只需將其拖到圖表上即可。 當與成交量一起使用時,威科夫將 HLC 圖表稱為條形圖。 他們試圖隱藏這些信息多年,但現在每個人都可以訪問這些信息,並可以使用此類圖表改進他們的操作。 HLC bar MT5 Wyckoff Chart 可用於任何市場和任何圖表時間,使操作員更加舒適。
Segmented Volume MT5
Eduardo Da Costa Custodio Santos
Volume Zone Fractal
Eduardo Da Costa Custodio Santos
VZO Plus is an indicator that shows overbought and oversold regions based on traded volume. #When the indicator line is between -40 and -60 it is oversold #When the indicator line is between 40 and 60 it is overbought. Outside these regions, the market is following its natural path by inertia. Above the green line, it means that the market is positive, Another way to analyze the indicator is through divergence regions. When we have the bottom higher than the other in a downtrend or One bottom
VSA Smart Money
Eduardo Da Costa Custodio Santos
The VSA Smart Money indicator tracks the movement of professional traders, institutional trades and all compound man movements. The VSA Smart money Indicator reads bar by bar, being an excellent tool for those who use VSA, Wyckoff, PVA and Any other analysis that uses price and volume. There are 10 indications that you will find in your Chart: *On Demand *Climax *UT Thrust *Top Reversal bar *Stop Volume *No Supply *Spring *Reversal Bottom *Shakeout *Bag Holding Using this indicator you will be o
Jac Trend
Eduardo Da Costa Custodio Santos
The JAC Trend Indicator for MT5 was created to facilitate the identification of the market trend in an easy and agile way. # When JAC Trend indicator is green , we have a pre-trend to uptrend market. # When JAC Trend indicator is Red we have a pre-trend to downtrend market. # When JAC Trend indicator is gray , we have a sideways market without strength. That way you have all the sides that the Market can go to in a clear and objective way.
Z Score Plus MT5
Eduardo Da Costa Custodio Santos
Trend Everest
Eduardo Da Costa Custodio Santos
Trend Everest MT5 indicator is a trend following indicator that aids in decision making. It is based on the calculation of ATR that assist and the average hull. A key issue is that the Trend Everest MT5 nominee does not repaint, so you can backtest with greater confidence. When it is Green, UpTrend When it is a Red downtrend. Not that the Market is fractal, so the longer the graphic time, the greater its degree of assertiveness.
JAC Trend Color Candle
Eduardo Da Costa Custodio Santos
The indicator "JAC Trend Color Candle" for Meta Trader 5, was created to visually facilitate the trend for the trader. It is based on three parameters, which identifies the uptrend, downtrend and non-trending market. The colors are trader-configurable, and the average trader-configurable as well. trend parameters cannot be configured as they are the indicator's differential.
WAPV adh Supply and Demand
Eduardo Da Costa Custodio Santos
The WAPV ADH Supply and Demand indicator is part of a set of indicators called (Wyckoff Academy Wave Market) The WAPV ADH Supply and Demand indicator for MT5 is intended to identify the winning side between buyers and sellers. Its reading is very simple, when the green line is above the red line the demand is in charge, when the red line is above the green line the supply is in charge. The more positive the green and red lines, the greater the volume input, the closer to zero or negative, th
WAPV adh Supply and Demand Forex
Eduardo Da Costa Custodio Santos
The WAPV ADH Supply and Demand Forex Indicator is part of a set of Indicators called (Wyckoff Academy Wave Market) The WAPV ADH Forex Supply and Demand Indicator for MT5 is intended to identify the winning side between buyers and sellers. Its reading is very simple, when the green line is above the red line demand is in command, when the red line is above the green line supply is in command. The more positive the green and red lines, the higher the volume input, the closer to zero or negative, t
WAPV Box Effort x Result
Eduardo Da Costa Custodio Santos
WA_PV_BOX_EFFORT X MT5 的结果 WAPV Box Effort x Result Indicator 是 Package Indicators 组(Wyckoff Academy Wave Market)的一部分。 MT5 的 WAPV Box Effort x Result Indicator 可帮助您阅读价格和交易量。它的阅读包括协助识别努力x结果 在图表创建的波浪中。 当方框为绿色时,MT5 的 WAPV Box Effort x Result Indicator 表示交易量有利于需求,而当方框为红色时 量有利于供应。 方框越大,成交量相对于价格的位移越大。如果价格的上升波与 Box 的大小不成比例,则 努力x结果。 以一种非常直观的方式,我们可以识别出数量和价格之间的这种差异。 MT5 的 WAPV Box Effort x Result Indicator 还允许您通过将指标置于零轴下方来改善可视化。 以即时交易量和实际交易量在市场上运作 看图片:
Wapv Price and volume
Eduardo Da Costa Custodio Santos
Weis Wave Double Side
Eduardo Da Costa Custodio Santos
The Weis Wave Bouble Side Indicator for MT5 is part of the toolkit (Wyckoff Academy Wave Market) The Weis Wave Bouble side Indicator for MT5 was created based on the already established Weis Wave created by David Weis. The Weis Wave Double Side indicator reads the market in waves as it was done by R. Wyckoff in 1900. It helps in the identification of effort x result, cause and effect, and Supply and demand Its differential is that it can be used below the zero axis, further improving plus operat
Weis Wave Double Side Alert
Eduardo Da Costa Custodio Santos
The Weis Wave Bouble Side Indicator for MT5 is part of the toolkit (Wyckoff Academy Wave Market) The Weis Wave Bouble side Indicator for MT5 was created based on the already established Weis Wave created by David Weis. The Weis Wave Double Side indicator reads the market in waves as R. Wyckoff did in 1900. It helps in the identification of effort x result, cause and effect, and Supply and demand Its differential is that it can be used below the zero axis and has a breakout alert showing Who is s
VSA Candle Signal
Eduardo Da Costa Custodio Santos
The VSA Candle Signal for MT5 is part of the toolset (Wyckoff Academy Price and Volume). Its function is to identify the correlation of Price and Volume in the formation of the candle. Its creation is based on the premises of R.Wyckoff , a precursor in the analysis of Price and Volume. VSA Candle Signal for MT5 assists in decision making, leaving your reading clearer and more fluid. See the images below.
WAPV Force and Weakness MT5
Eduardo Da Costa Custodio Santos
The Force and Weakness Indicator for MT5 Real Volume is part of the (Wyckoff Academy Price and Volume) toolset The Force and Weakness Indicator for MT5 Real Volume was developed to identify the Strength and Weakness of volume in an accumulated way. Enabling the vision of a panorama between price and volume. The Indicator can be used as an oscillator and as a histogram. As a fantasy it has all the premises of R. Wyckoff's three laws when put together with the price: Cause and Effect, Effort x Res
WAPV Weis Wave Chart Forex
Eduardo Da Costa Custodio Santos
The Weis Wave Chart Forex for MT5 is a Price and Volume indicator. The Price and Volume reading was widely disseminated through Richard Demille Wyckoff based on the three laws created by him: Supply and Demand, Cause and Effect and Effort vs. Result. In 1900 R.Wyckoff already used the wave chart in his analyses. Many years later, around 1990, David Weis Automated R. Wyckoff's wave chart and today we bring you the evolution of David Weis' wave chart. It shows the amount of Volume and the amount o
WAPV Weis Wave Chart MT5
Eduardo Da Costa Custodio Santos
The Weis Wave Chart for MT5 is a Price and Volume indicator. The Price and Volume reading was widely disseminated through Richard Demille Wyckoff based on the three laws created by him: Supply and Demand, Cause and Effect and Effort vs. Result. In 1900 R.Wyckoff already used the wave chart in his analyses. Many years later, around 1990, David Weis Automated R. Wyckoff's wave chart and today we bring you the evolution of David Weis' wave chart. It shows the amount of Volume and the amount of pips
WAPV Full MT5
Eduardo Da Costa Custodio Santos
5 (1)
## 使用 WAPV Full 專業操作並能夠跟踪 大玩家的錢在哪裡 想像一下,您手中有一個可以單獨進行閱讀的工具 主要市場參與者,顯示最佳交易區域 基於價格和數量分析。 WAPV Full 是一個完整的工具, 100% 專注於 R. Wyckoff 的操作 除了繪製交易波中的市場走勢外,它還繪製了 通過閱讀價格和數量來了解市場。 專業市場根據 R. Wyckoff 的 3 條定律運作 #因果關係 # 供給與需求 # 努力 x 結果 所有這些都在 WAPV Full 中提供,它為您提供 16 種基本工具 為您專業地分析市場,從而 改善你的結果。 查看圖片和視頻以了解我在說什麼。 ## Shǐyòng WAPV Full zhuānyè cāozuò bìng nénggòu gēnzōng dà wánjiā de qián zài nǎlǐ xiǎngxiàng yīxià, nín shǒuzhōng yǒu yīgè kěyǐ dāndú jìnxíng yuèdú de gōngjù zhǔyào shìchǎng cānyù zhě, xiǎnshì zuì jiā jiā
WA Order Block FVG bos MT5
Eduardo Da Costa Custodio Santos
O  WA Order Block FVG bos MT5  é um indicador com base no estudo de SMC (Smart Money Concepts) criado pelo ICT Inner Circle Trader, eleplota no seu gráfico as informações de Order Blocks em 3 tempos gráficos diferentes, fair Value Gaps e Regiões de Liquidez além do BOS ( Break os Structures), tudo em um só indicador. Dessa forma você não precisa colocar essas informações de forma manual. Agora você tem tudo isso de forma automática em seu gráfico.
Livro Visual
Eduardo Da Costa Custodio Santos
O LIVRO VISUAL é uma ferramenta que auxilia na identificação de escoras e renovação de ordens, para quem opera Tape Reading ou fluxo no gráfico é uma excelente ferramenta. Porem ele funciona somente em Mercados Centralizados ou com profundidade nível 2. É de fundamental importância você saber que ele não funciona em Mercado de FOREX. Porem pode ser utilizado no Mercado da B3.
筛选:
无评论
回复评论