KT Forex Sessions MT4
- 指标
- 版本: 1.0

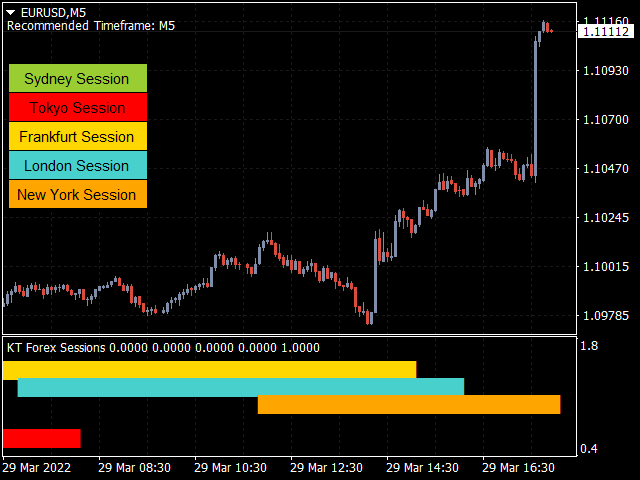
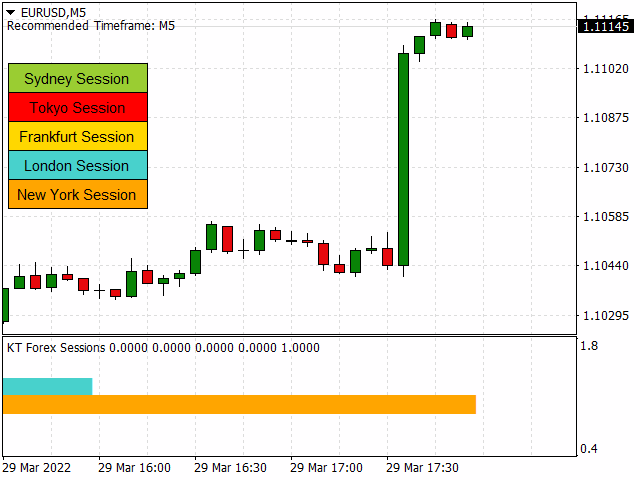
KT Forex Session shows the different Forex market sessions using meaningful illustration and real-time alerts. Forex is one of the world's largest financial market, which is open 24 hours a day, 5 days a week. However, that doesn't mean it operates uniformly throughout the day.
Features
- Lightly coded indicator to show the forex market sessions without using massive resources.
- It provides all kinds of Metatrader alerts when a new session starts.
- Fully customizable.
Forex Session Timings
Intraday Forex traders need to know the opening and closing times of leading currency exchanges. There are five main leading currency exchanges with the following timings:
| Session | Starts | Ends |
|---|---|---|
| Sydney | 21 GMT | 5 GMT |
| Tokyo | 23 GMT | 7 GMT |
| Frankfurt | 6 GMT | 14 GMT |
| London | 7 GMT | 15 GMT |
| New York | 12 GMT | 20 GMT |
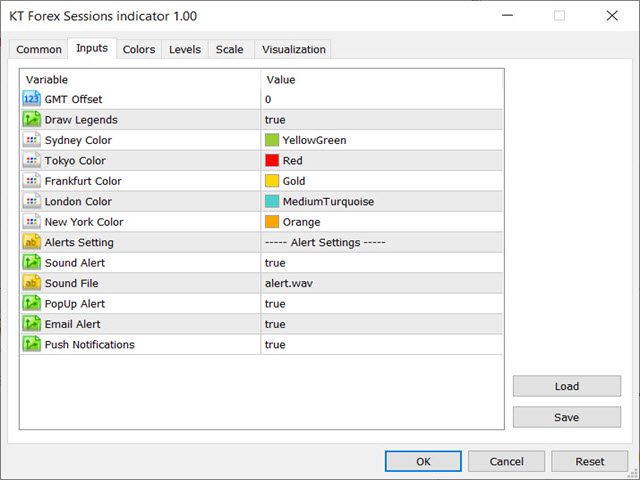
Inputs
- GMT Offset: Based on your Broker, insert your GMT offset here.
- Draw Legends: Draw session legends on the top left corner of the chart.
- Choose the sessions color.
- Alert Settings.