MT Merit TLC
- 指标
- 版本: 4.10
- 更新: 12 十二月 2024
- 激活: 9

| Please thoroughly test demo the indicator in your preferred trading conditions before making a purchase decision. Your satisfaction and confidence in its performance are paramount. |
|---|
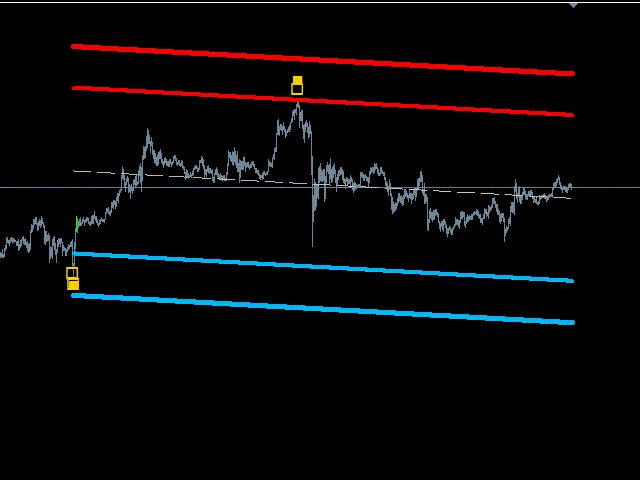
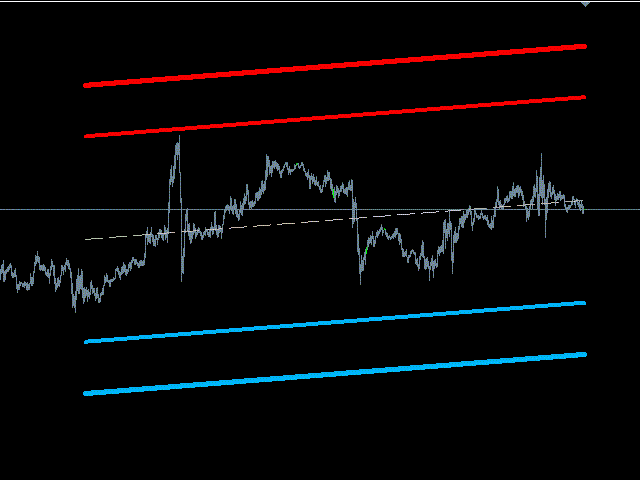
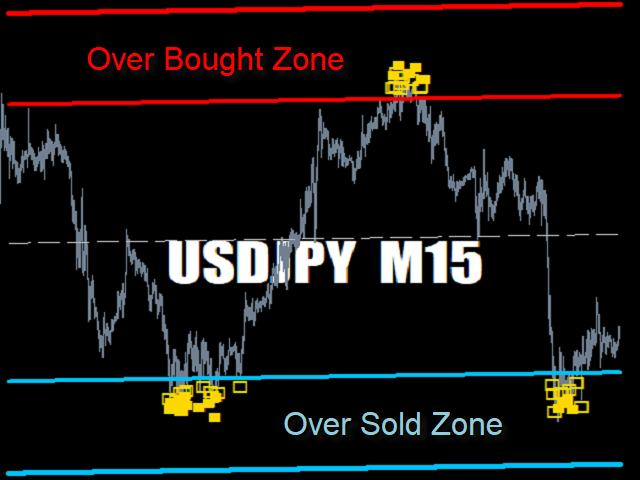
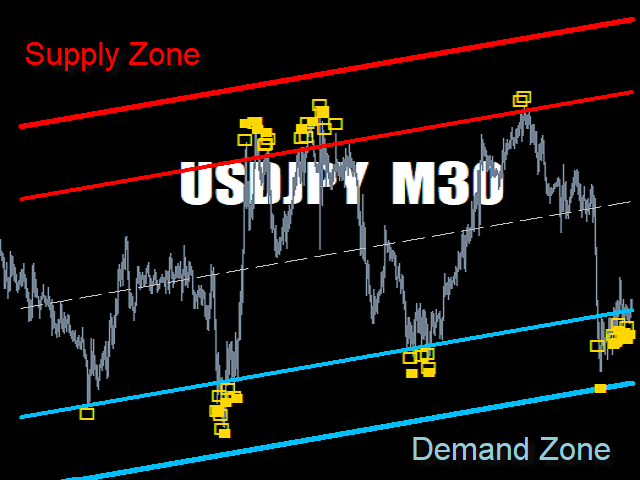
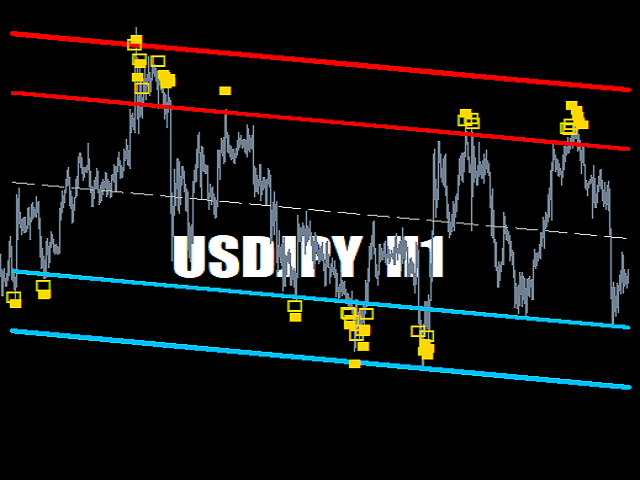
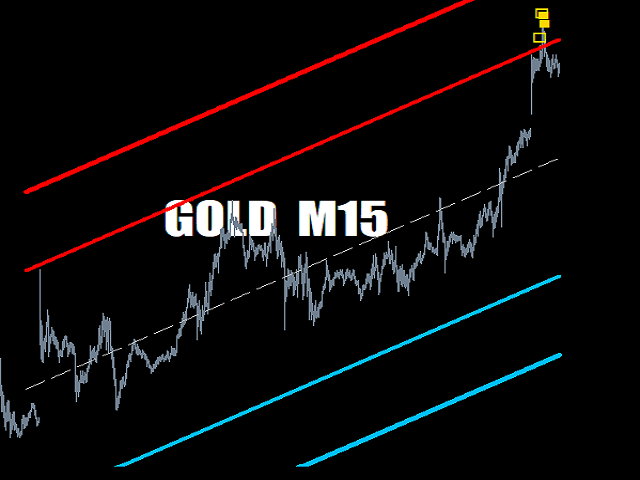
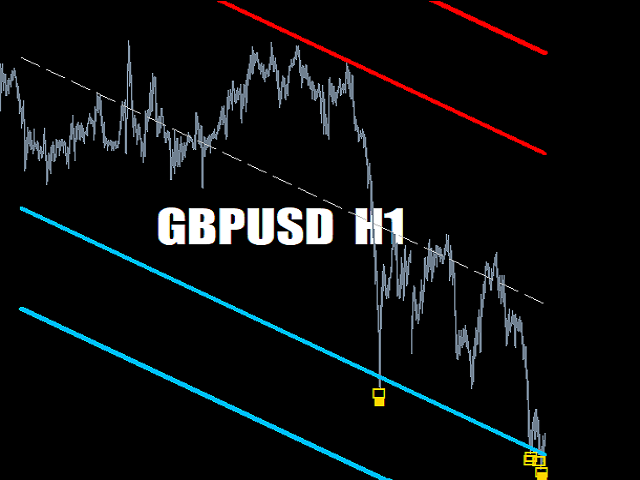
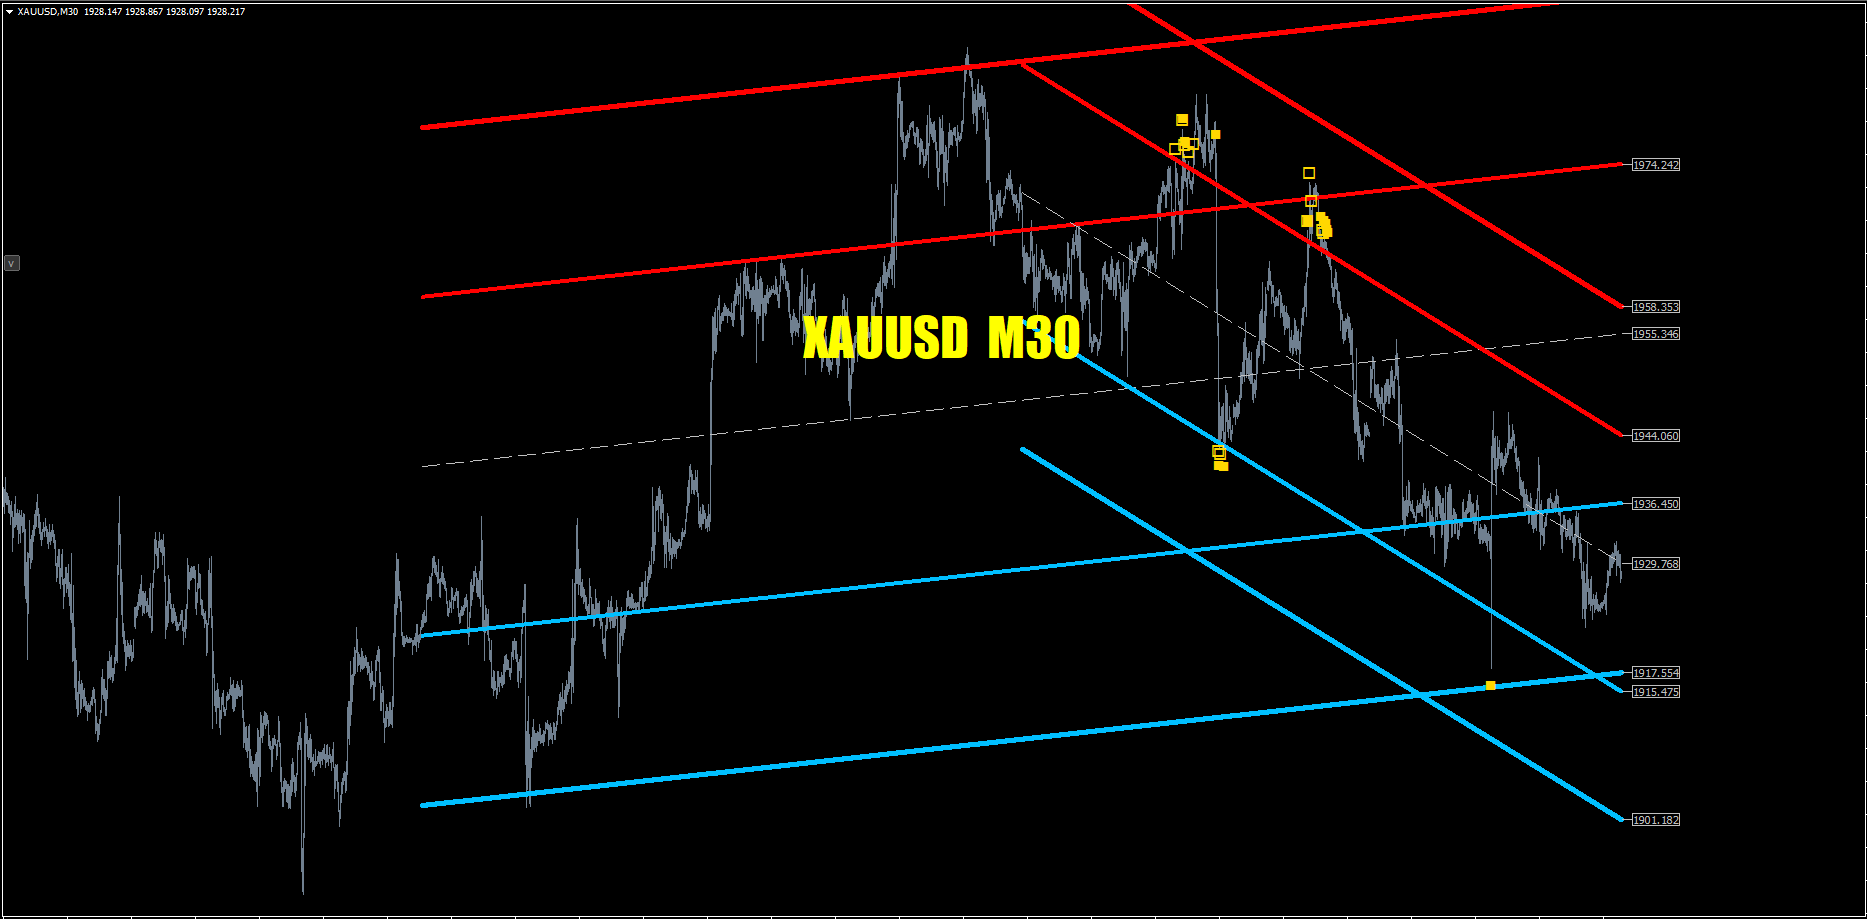
MT MERIT TLC (Trend Line Channel) :
The TLC indicator identifies reversal or breakout signals using plotted trend line channels relative to the current price.
It is tailored for manual traders who manage risk independently (Stop Loss, Take Profit, Risk-Reward).
Indicator for traders who prefer manual trading.
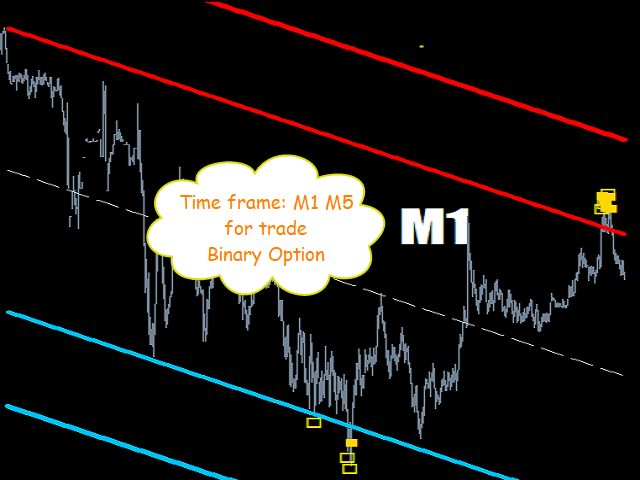
TIME FRAME: All Time Frame
SYMBOL PAIR: All Symbol
SETTINGS:
CALCULATE BARS: Value or bars used must be large enough to calculate trend line channel.
TREND LINE CHANNEL(TLC): Input the trendline distance multiplier.
For break out trading it's time to change the trend. Fundamentals analysis of the economy will give you an advantage.
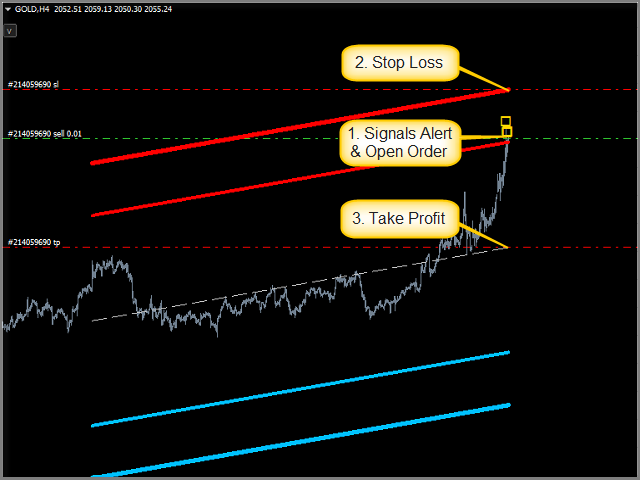
SHOW PRICE: Select ON|OFF (Price: SELL, BUY, SL, TP)
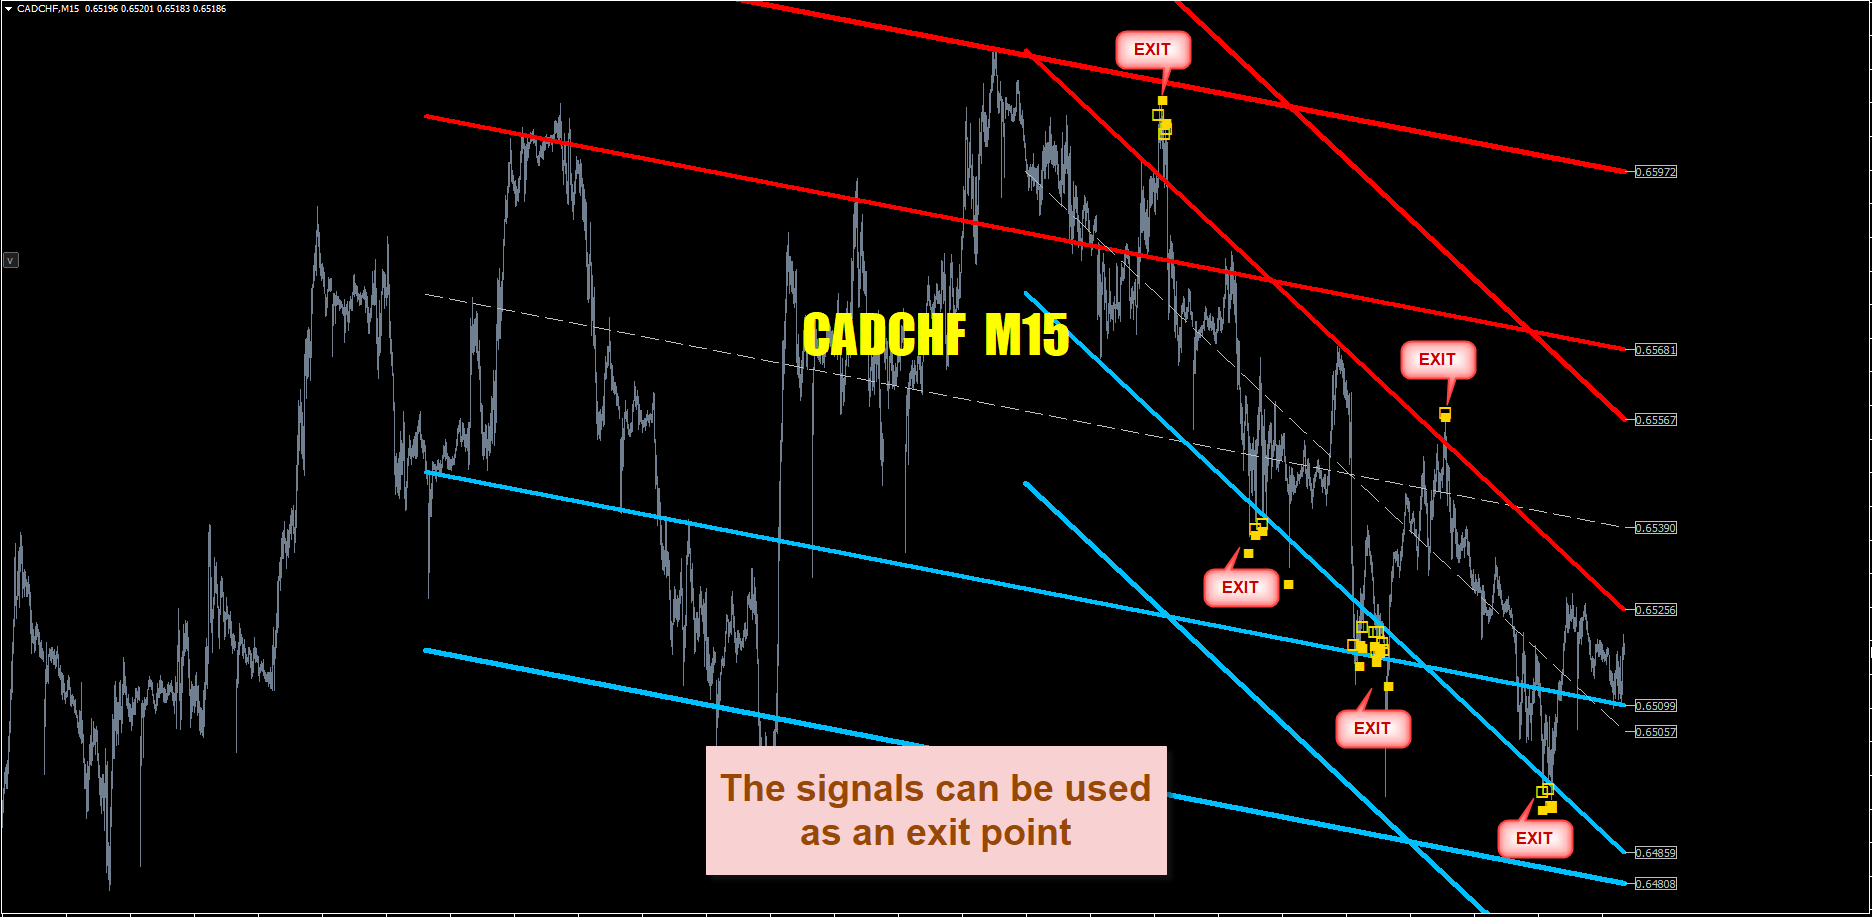
SIGNAL : There are 2 signals to choose : Signal break out trend line and Signal reverse trend line. You can design your own signals to buy or sell or exit.
(The signals can be used as an exit point)
SELL(Break Line Up)
BUY(Break Line Dn)
Signal_Break_ON
SELL(Reverse Line Up)
BUY(Reverse Line Dn)
Signal_Reverse_ON
ALERT: Popup, Mobile, Sound (Arrow display at the current time and Alert after close candle)
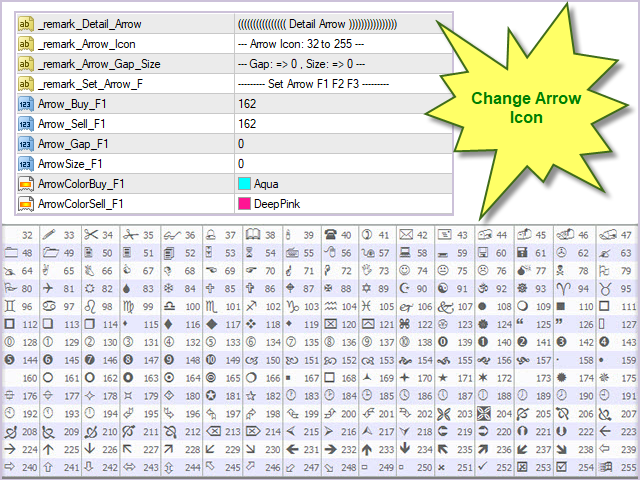
DETAIL ARROW and LINE: Refine the details in the display. Change Arrow: Icon, Size and Color
Arrow Signals and Trend Line Channel: repaint redraw and re-calculate follow the trendline that has changed. (It's normal. hope you can understand)
----------------------------------------------------------------------------
Business Hours: Monday to Friday, 10:00 a.m. to 3:00 p.m.
Feel free to reach out for any additional details or assistance!