Top and bottom patterns

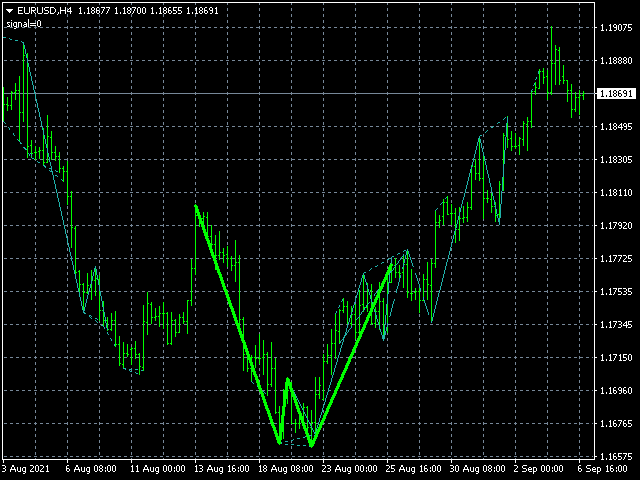
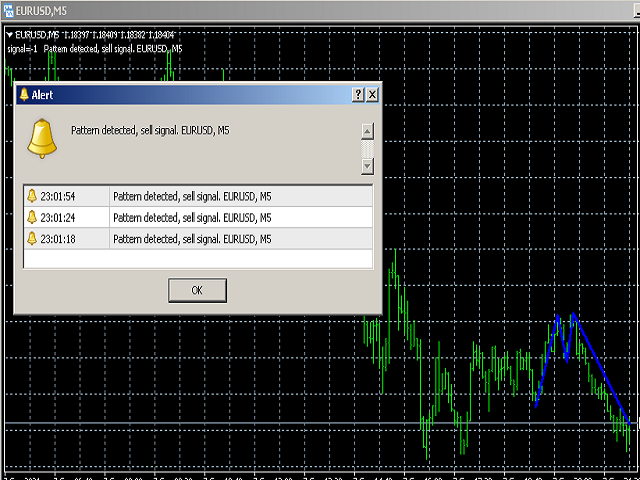
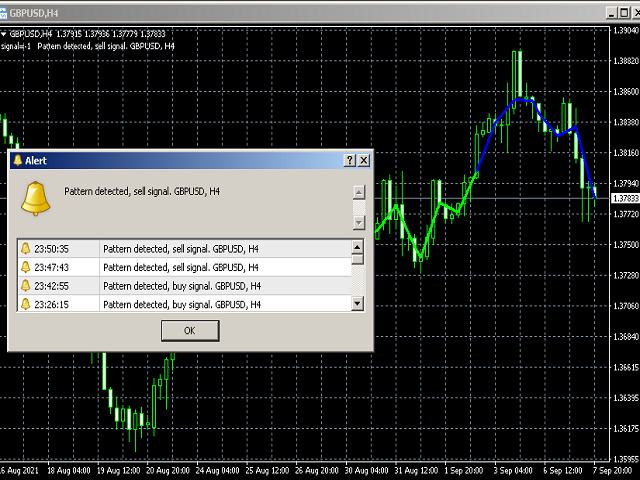
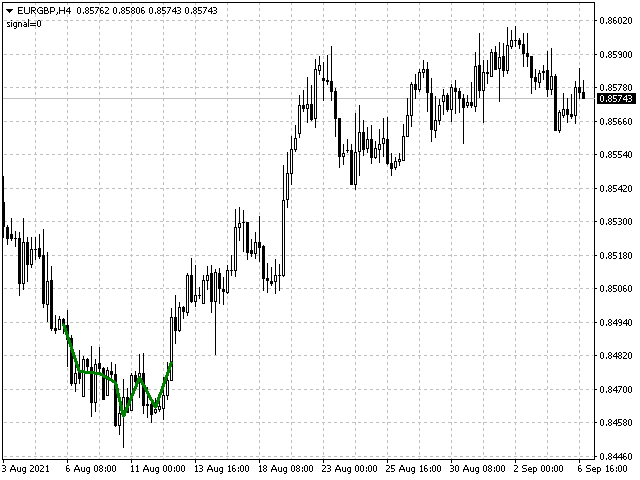
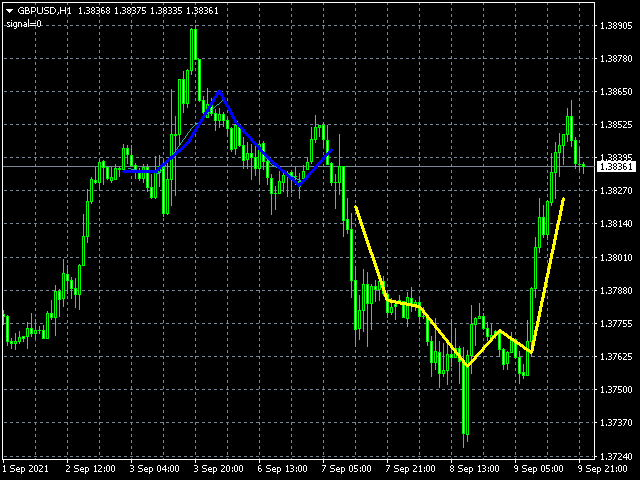
该指标发现技术分析反转模式,如双底、三重底、头肩顶及其相反的对应物。该指标将它们显示在货币对图表上,如果最近形成了一种模式,则可以向交易者发出信号。这使您可以快速检测可能的趋势反转或修正,在图表中添加一个指标就足够了,之后,您可以更改不同的时间范围以快速找到此类模式,如果没有找到这些模式,或者相反,不是位于历史上最好的地方,您可以更改参数以更好地显示某个货币对。此外,您可以更改显示图案的线条颜色,并启用未完全成型的图案线条的显示。

选项

  • History - 在图表上搜索形态的柱数;
  • ExtremCountBars - 搜索极值的柱数,例如,第二个峰值的高点(推荐 3-40);
  • MinExtremDist - 2 个极值之间的最小柱数(推荐 2-12,值越高,找到的形态越大);
  • MaxExtremDist - 2 个极值之间的最大柱数(推荐 10-50);
  • MultipleVerticesFilter - 过滤以找到“额外的”高点或低点(如果启用,应该只有 2 个顶部或底部);
  • PeriodMAforEdgeFiltering - 通过 MA 过滤双底和顶部形状的边缘,以便有平滑的上升或下降(0 - 关闭,推荐 0-10);
  • PriceDeviationsParam - 两个极端的货币对的最大价格偏差(取决于波动性)(该值越大,数字越可能变成曲线,但会更频繁地被发现);
  • PriceChangeBefore - 形态前的价格变化值应该小于形态本身的大小(建议从 1 到 2.5);
  • MaxPriceStrengthAfterPattern - 用于增加(和减少)与模式的最大价格背离的参数(例如,1.5 = 模式大小的 1.5 倍);
  • SelfTuningParametersCount - 尝试自整定参数的次数(可以更改多少次参数值搜索至少1个数字,建议0-10,0 - 禁用参数自整定);
  • PeriodMAforHeadS - 绘制“头肩”图(和倒版)的移动平均线的周期,0 - 模式关闭,建议使用 2-10(值越高,找到的模式的大小可以越大是);
  • DrawUnfinishedPatterns - 绘制未完成的模式(图表上的线条表明可能已形成模式);
  • EnableAlert - 当模式出现并爆发时启用警报;
  • AlertPeriodBars - 警报可以再次出现之前的柱数;
  • MaximumFigureShiftForAlert - 显示警报的图形与当前条的最大距离;
  • NeutralLinesClr - 中性线的颜色(启用 DrawUnfinishedPatterns 参数时显示);
  • FinalBuyPatternClr - 完成的买入形状的线条颜色;
  • FinalSellPatternClr - 完成的卖出形状的线条颜色。
推荐产品
Infinity Trend Pro
Yaroslav Varankin
1 (1)
This is a trend indicator without redrawing Developed instead of the binary options strategy (by the color of the Martingale candlestick) Also works well in forex trading When to open trades (binary options) A signal will appear in the place with a candle signaling the current candle It is recommended to open a deal for one candle of the current timeframe M1 and M5 When a blue dot appears, open a deal up When a red dot appears, open a trade down. How to open trades on Forex. When a signal is rec
Chinese (Simplified) 代码优势解释(不涉及具体代码) 1. 更精细的市场状态区分(三维) 大多数工具只显示“涨”或“跌”,但该工具特别分离出了**“盘整”(Sideways)**力量。交易者可以清晰看到: 买方主导时(多头)。 卖方主导时(空头)。 最重要的是: 市场无方向或休息时(盘整),有效减少震荡期的操作失误。 2. 强度量化震荡指标 (0-100) 将价格波动标准化为 0 到 100 的范围: 极端区域: 设定超买/超卖阈值(如高于80或低于20)。 区域填充: 对关键区域进行着色,一眼就能识别市场是否处于“峰值”。 3. 灵活的噪音过滤(平滑与加权) 设计用于自定义信号的“平滑度”: 减少误导信号: 提供多种平均算法(RMA, EMA, SMA 等)以过滤市场噪音。 成交量加权: 可选择加入**成交量(Volume)**进行计算,比单纯看价格更可靠。 4. 清晰的趋势提示 交叉箭头: 当买卖力量发生转换时显示箭头,明确入场时机。 可定制显示: 用户可开关线条、填充或箭头,保持图表整洁。 5. 性能与稳定性 优化了资源占用,修复了高 CPU 使用率问题,多开
An indicator of pattern #31 ("Long Island") from Encyclopedia of Chart Patterns by Thomas N. Bulkowski. The second gap is in the opposite direction. Parameters: Alerts - show alert when an arrow appears   Push - send a push notification when an arrow appears (requires configuration in the terminal) GapSize - minimum gap size in points ArrowType - a symbol from 1 to 17 ArrowVShift - vertical shift of arrows in points   ShowLevels - show levels ColUp - color of an upward line ColDn - color of a
这是一个预测蜡烛收盘价的指标。 该指标主要用于 D1 图表。 该指标适用于传统外汇交易和二元期权交易。 该指标可以用作独立的交易系统,也可以作为您现有交易系统的补充。 该指标分析当前蜡烛,计算蜡烛本身内部的某些强度因素,以及前一根蜡烛的参数。 因此,该指标预测市场走势的进一步方向和当前蜡烛的收盘价。 由于这种方法,该指标既适用于短期盘中交易,也适用于中长期交易。 该指标允许您设置指标在分析市场情况期间将产生的潜在信号的数量。 在指标设置中有一个特殊的参数。 此外,该指标可以通过图表上的消息、电子邮件以及推送通知的形式通知新信号。感谢您的关注!交易愉快! 购买后一定要写信给我! 我会给你我的交易指标的建议! 还可以获得奖金!
This is a new strategy for SUPPLY DEMAND areas It is based on a calculation using the tick volume to detect the big price action in market for both bear /bull actions this smart volume action candles are used to determine the supply and demand areas prices in between main supply and demand lines indicate sideway market  up arrows will be shown when prices moves above the main supply and the secondary supply lines Down arrows will be shown when prices moves below the main demand and the secondary
PZ Harmonacci Patterns
PZ TRADING SLU
3.17 (6)
可以说,这是您可以为MetaTrader平台找到的最完整的谐波价格形成自动识别指标。它检测19种不同的模式,像您一样认真对待斐波那契投影,显示潜在的反转区域(PRZ),并找到合适的止损和获利水平。 [ 安装指南 | 更新指南 | 故障排除 | 常见问题 | 所有产品 ] 它检测19种不同的谐波价格形态 它绘制了主要,衍生和互补的斐波那契投影(PRZ) 它评估过去的价格走势并显示每个过去的形态 该指标分析其自身的质量和性能 它显示合适的止损和获利水平 它使用突破来表明合适的交易 它在图表上绘制所有样式比率 它实现了电子邮件/声音/视觉警报 受斯科特·M·卡尼(Scott M. Carney)的书的启发,该指标旨在满足最纯粹和最熟练的交易者的需求。但是,它采取了一种使交易更容易的方式:在向交易发出信号之前,它会等待Donchian朝正确方向突破,从而使交易信号非常可靠。 斐波那契投影与向量无关 它实现了电子邮件/声音/推送警报 它绘制了ABCD投影 重要提示: 为了符合 Scott M. Carney先生 的商标申诉,某些图案名称已重命名为不言自明的替代方式, Scott M.
VR Cub
Vladimir Pastushak
VR Cub 这是获得高质量切入点的指标。该指标的开发是为了促进数学计算并简化对仓位入场点的搜索。多年来,该指标所针对的交易策略已被证明其有效性。交易策略的简单性是其巨大的优势,即使是新手交易者也能成功进行交易。 VR Cub 计算开仓点以及获利和止损目标水平,这显着提高了效率和易用性。查看使用以下策略进行交易的屏幕截图,了解简单的交易规则。 设置、设置文件、演示版本、说明、问题解决,可以从以下位置获取 [博客] 您可以在以下位置阅读或撰写评论 [关联] 版本为 [MetaTrader 5] 计算入场点的规则 开仓 要计算入场点,您需要将 VR Cub 工具从最后一个高点拉伸到最后一个低点。 如果第一个点在时间上早于第二个点,交易者等待柱线收于中线上方。 如果第一个点在时间上晚于第二个点,交易者等待柱线收于中线下方。 根据上述条件,严格在 柱线收盘 后建仓。 换句话说,如果我们在小时图上进行交易,那么从最高点到最低点的时间距离必须超过24小时,最高点和最低点之间的点数必须大于或等于平均价格变动每天。 维持和改变市场地位 可以有多个未平仓头寸;每个头寸都可以单独修改。 VR Cub
TWO PAIRS SQUARE HEDGE METER INDICATOR Try this brilliant 2 pairs square indicator It draws a square wave of the relation between your two inputs symbols when square wave indicates -1 then it is very great opportunity to SELL pair1 and BUY Pair2 when square wave indicates +1 then it is very great opportunity to BUY pair1 and SELL Pair2 the inputs are : 2 pairs of symbols         then index value : i use 20 for M30 charts ( you can try other values : 40/50 for M15 , : 30 for M30 , : 10 for H1 ,
BlueDigitsFx 官方生态系统入口 获取基础设施更新、交易资源、产品发布信息以及 BlueDigitsFx 官方生态系统访问权限。 Telegram 生态系统 官方网站 MT5 版本 BlueDigitsFx Spike And Strike Reversal MT4 —— 用于市场反转与动量分析的复合振荡指标 BlueDigitsFx Spike And Strike Reversal 是一款复合振荡指标,通过结合多个技术指标信号,帮助交易者识别潜在市场反转、动量变化以及趋势衰竭条件。 该指标整合了多种分析组件,包括基于振荡器的确认机制,并直接在图表上显示可视化信号,以支持结构化的市场反转分析。 Spike And Strike 专为希望在市场反转、回调和动量转换过程中获得额外确认的交易者而设计,适用于各种市场环境。 主要特点 基于振荡器的可视化反转分析 信号仅在K线收盘后确认,提高稳定性 适用于所有交易品种和时间周期 常用于 H1 及更高时间框架 内置提醒功能:弹窗、电子邮件、推送通知和声音提醒 可作为趋势和市场结构分析之外的额外确认层 如何使用 BlueDig
All Symbols   AND  All Time frames Scan                                                                                                                 Document Introduction   The ABCD is a basic harmonic pattern. The ABCD pattern is a visual, geometric chart pattern comprised of three consecutive price swings. It looks like a diagonal lightning bolt and can indicate an upcoming trading opportu
Super Reversal Pattern
Parfait Mujinga Ndalika
Super Reversal Pattern Indicator Unlock the power of advanced pattern recognition with our Super Reversal Pattern Indicator. Designed for traders seeking precision and reliability, this indicator identifies one of the most effective reversal patterns in technical analysis, offering a significant edge in your trading strategy. Key Features: Non-Repainting Accuracy: Enjoy the confidence of non-repainting technology. Once a Super Reversal Pattern is detected, it remains static, providing consiste
SMC Venom 模型 BPR 指標是針對在智慧貨幣 (SMC) 概念內工作的交易者的專業工具。它會自動辨識價格圖表上的兩種關鍵模式: FVG (公平價值缺口)是三根蠟燭的組合,其中第一根和第三根蠟燭之間存在缺口。它在水平之間形成一個沒有成交量支撐的區域,這通常會導致價格調整。 BPR (平衡價格區間)是兩種 FVG 模式的組合,形成一個「橋樑」 - 當價格以低成交量活動移動時,突破並返回到水平的區域,從而在蠟燭之間產生間隙。 這些模式可協助交易者透過分析圖表上的交易量和價格動態(大型市場參與者和普通參與者之間的互動)來識別關鍵的支撐/阻力位、突破區域和切入點。 此指標以矩形和箭頭的形式可視化模式,也支援靈活的警報設定。 主要特點: 模式顯示模式:選擇顯示 BPR 模式(看漲和看跌)或 FVG 模式(看漲和看跌)。 可以隱藏所有圖表分析模式。 以條數過濾:BPR 結構中 FVG 之間的最小/最大距離。 訊號的附加視覺化: 箭頭有 9 種類型可供選擇(標準、細、分形等)或手動輸入 Wingdings 代碼,其表格可以選擇性地顯示在圖表上。 使用 ATR 配置顏色、尺寸及其相對於價格
Pattern Searching
Kourosh Hossein Davallou
Pattern Searching: Smart, Precise, & Customizable for MT4!  Are you looking for a powerful tool to quickly and accurately identify trading patterns in Forex? This advanced indicator for MetaTrader 4 (MT4) is exactly what you need!  Key Features That Will Amaze You:  Automatic Classic Pattern Detection: This indicator automatically finds the closest classic Forex patterns for you. Whether you're looking for Smart Money Concepts (SMC) or NDS strategies, this tool covers it all!   * Popular patt
An indicator of patterns #24, #25, #26 and #27 ("Head and Shoulders", "Complex Head and Shoulders") from Encyclopedia of Chart Patterns by Thomas N. Bulkowski. Parameters: Alerts - show alert when an arrow appears   Push - send a push notification when an arrow appears (requires configuration in the terminal) PeriodBars - indicator period K - an additional parameter that influences the accuracy of pattern shape recognition. The smaller the value is, the smoother the row of peaks/valleys should
For this set of indicators 1. General information     - Calculates with high performance mathematical algorithms.     - Calculated from the price of candles     - The entry point of this order is filtered by the train EMA and the oscillator.     - Calculate the integrity of the candle 2. How does it work?     - You can see two types of order entry points: the notification on the monitor and the arrow.     - You can trust 75-95 percent of this entry point. 3. Settings     - Retracement is retr
Gold Phoenix
Yaroslav Varankin
The perfect tool for Scalng in the Forex markets You can trade both from signal to signal and using take profit  The algorithm does not use Zigzag!  No redrawing!  This is a channel instrument that uses a moving average as a filter. Moving Average  There are 2 parameters for the settings Ma Period = 5 period Moving Average  Channel 1.0 distance of channel lines from the chart Price Signal Filter - calculation of signal opening and filter There is a complete set of Alert There is a multi-timefram
The Master Figures indicator analyzed the market for the most common chart patterns. The first pattern is called Pin bar . This pattern can rightly be considered one of the most widespread. This pattern looks like a candle with a small body and large tail (wick). Once you see it on the chart, open a position against the wick. It is better to use the resistance lines for closing. Master Figures shows this pattern in the form of circles. A position should be opened when a new candle appears after
Awesome Oscillator by Bill Williams with the ability to fine-tune and replace the averaging algorithms of the indicator, which significantly expands the possibilities of using this oscillator in algorithmic trading and brings it closer in its properties to such an indicator as the MACD. To reduce price noise, the final indicator is processed with an additional Smooth averaging. The indicator has the ability to give alerts, send mail messages and push signals when the direction of movement of th
Wave Wolf MT4
Andrei Salanevich
Wave Wold MT4外汇指标旨在搜索狼波并将其显示在交易终端的当前窗口中。 对于在交易中使用狼波的交易者来说,这是一个很好的指标。 它在交易策略中的应用将显着提高其效率和盈利能力。 有关指标的信息 与其他Wolf wave指标不同,Wave Wold MT4外汇指标具有许多显着提高其有效性的功能: 第一个是打开的Windows5point参数(真值)提供信息支持,即扩展了狼波出现在其上的图表的窗口。 例如,如果EURUSD、AUDUSD和GBPUSD图表是开放的,并且每个图表都安装了Wave WOLD MT4指标,那么如果检测到欧元模型,相应的图表将自动被带到其他图表的顶部,这在交易大量工具时变得非常方便。  第二个功能是MACD上的内置发散分析,用户可以自己选择参数(默认设置(12,26,9))。 顺便说一下,通常振荡器的值不显示在工作窗口上,只反映在形成点(5)时的价格标签的颜色上,特别是,如果标签的颜色是蓝色,则没有发散,如果颜色是红 如何使用指标 Wave WOLD MT4指标显示第4个形成点的假设Wolf模型和第5个点的形成区域(所谓的甜区,以黄色显示)。 如
Blahtech Market Profile
Blahtech Limited
4.53 (15)
Was: $249  Now: $99   Market Profile defines a number of day types that can help the trader to determine market behaviour. A key feature is the Value Area, representing the range of price action where 70% of trading took place. Understanding the Value Area can give traders valuable insight into market direction and establish the higher odds trade. It is an excellent addition to any system you may be using. Blahtech Limited presents their Market Profile indicator for the MetaTrader community. Ins
Gap island
Dmitry Fedoseev
An indicator of pattern #30 ("Island Reversal") from Encyclopedia of Chart Patterns by Thomas N. Bulkowski (two gaps, the second gap is in the direction of the first one). Parameters: Alerts - show alert when an arrow appears   Push - send a push notification when an arrow appears (requires configuration in the terminal) GapSize - minimum gap size in points ArrowType - a symbol from 1 to 17 ArrowVShift - vertical shift of arrows in points   ShowLevels - show levels ColUp - color of an upward lin
Trend Deviation
VLADISLAV AKINDINOV
Trend indicator with calculation of dynamic levels and signaling their intersection. Description of input parameters: StepTF = true; - Calculation of the indicator by closing the bar (true) or by each tick (false) BarsCount = 300; - Number of settlement bars Price = PRICE_CLOSE; - Type of price used TimeFrame = PERIOD_CURRENT; - Estimated timeframe TrendPeriod = 9; - Trend calculation period TrendDeviations = 4.9; - coefficient of deviation PeriodTrendSmooth = 1; - Trend smoothing perio
Trend Bilio
Ivan Simonika
Trend Bilio - an arrow indicator without redrawing shows potential market entry points in the form of arrows of the corresponding color: upward red arrows suggest opening a buy, green down arrows - selling. The entrance is supposed to be at the next bar after the pointer. The arrow indicator Trend Bilio visually "unloads" the price chart and saves time for analysis: no signal - no deal, if an opposite signal appears, then the current deal should be closed. It is Trend Bilio that is considered
Monster Harmonic Indicator
Paul Geirnaerdt
4.59 (29)
Monster Harmonics Indicator is a harmonic pattern indicator. It recognizes Gartley, Bat, Crab, Butterfly, Cypher, White Swan, Black Swan, Shark and several other patterns. Projected patterns that are not yet completed are recognized, too. Monster even shows the PRZ (Potential Reversal Zone). Users can add their own user defined patterns to Monster. Besides the current pattern, Monster also shows all patterns in the symbols history. Monster will provide alerts for developing patterns. Introduced
我们为您提供一个指标"蜡烛收盘台",它将成为您在贸易领域不可或缺的助手。 这就是为什么知道蜡烛何时关闭会有所帮助的原因: 如果你喜欢使用蜡烛花纹进行交易,你就会知道蜡烛何时关闭。 此指标将允许您检查是否形成了已知模式以及是否存在交易的可能性。 该指标将帮助您做好市场开放和市场关闭的准备。 可以设置一个计时器来创建计划新闻的预览,这样就可以检查市场对此的反应。 您可以设置指示灯,以便在蜡烛关闭前几秒钟发送警报/警告。 通知/警报/警报可以发送到: 屏幕警报 电子邮件 移动应用 MT4烛台计时器指示器为什么有用 那么烛台计时器什么时候有用呢?如果你长期交易,你可能不需要蜡烛计时器指示器,因为你的参赛不会受到一分钟或一小时的太大影响。但是,如果你在短时间内是黄牛或交易员,那么你知道时机非常重要。 外汇市场24小时开放,只在周末关门,有些策略可能会受到您入仓时出现错误时机的严重影响。 MT4蜡烛计时器指示器可以显示当前蜡烛中的剩余时间,以便为下一次蜡烛打开做好准备。 可以从这一指标中受益的一些情况例子有: 预定消息传出 地理市场开闭 预定发生的事件,通常是金融、经济或政治事件
Overview Harmonic Patterns MT4 is a technical analysis indicator designed for the MetaTrader 5 platform. It identifies and displays harmonic price patterns, such as Butterfly, Cypher, Crab, Bat, Shark, and Gartley, in both bullish and bearish directions. The indicator calculates key price levels, including entry, stop loss, and three take-profit levels, to assist traders in analyzing market movements. Visual elements and customizable alerts enhance usability on the chart. Features Detects six ha
Crypto_Forex 指标“晨星模式”适用于 MT4。 - 指标“晨星模式”是价格行为交易的非常强大的指标:无需重绘,无延迟。 - 指标检测图表上的看涨晨星模式:图表上的蓝色箭头信号(见图片)。 - 带有 PC、手机和电子邮件警报。 - 还有它的兄弟 - 看跌“黄昏之星模式”指标可用(点击以下链接)。 - 指标“晨星模式”非常适合与支撑/阻力位结合使用。 ................................................................................................................. 点击这里查看高质量的交易机器人和指标! 这是仅在此 MQL5 网站上提供的原创产品。
Laguerre SuperTrend Clouds adds an Adaptive Laguerre averaging algorithm and alerts to the widely popular SuperTrend indicator. As the name suggests, Laguerre SuperTrend Clouds (LSC) is a trending indicator which works best in trendy (not choppy) markets. The SuperTrend is an extremely popular indicator for intraday and daily trading, and can be used on any timeframe. Incorporating Laguerre's equation to this can facilitate more robust trend detection and smoother filters. The LSC uses the impro
Crypto_Forex MT4 指标“三只黑乌鸦形态”,无需重绘,无延迟。适用于下跌趋势市场! ....................................................................... - “三只黑乌鸦形态”指标对于价格行为交易非常有效。 - 指标可检测图表上看跌的“三只黑乌鸦形态”:图表上显示红色箭头信号(见图)。 - 支持 PC、手机和电子邮件提醒。 - 其兄弟——看涨的“三白兵形态”指标也已推出(点击下方链接)。 - “三只黑乌鸦形态”指标非常适合与支撑/阻力位结合使用。 ................................................ 点击这里查看高质量的交易机器人和指标! 这是仅在 MQL5 网站上提供的原创产品。
QuantumEdge Trader
Hossam Ali Ahmed Ali
QuantumEdge Trader v1.0 AI-Powered Precision Signals for Serious Traders QuantumEdge Trader is a smart and reliable indicator that delivers accurate BUY and SELL signals using advanced market analysis and trend detection. Designed for M1 to M60 timeframes, it's ideal for scalping and intraday strategies. --- Key Features: No Repaint – Signals never change after appearing Smart trend filters to reduce noise Adjustable sensitivity and alerts Perfect for XAUUSD, EURUSD, and m
该产品的买家也购买
Neuro Poseidon MT4
Daria Rezueva
4.95 (37)
Neuro Poseidon is a new indicator by Daria Rezueva. It combines precise trading signals with adaptive TP/SL levels - creating best possible trades as a result! Message me and get  Neuro Poseidon Assistant  as a gift to automize your trading process! What makes it stand out? 1. Proven profitability on all assets and timeframes 2. Only confirmed BUY and SELL signals present on the chart 3. Adaptive TP & SL levels generated by the software for each trade 4. Easy to understand - suitable for all
Gann Made Easy
Oleg Rodin
4.84 (165)
Gann Made Easy 是一个专业且易于使用的外汇交易系统,它基于使用先生理论的最佳交易原则。 W.D.江恩。该指标提供准确的买入和卖出信号,包括止损和获利水平。您甚至可以使用推送通知在旅途中进行交易。 购买后请联系我,即可免费获得交易指导和超棒的额外指标! 您可能已经多次听说过江恩交易方法。通常 Gann 的理论不仅对于新手交易者而且对于那些已经有一定交易经验的人来说都是非常复杂的东西。这是因为江恩的交易方法在理论上并不那么容易应用。我花了几年时间来完善这些知识,并将最好的原则应用到我的外汇指标中。 该指标非常易于应用。您所需要的只是将其附加到您的图表并遵循简单的交易建议。该指标不断进行市场分析工作并寻找交易机会。当它检测到一个好的入口点时,它会为您提供一个箭头信号。该指标还显示止损和获利水平。 换句话说,当您像先生一样进行交易时,该指标会为您提供最佳江恩建议。江恩亲自告诉你此时此刻该做什么。但最好的部分是您不需要了解任何有关江恩交易原则的知识,因为该指标会为您完成整个市场分析工作。
Trend Catcher ind
Ramil Minniakhmetov
5 (3)
趨勢捕捉指標 趨勢捕捉指標結合了作者獨有的客製化自適應趨勢分析指標,用於分析市場價格趨勢。它透過過濾掉短期噪音,並專注於潛在的動能強度、波動性擴張和價格結構行為,來識別真實的市場方向。此外,它還結合了平滑和趨勢過濾等客製化指標,例如移動平均線、相對強弱指標 (RSI) 和波動率過濾器。 您可以在這裡查看實際運行情況以及我的其他產品: https://www.mql5.com/en/users/mechanic/seller 請注意,我不會在 Telegram 上出售 EA 或任何設置,那是騙局。所有設定都可以在我的部落格上免費取得。 重要提示!購買後請立即聯繫我,以獲取使用說明和額外獎勵! 請注意,我不會在 Telegram 上出售 EA 或任何設置,那是騙局。所有設定都可以在我的部落格上免費取得。
Dynamic Forex28 Navigator
Bernhard Schweigert
4.43 (7)
Dynamic Forex28 Navigator - 下一代外汇交易工具。 当前 49% 折扣。 Dynamic Forex28 Navigator 是我们长期流行的指标的演变,将三种功能合二为一: 高级货币强度 28 指标 (695 条评论)+ 高级货币 IMPULSE 带警报 (520 条评论)+ CS28 组合信号(奖励)。 有关指标的详细信息 https://www.mql5.com/en/blogs/post/758844 下一代强度指标提供什么? 您喜欢的原始指标的一切,现在通过新功能和更高的精度进行了增强。 主要特点: 专有货币强度公式。  所有时间范围内的平滑和准确的强度线。 非常适合识别趋势和精确进入。 动态市场斐波那契水平(市场斐波那契)。  此指标独有的独特功能。 斐波那契应用于货币强度,而不是价格图表。 适应实时市场活动以获得准确的反转区域。 实时市场动量。  第 9 行显示市场是活跃还是被动。 对于定时交易至关重要。 全面的警报和显示。  每种货币最强的买入和卖出动量。 ​​28 对的双重动量买入和卖出。 超买/超卖警告外部范围和止损。 反转
M1 Sniper
Oleg Rodin
5 (24)
M1 SNIPER 是一款易于使用的交易指标系统。它是一个专为 M1 时间框架设计的箭头指标。该指标可以作为独立的系统在 M1 时间框架下进行剥头皮交易,也可以作为您现有交易系统的一部分使用。虽然该交易系统专为 M1 时间框架交易而设计,但它也可以用于其他时间框架。我最初设计此方法是为了交易 XAUUSD 和 BTCUSD。但我发现这种方法在其他市场交易中也同样有用。 指标信号既可以顺势交易,也可以逆势交易。我教授一种特殊的交易技巧,帮助您利用指标信号进行双向交易。该方法基于使用特殊的动态支撑位和阻力位区域。 购买后,您可以立即下载 M1 SNIPER 箭头指标。此外,我还为所有 M1 SNIPER 工具用户免费提供下方屏幕截图所示的 Apollo Dynamic SR 指标!这两个指标的组合可以帮助您更轻松、更准确地利用 M1 时间框架进行交易。 购买后请联系我,免费获取交易提示和奖励指标! 祝您交易成功!
MetaBands M4
Vahidreza Heidar Gholami
3.5 (6)
MetaBands使用强大且独特的算法绘制通道并检测趋势,以便为交易者提供进出交易的潜在点。它是一个通道指标和强大的趋势指标。它包括不同类型的通道,可以通过使用输入参数简单地合并以创建新通道。MetaBands使用所有类型的警报通知用户市场事件。 功能 支持大多数通道算法 强大的趋势检测算法 能够合并不同类型的通道 多时间帧和多货币(信号矩阵) 所有类型的警报功能(声音、屏幕闪烁、推送通知、电子邮件、弹出窗口、箭头) 它永远不会重绘 趋势检测 MetaBands使用在通道内振荡的蓝色线来检测趋势。当该线遇到通道的上界时,表明开始下跌趋势,当它遇到下界时,表明开始上涨趋势。如果蓝线接近中线,则市场处于整理期。 该指标使用独特的方法来检测趋势。一开始可能看起来有些复杂,但如果您观看视频教程,您就会意识到它是多么强大且易于使用。 入场和出场信号 当趋势变化或价格穿过上下通道时,MetaBands会立即通过不同的方法提醒交易者,这些方法可以在指标设置中启用。 信号矩阵 要监视来自不同时间框架的多个符号并在一个地方查看信号,请单击右上角按钮或按键盘上的M键以打开信号矩阵。该矩阵可以快速概览
本产品已针对 2026 年市场进行更新,并针对最新 MT5 版本进行了优化。 价格更新通知: Smart Trend Trading System 目前价格为 $99 。 接下来的 30 次购买 后,价格将上涨至 $199 。 特别优惠: 购买 Smart Trend Trading System 后,请发送私信给我,即可免费领取 Smart Universal EA ,并将您的 Smart Trend 信号转换为自动交易。 Smart Trend Trading System 是一套完整的交易系统,具备不重绘、不回绘、不延迟的特点,专为希望获得更清晰信号、更准确趋势方向以及更有组织交易方式的交易者打造。 Online course , manual and download presets . 它将 10 多种交易工具 整合到一个系统中,包括趋势检测、反转区域、Smart Cloud、移动止损逻辑、支撑与阻力、K线着色、提醒以及多周期分析。 该系统旨在帮助您应对不同的市场环境: 趋势市场: 识别主要趋势,发现回调,跟随动能,并通过止损指导和移动止损选项寻找更清晰的入场机会。 震荡
Advanced Supply Demand
Bernhard Schweigert
4.91 (300)
现在优惠 30%! 任何新手或专业交易者的最佳解决方案! 该指标是一款独特、高质量、且价格合理的交易工具,因为我们已经整合了许多专有功能和新公式。 依据此更新,您将能够显示双重时间帧区域。 您不仅可以显示一个较高的时间帧,还可以同时显示图表时间帧,加上更高的时间帧:显示嵌套时区。 供需双方所有交易者都会喜欢它。 :) 重要信息披露 高级供需的最大潜力,请访问 https://www.mql5.com/zh/blogs/post/720245   想象您的交易如何得以改善,是因为您能够精准定位入场或目标位吗? 构建于新的底层算法,它可以更轻松地识别出买卖双方之间的潜在失衡。 这是因为它以图形方式展示供需最强劲区域,及其过去的表现(显示旧区域)。 这些功能旨在帮助您更轻松地发现最佳入场区域和价位。 现在您可以针对您的交易品种和时间帧来优化和编辑区域强度! 高级供需指标适用于所有产品和时间帧。 它是一个新的公式,非常新的功能是两个区域强度函数可由用户输入进行调整! 这在交易中是一大优势。 当您学习如何使用专有功能,例如带有价格游离最小 X 因子的区域强度时,您能够判断该区域强劲与否。 供需
Scalper Inside PRO
Alexey Minkov
4.68 (69)
Scalper Inside PRO Scalper Inside PRO 是一款日内趋势与剥头皮指标,采用独家的内置算法来评估市场方向和关键目标位。该指标会自动计算进场点、出场点以及多个止盈目标位,并显示详细的绩效统计数据,让您能够看到不同品种和策略在历史数据上的表现。这有助于您选择符合当前市场状况的交易品种。您还可以将自己的箭头指标连接到 Scalper Inside PRO,并快速查看它们的统计数据和历史信号。 Scalper Inside PRO 使用手册及参数说明: 点击阅读 该指标适用于任何品种和时间周期(日内交易推荐使用 M5),并包含多种内置策略。它既可作为独立的剥头皮工具使用,也可作为您交易系统的分析组件。 主要功能 基于独家的新一代趋势检测算法 Next-Generation Trend Detection Algorithm (NG TDA) 进行趋势识别。 自动计算进场点和出场点,并提供多级止盈目标(TP1、TP2、TP3)。 三种内置策略和一个优化器,用于将信号适配到当前品种和时间周期(仅在实时模式下可用)。 提供品种和策略在历史数据上的详细绩效统计。 提
Genesis Matrix Pro is a professional multi-timeframe trend detection indicator designed to help traders identify high-quality market alignment with clarity and structure. It combines 12 different technical indicators into one visual alignment matrix, allowing traders to quickly see when market conditions are bullish, bearish, or neutral. A signal is generated only when the selected strategies are aligned, helping reduce noise and improve decision-making. PLEASE CONTACT ME AFTER PURCHASE TO GET
Gann 方块指标是一种强大的市场分析工具,基于 W.D. Gann 在其“市场预测数学公式”一文中介绍的数学概念。该指标融合了与平方数(如 144、90 和 52)有关的 Gann 技术,以及平方 9。此外,它还融入了  关于如何将平方 9 与通道和星形图案结合使用的方法。 用户手册和使用方式: 在使用该指标之前,我们建议您阅读用户手册,并与我们联系以获得任何澄清。您可以在我们的网站上找到完整的用户手册。 该指标提供了 MT5 的完整版本供购买,也提供了 MT4 的免费版本供测试。提供了两个版本的链接供您方便使用。 主要特点和功能: Gann 方块指标为您的交易环境提供了全套工具,使您能够基于几何图案和 Gann 的概念做出明智的决策。以下是主要特点: 平方 9 分析: 该指标可以绘制与平方 9 有关的各种元素,包括水平线、星形图案、网格、Gann 扇形等。这在您的图表上提供了 Gann 的几何概念的视觉表示。 Gann 方块: 该指标绘制了 Gann 方块 52、90 和 144,使您能够可视化和分析它们与价格走势的关系。 自由 Gann 星形图案: 该指标使您能够直接在图表上绘制
Breakout Arrows Mt4
Michael Oko Oboh
5 (1)
Trend Breakout Arrows Indicator The Trend Breakout Arrows Indicator is a momentum-based signal tool designed to identify potential bullish and bearish breakout opportunities. It displays clear arrow signals directly on the price chart, helping traders quickly recognize possible trend changes and continuation setups. Up Arrow (Buy Signal) A magenta up arrow appears below a candle when bullish momentum begins to strengthen. This signal indicates that buying pressure may be overtaking selling press
Neo Wave PRO
Nikolay Raykov
5 (1)
Price & Time Market Structure Indicator A professional market structure tool that analyzes waves through both price and time — not price alone. Main Description NeoWave PRO is a professional market structure indicator for MetaTrader 4 designed for traders who want to move beyond traditional one-dimensional wave tools such as ZigZag, swing indicators, and basic high/low systems. Most wave indicators analyze only one thing: Price. But a real market wave is not only a price movement. A true wave de
BTMM State Engine Pro MT4
Garry James Goodchild
BTMM State Engine Pro is a MetaTrader 4 indicator for traders who use the Beat The Market Maker approach: Asian session context, kill zone timing, level progression, peak formation detection, and a multi-pair scanner from a single chart. It combines cycle state logic with a built-in scanner dashboard so you do not need the same tool on many charts at once. What it does Draws the Asian session range; session times can follow broker server offset or be set in inputs. Tracks level progression (L
GOLD Impulse with Alert
Bernhard Schweigert
4.67 (12)
这个指标是我们2个产品 Advanced Currency IMPULSE with ALERT  +   Currency Strength Exotics 的一个超级组合。 它适用于所有时间框架,并以图形方式显示8种主要货币和一种符号的强势或弱势冲动! 该指标专门用于显示任何符号的货币强度加速,如黄金、异国货币对、商品、指数或期货。这是它的第一个指标,任何符号都可以被添加到第9行,以显示黄金、白银、石油、DAX、US30、MXN、TRY、CNH等的真实货币强度加速(冲动或速度)。 建立在新的基础算法上,它使识别和确认潜在的交易更加容易。这是因为它以图形方式显示了一种货币的强势或弱势是否正在加速,并测量了这种加速的速度--把它想象成你汽车中的速度表。当你加速时,事情显然会发生得更快,这在外汇市场上也是一样的,即如果你配对的货币正在向相反的方向加速,你就会发现一个潜在的有利可图的交易。 动态市场斐波那契28水平被用作警报触发器,将适应市场活动。如果冲动击中黄色触发线,你将收到警报。然后你就知道作为一个交易员应该做什么。货币对和方向已经给出。只需点击警报按钮,就可以切换到该货
PRO Renko System
Oleg Rodin
5 (30)
PRO Renko Arrow Based System for trading renko charts.  准确的信号交易任何外汇工具. 另外,我将免费提供系统的附加模块! PRO Renko系统是RENKO图表上高度准确的交易系统。该系统是通用的。 该交易系统可应用于各种交易工具。 该系统有效地中和了所谓的市场噪音,打开了获得准确反转信号的通道。 该指标易于使用,只有一个参数负责产生信号。 您可以很容易地使算法适应您感兴趣的交易工具和renko酒吧的大小。 我很乐意通过提供任何咨询支持来帮助所有客户有效地使用该指标。 祝您交易成功!购买后,立即写信给我! 我将与您分享我的建议和我的renko发电机。 另外,我将免费提供系统的附加模块!
Advanced Currency Strength28 Indicator
Bernhard Schweigert
4.91 (657)
目前40%的折扣 任何新手或专家交易者的最佳解决方案! 这个指标是一个独特的、高质量的、可负担得起的交易工具,因为我们纳入了一些专有的功能和一个新的公式。只需一个图表,你就可以读出28个外汇对的货币强度!想象一下,你的交易将如何得到改善,因为你的交易是在你的手中进行的。想象一下,你的交易将如何改善,因为你能够准确地确定新趋势或剥头皮机会的触发点? 用户手册:点击这里  https://www.mql5.com/en/blogs/post/697384 这是第一本,原版的! 不要买一个毫无价值的崇拜者的克隆品。 特别的 子窗口中的箭头显示强劲的货币势头GAP将指导你的交易! 当基础货币或报价货币处于超卖/超买区域(外盘斐波那契水平)时,在个人图表的主窗口中出现警告信号。 当货币力量从外围区间回落时,回撤/反转警报。 十字星模式的特别警报 可选择多个时间框架,以快速查看趋势! 货币强度线在所有的时间框架中都非常平稳,当使用较高的时间框架来识别总体趋势,然后使用较短的时间框架来确定精确的入口时,效果非常好。你可以根据自己的意愿选择任何时间框架。每个时间框架都由其自身进行了优化。
The indicator scans for Dinapoli thrust pattern in multiple timeframes for the all markets filtered and shows the results on Dashboard. Key Features Dashboard can be used for all markets It can scan for thrust pattern on MN1, W1, D1, H4, H1, M30, M15 ,M5, M1 timeframes Ability to choose number of bars required above/below displaced moving average to define thrust Parameters UseMarketWatch: Set true to copy all symbols available in market watch MarketWatchCount : Set the number of symbols that
本指标是实践实战交易完善的波浪自动分析的指标 !  案例... 注: 波浪分级用西方叫法不习惯,因受到缠论(缠中说禅)命名方式习惯的影响,我是将基础波浪命名为 笔 ,将二级波段命名为 段 ,同时具有趋势方向的段命名为 主趋段 (以后笔记中都是这种命名方式,先告知大家),但是算法上和缠论关系不大切勿混淆.反映的是本人分析盘面总结的 千变万化纷繁复杂的运行规律 . 对波段进行了标准化定义,不再是不同人不同的浪  ,    对人为干扰的画法进行了排除,在严格分析进场起到了关键的作用 . 使用这个指标,等于将交易界面提升美感,抛弃最原始的K线交易带你进入新的交易层次.如果不是为了交易,在宣传上也将使客户观感提升层次. 指标内容: 1. 基础波浪 (笔) : 首先我们找出了价格波动过程中的基础波动拐点,当然他的有序性低,为下一步的计算提供基础. 2. 二级波段( 段 ) :在基础波浪的基础上,通过算法分析得到层级更明显的二级波段,二级波段为波浪提供了分析基础 3. 波浪( 浪 ): 有着更清晰的趋势,更清晰直观的方向.分析一个波浪是否延续,需要看二级波段的形态,分析二级的构成,可以得出波浪
Harmonic Pattern Plus MT4
Young Ho Seo
4.44 (18)
Introduction Harmonic Patterns are best used to predict potential turning point. Traditionally, Harmonic Pattern was identified manually connecting peaks and troughs points in the chart. Manual harmonic pattern detection is painfully tedious and not suitable for everyone. You are often exposed under subjective pattern identification with manual pattern detection. To avoid these limitations, Harmonic Pattern Plus was designed to automate your harmonic pattern detection process. The functionality
Current event:  https://c.mql5.com/1/326/A2SR2025_NoMusic.gif A. 什么是 A2SR ?   * 这是一个领先的技术指标(没有重绘,没有滞后)。  -  指导 : -- 在  https://www.mql5.com/en/blogs/post/734748/page4#comment_16532516 -- 和  https://www.mql5.com/en/users/yohana/blog A2SR 在确定支撑(需求)和阻力(供应)水平方面有一种特殊的技术。 与我们在网上看到的普通方式不同,A2SR 在确定实际 SR 级别时有一个独创的概念。 原技术不是从网上拿来的,也没有在网上公开过。 A2SR 将根据您的交易风格自动选择 SR 级别。 即使您正在更改时间范围,但 SR 级别仍将保留在其位置上。 因为实际的 SR 不是从你使用的时间范围内获得的。 A2SR 拥有完整的交易工具 。 实际支持(需求)和阻力(供应)的真正概念。 新闻事件和央行讲话的市场情绪。 新闻事件和趋势的主要货币强度 (MCS) 的真正概念
KT Alpha Hunter Arrows MT4
KEENBASE SOFTWARE SOLUTIONS
大多数箭头指标只给你一个信号,然后把剩下的判断全部留给你自己。KT Alpha Hunter Arrows 给你的,是一套完整的交易计划。 每一个信号箭头出现时,图表上都会同时绘制完整计划:入场线、止损位、四个止盈目标,以及实时 Edge 结论,告诉你当前品种和时间周期是否值得交易。套装中还包含 Trade Manager EA,在你手动入场后负责后续执行,让你在市场波动和情绪干扰下依然保持纪律。非重绘。只在K线收盘后给出信号。适用于 Forex、黄金、指数,以及你交易的其他任何品种。 核心功能 非重绘买入和卖出箭头,只在K线收盘后出现。 每个信号都带有入场线、结构性止损和四个止盈目标。 Edge Dashboard 会分别评估当前图表上的买入和卖出机会。 结论系统:No Edge、Marginal、Tradeable、Good 或 Strong。 一键 Auto Optimize 按钮,可根据当前品种和时间周期自动调整设置。 完整套装包含 Trade Manager EA,并内置五种专为本指标设计的交易管理方案。 Prop Firm Risk Panel 可在图表上实时追踪日内回撤
Market Structure Patterns MT4
Samuel Manoel De Souza
5 (18)
Market Structure Patterns   is an indicator based on   smart money concepts   that displays   SMC/ICT   elements that can take your trading decisions to the next level. Take advantage of the   alerts ,   push notifications   and   email messages   to keep informed from when an element is formed on the chart, the price crosses a level and/or enters in a box/zone. Developers can access the values of the elements of the indicator using the   global variables  what allows the automation of trading d
PZ ABCD Retracement
PZ TRADING SLU
4 (5)
该指标找到AB = CD回撤形态。 AB = CD回调模式是一种4点价格结构,其中初始价格区间被部分回调,然后与回调完成后等距移动,这是所有谐波模式的基本基础。 [ 安装指南 | 更新指南 | 故障排除 | 常见问题 | 所有产品 ] 可定制的图案尺寸 可定制的AC和BD比率 可定制的突破时间 可定制的线条,颜色和大小 它根据CD纤维水平显示SL和TP水平 视觉/声音/推送/邮件警报,用于模式和突破 AB = CD Retracements可以扩展和重新绘制很多内容。为了使事情变得更容易,该指标实施了一个转折:它在向交易发出信号之前等待正确方向的Donchian突破。最终结果是带有非常可靠的交易信号的重新粉刷指示器。输入donchian突破时段作为输入。 看涨回撤是蓝色的 空头回撤是红色的 请注意,价格模式(例如AB = CD)可以扩展,指标必须重新绘制以跟随该模式的扩展。如果图案重涂超出了参数中输入的AC / BD / AB = CD比率,则该图案将消失,因为它将不再有效。要交易这些模式,请求助于donchian突破信号。 输入参数 幅度:AB = CD模式的大小 突围
Trend Lines PRO
Roman Podpora
5 (1)
TREND LINES PRO 帮助您了解市场真正的方向转变点。该指标显示真实的趋势反转点以及主要参与者重新入场的时机。 您可以看到 BOS线、 趋势变化和更高时间框架的关键水平——无需复杂的设置或不必要的干扰。信号不会重绘,并在K线收盘后仍然保留在图表上。 VERSION MT 5    -   与……搭配使用时,可发挥其最大潜力   RFI LEVELS PRO 指示器 该指标显示的内容: 实际变化 趋势(BOS 线) 一旦信号出现,它就始终有效!这与会重绘的指标有着重要的区别,后者可能会发出信号后又改变信号,从而导致资金损失。现在,您可以更精准、更准确地进入市场。此外,还有一个功能,会在箭头出现后为K线着色,直到达到目标价位(止盈)或出现反转信号为止。 重复条目   以及主要玩家的充值 为了提高寻找入场点时的视觉清晰度,我们创建了一个模块,该模块首先显示买入/卖出区域,并在该区域内寻找最佳入场点。此外,我们还加入了智能逻辑来管理止损位,该逻辑会随着时间的推移逐步降低止损位的大小,从而降低入场交易时的初始风险(移动止损位)。 信号强度水平(BOS) 该指标采用三个显著性等级来衡量
Legacy of Gann
Pavel Zamoshnikov
4.83 (12)
The indicator very accurately determines the levels of the possible end of the trend and profit fixing. The method of determining levels is based on the ideas of W.D.Gann, using an algorithm developed by his follower Kirill Borovsky. Extremely high reliability of reaching levels (according to K. Borovsky  - 80-90%) Indispensable for any trading strategy – every trader needs to determine the exit point from the market! Precisely determines targets on any timeframes and any instruments (forex, met
RFI levels PRO
Roman Podpora
5 (1)
该指标能够准确显示反转点和价格回落区域。     行业领军人物 。您能洞察新趋势的形成,并以最高的精准度做出决策,掌控每一笔交易。 与……结合时,展现其最大潜力     趋势线专业版   指标  VERSION MT5 该指标显示的内容: 新趋势开始时的反转结构和反转水平及其激活。 显示屏   获利了结   和   止损   风险回报比最低的水平     RR 1:2       。 具有智能减值逻辑的止损。 显示指定指标中两种趋势类型的反转形态。 指标: 根据     趋势线     (全球趋势变化) 潮流专业版     (趋势快速变化) 简单有效   扫描器   实时趋势(新增)。 多时间框架工具筛选。 展示   利润   在 LOGIC AI 信号之后。 以下列出今日走势积极的金融工具。(RB键) 能够为终端启用通知(警报)功能,并向移动设备推送通知。 逻辑人工智能     — 利用人工智能寻找最佳切入点。 只有在启用 MTF(多时间框架分析)模式时,该功能才可用。 兼容性。 当与趋势线指标结合使用时,该指标能发挥其最大潜力。 这     RFI LEVELS PRO    
Advanced Currency IMPULSE with ALERT
Bernhard Schweigert
4.9 (490)
目前40%的折扣!! 对任何新手或专家交易者来说都是最好的解决方案! 这个指标是一个独特的、高质量的、负担得起的交易工具,因为我们已经纳入了一些专有的功能和一个秘密的公式。只需一张图表,它就能给出所有28种货币对的警报。想象一下,你的交易将如何改善,因为你能够准确地确定新趋势或剥头皮机会的触发点 建立在新的基础算法上,它使识别和确认潜在交易变得更加容易。这是因为它以图形方式显示了一种货币的强势或弱势是否正在加速,并测量了这种加速的速度--把它想象成你汽车中的速度表。当你加速时,事情显然会发生得更快,这在外汇市场上也是一样的,即如果你配对的货币正在向相反的方向加速,你就会发现一个潜在的有利可图的交易。 货币动量的垂直线和箭头将指导你的交易! 动态的市场斐波那契23水平被用作警报触发器,将适应市场活动。如果冲动触及黄色触发线,您将在MetaTrader或您的电子邮件或推送警报中收到警报。然后你就知道作为一个交易员应该做什么。货币对和方向已经给出。只要点击警报按钮,就可以切换到该货币对或打开一个新的图表,以便进一步分析。警报级别可以通过用户输入来改变,可以选择3个敏感度级别。 尽
Day Trader Master
Oleg Rodin
5 (15)
Day Trader Master 是一个完整的日间交易者交易系统。该系统由两个指标组成。一个指标是买入和卖出的箭头信号。这是你得到的箭头指示器。我将免费为您提供第二个指标。第二个指标是专门设计用于与这些箭头结合使用的趋势指标。 指标不重复也不迟到! 使用这个系统非常简单。您只需按照当前趋势方向的箭头信号,显示为双色线。蓝色是买入趋势。红色是一种销售趋势。蓝色箭头是买入信号。红色箭头是卖出信号。您需要箭头的颜色和信号的方向来匹配趋势线的颜色。 箭头指标主要是为 M5 和 M15 时间间隔的日内交易而创建的。但从技术上讲,该系统可以用于其他时间间隔。 指示器配备带有推送消息功能的弹出警报。 购买后一定要写信给我!我将为您提供与系统交易的个人建议,以及我的趋势指标。此外,还有丰厚的奖励等着您!
IQ FX Strength  answers the single most important question in trading: "Who is truly driving the market right now?" Designed with a stunning Hybrid UI, this tool separates true trend moves from market noise, allowing you to catch "Explosive" moves before the crowd sees them. System Requirement: For higher accurate signal and optimal, smoother performance of this indicator without any lag, a good CPU (with   RAM of  atleast 8GB or above) and fast internet connection is highly recommended. IQ FX
作者的更多信息
Double Tops And Bottoms MT5
Alexander Nikolaev
4.13 (8)
This indicator finds and displays the Double Bottom and Double Top technical analysis patterns. Signals (displays a message on the screen) if the shape was formed recently. Often after the appearance of these patterns, the trend reverses or a correction occurs. In order not to search for them yourself, or not to miss their appearance, it is enough to add an indicator to the chart. The indicator can be used on different timeframes and currency pairs, there are settings for a better search on a c
FREE
Channels Pro MT5
Alexander Nikolaev
5 (1)
This indicator determines the channels along which prices move on the trading history. There are many trading strategies that rely on channel trading on a channel breakout. This indicator can draw price channels by reading information from several timeframes at once (from the current, from the second and third). You can customize the color and thickness of the lines for each timeframe. Also, you can set a different distance between highs and lows to draw channels or lines. There is also a simple
Trend Stream Scalper MT5
Alexander Nikolaev
5 (2)
This EA trades with the trend using several methods to identify and enter a trade. For example, it uses trendlines, Gator and Stochastic indicators to analyze the market. In addition to trading, it can also display trend lines that it trades based on. It has filters for ADX and MA indicators, as well as a sufficient number of settings to be able to optimize on various currency pairs and timeframes. The EA sets stop loss and take profit for each trade, does not have risky trading methods. It is
Doji Finder Indicator MT5
Alexander Nikolaev
4 (2)
The indicator analyzes the chart and identifies Doji candlesticks. Shows their appearance and signals the appearance of such a candle (if allowed in the parameters). Also, this indicator shows the strength of the reversal in the form of bars of different colors (the more green, the more likely the rise, the more red - the fall in price). The direction of the signal depends on the direction of the previous candles, as the Doji signals a reversal or correction. In the indicator settings, you can
FREE
ADX Channel Indicator
Alexander Nikolaev
4.8 (5)
This indicator forms a channel based on the readings of the ADX (Average Directional Movement Index) indicator, displays and informs the trader of a price reversal at the boundaries of this channel, and can also report when the price touches the channel boundaries. It also draws additional dotted lines, which depend on the readings of the + DI and -DI of the ADX indicator. It also has an option for filtering signals depending on the readings of the stochastic. The channel drawn by this indicato
FREE
Master Bollinger Bands
Alexander Nikolaev
3.86 (7)
The Expert Advisor opens and closes positions using Bollinger Bands signals: it buys on lower bands when price rolls back, and it sells on upper bands. It has the option to close positions by an opposite signal, by take profit and stop loss, move a trade to breakeven upon reaching the central Bollinger band or after a certain price movement. Many good strategies use one or more Bollinger Bands indicators. In this EA, it is possible to use up to 3 such indicators. When using the first and second
ADX Channel
Alexander Nikolaev
4.67 (3)
ADX Channel is an indicator that plots the channel depending on the values of the ADX (Average Directional Movement Index) indicator. The resulting channel is a little similar to the Envelopes, but its lines depend on the market volatility. The sell trade is usually executed fast when the price touches and bounces from the upper line of the channel, buy - from the lower. It is recommended to trade when there is no significant news. The recommended timeframes: M5 - H1. The indicator is not design
FREE
Easy Bollinger Bands
Alexander Nikolaev
4.67 (3)
This Expert Advisor trades based on the Bollinger Bands indicator. It performs trades after a price rebound from the borderlines of the indicator. It is simple to use, contains only a few settings, which are easy to understand. This is the simplified version of the Master Bollinger Bands Expert Advisor. For better trading results, it is recommended to use the full version of the EA: https://www.mql5.com/en/market/product/21788 The free version does not provide the ability to use multiple indicat
FREE
Easy Channels
Alexander Nikolaev
4.5 (2)
The indicator draws price channels. It can be customized so that only buy or sell channels are displayed. Also, trend lines can be displayed instead of channels. This indicator is easy to use, but nevertheless, there are many trading strategies based on channel trading. Advisor based on this indicator:  https://www.mql5.com/en/market/product/37952 Parameters History - maximum number of bars to build channels; Distance - minimum distance from one High (or Low) to another when constructing a chann
FREE
Easy Channels MT5
Alexander Nikolaev
5 (1)
This indicator draws price channels. Easy to use. It has various settings, for example, you can configure it to show channels only for buy or sell, you can display trend lines instead of channels. There are many trading strategies that are based on trading in channels, you can trade on the rebound from the borders of the channels, or the breakdown of the channel.   Parameters History - the maximum number of bars for building channels; Distance - the minimum distance from one maximum (or minimum
Easy Parabolic Sar
Alexander Nikolaev
4.4 (5)
The Expert Advisor places orders based on the points of the Parabolic Sar indicator. If your trading strategy utilizes this indicator, the EA will save you from the necessity to move your pending orders after every candlestick (e.g. 5 minutes or 1 hour) and will do it automatically. You can set the EA to open only BuyStop or only SellStop or both. Buy default both Buy and Sell are enabled. The EA does not use any indicators other than Parapolic Sar. Therefore you are to decide the time to run th
FREE
Trend and correction indicator
Alexander Nikolaev
4.17 (6)
The indicator finds strong trend movements of a currency pair over the specified number of bars. It also finds correction to this trend. When the trend is strong enough, and the correction becomes equal to the values specified in the parameters, the indicator generates a signal. You can set different correction values, while the best suiting are 38, 50 and 62 (Fibonacci levels). In addition, you can configure the minimum length of trend, the number of history bars for search and other parameters
FREE
Free indicator to quickly detect trendline breakouts and high or low of a price range. It displays lines based on the highs and lows of prices, and also finds and displays inclined trend lines. As soon as the price goes beyond the line and the candlestick closes, the indicator signals this with an arrow (you can also enable an alert). This indicator is easy to use and also free. The number of candles for defining trend lines as well as the high and low of the trading range is configurable. It w
FREE
Moving averages are very often used for analyzing currency pairs and trading. This Expert Advisor can analyze many moving averages at once and trade based on this. When the required number of moving averages signal a purchase, the adviser makes a purchase, if the indicators signal a sale, the advisor sells. Also, there is filtering spurious signals at low volatility based on the ADX indicator. In the settings of the adviser, you can set the required number of sliding ones, their period (the init
Easy Candles
Alexander Nikolaev
3 (1)
This is a simple and free Expert Advisor that trades candlesticks. It compares several nearest bars and their volumes, and opens a trade based on that data. Unlike the professional version , it analyzes only 1 timeframe. The recommended timeframes for this EA are H1, H4, D1, it works with any currency pairs. The parameters always need to be optimized before trading, as well as after some period of trading. Input Parameters Lots - lot size (if Lots=0, then the lot will be calculated based on the
FREE
Simple Trade MT5
Alexander Nikolaev
This EA is easy to use, it does not have too complicated settings and algorithms for performing trading operations. It’s not optimized for long, it may appeal to those who recently decided to engage in trading on the exchange with the help of advisers, or who do not want to understand the settings for a long time. The basis of his work is several indicators (moving average, RSI, stochastic, ATR). Despite its simplicity, it has a custom trailing stop function, which can reduce the risks for a dep
Master Bollinger MT5
Alexander Nikolaev
This adviser trades on the signal of the Bollinger Bands indicators: it buys at the lower levels when the price rebounds, and sells at the upper. Has the ability to close positions on the return signal, take profit or stop loss. Many traders use the Bollinger Bands indicator, and some use several Bollinger indicators on the same chart. In this adviser, you can use up to 3 of these indicators. When using the first and second indicators, the transaction will be carried out between the lines of the
Bollinger with WPR demo
Alexander Nikolaev
4.33 (3)
This Expert Advisor is the free version of "Bollinger with WPR scalper", which is based on the Bollinger bands and Williams' Percent Range indicators. Limitations of the free version: lot is fixed to 0.01, only the EURUSD currency pair is supported, trading time cannot be selected, trailing stop is not available. Nevertheless, it can make quite a lot of deals, so you do not have to wait for positions to be opened (with the appropriate settings and timeframes below H1). The EA can be used on time
FREE
Break Lines
Alexander Nikolaev
4.67 (3)
The indicator draws lines the the price highs and lows. Break through the high or low usually indicates trend change (or continuation). Once the price moves through a line, and the candlestick closes, the indicator draws an appropriate arrow (also, you can enable alerts). A deal should be conducted in the breakthrough direction immediately or after a slight rollback. It is best to trade following the trend on a larger timeframe. This indicator is easy to use, but nevertheless, there are many tra
FREE
Volume Levels MT5 Free
Alexander Nikolaev
This indicator is able to determine the price levels at which there was the most volume for the specified period of history. In the future, the price often bounces off such levels, and this can be successfully applied in trading. They are displayed as lines, some parameters for determining the levels can be adjusted. This indicator is simple, therefore, it does not report signals, and only builds levels on EUR/USD. Parameters HistoryBars - the number of bars to determine the near volume levels;
FREE
Volume Levels USDJPY
Alexander Nikolaev
3.5 (2)
Volume Levels is a very important indicator for exchange trading. Most of the trades were performed on those levels. This indicator displays the price level that had the most trade volumes over a certain period of time. Often, the price bounces from those levels in the future, and it can be successfully used in trading. This is a demo version that works only on the USD/JPY currency pair. To work on all currency pairs, install the full version: https://www.mql5.com/en/market/product/15888 Parame
FREE
Colored Candles Demo
Alexander Nikolaev
5 (1)
The demo version of the Colored Candles indicator - calculates the parameters of each candle, as well as its volume. After that, it paints the candles depending on their strength and direction. Bullish candles are colored green and bearish candles - red. The greater the power of the bulls or the bears, the brighter the color. You can change the colors if you want. The indicator helps to analyze the price movement, as well as market entry points. The more accurate signals are formed on the higher
FREE
Trailing stop for advisors
Alexander Nikolaev
4.5 (2)
The utility manages other EAs' orders as well as the ones opened manually. It is capable of trailing the price (trailing stop function), set a stop loss and take profit if they have not been set before. When configuring the utility for an EA having no trailing stop function, place it to the new window with the same currency pair specifying the same Magic value (as for the EA orders the stop loss is to be applied to). You can set any timeframe. It does not affect the utility operation. Set Magic
FREE
Three Fractals demo
Alexander Nikolaev
This Expert Advisor identifies trend reversals based on fractals and some other indicators. It is a free lite version of Three fractals Brief description of the trading strategy: when the fractals were formed after a prolonged fall, and the last fractal did not update the minimum of the previous bar's lower fractal, then a trend reversal is determined (at the same time, there must be a fractal in the middle, which is higher than the others). Similarly, opposite for growth. In case other indicato
FREE
Volume Candles
Alexander Nikolaev
Volumes are one of the most important factors of trading, as it is the high volumes that move the market in either direction. But there are very few standard indicators for volumes in MetaTrader 4. The Volume Candles analyses the volumes of the trades and displays candles depending on these volumes. The candle appears once the required number of volumes has passed during trading (the VolumeCandle parameter). If the candles close frequently and are thin, then the volumes on the market are current
Volume Levels
Alexander Nikolaev
5 (3)
Volume Levels is a very important indicator for exchange trading. Most of the trades were performed on those levels. This indicator displays the price level that had the most trade volumes over a certain period of time. Often, the price bounces from those levels in the future, and it can be successfully used in trading. It works on any currency pair. Parameters HistoryBars - the number of bars to determine the near volume levels; Range - the maximum distance above and below the current price to
EMA 8 and 18 Trading System
Alexander Nikolaev
2 (1)
This EA implements the EMA 8/18 strategy, which is used by many traders. Brief description of the strategy: The Buy is determined when the EMA 8 indicator crosses the EMA 18 from below, with the price moving more than 50 points from the crossing. The buy position is opened when the price touches the EMA for the first time, after that, as the price rises, the trade is maintained by a trailing stop with a step of 30-35 points. The opposite is for opening a sell position. The parameters of the fast
ProCandles
Alexander Nikolaev
Some experienced trades can tell where the price will go even without indicators, as the direction of the price can be found using the ordinary candlesticks. The EA compares several nearest bars and their volumes, and opens a trade based on that data. Also, it is able to analyze the candles on two timeframes at the same time to make the entry more accurate and less risky. In addition, the EA can automatically determine the take profit and stop loss size depending on the size of the previous cand
Colored candles
Alexander Nikolaev
Some candles have a strong tendency to continue the movement or to revert it. With the help of the Colored candles indicator such movements are clearly visible. This indicator calculates the parameters of each candle, as well as its volume, and after that it paints the candles depending on its strength and direction. Bullish candles are colored green and bearish candles - red. The greater the power of the bulls or the bears, the brighter the color. You can change the colors if you want. The indi
It is good to know the presence of a trend on multiple timeframes at once. And even better - on multiple currency pairs at once. This indicator allows to quickly determine the presence of a trend or a flat on 8 timeframes and from 1 to 15 currency pairs at once. Multi Alligator Signals analyzes the signals of the Alligator indicator by Bill Williams on every timeframe (from M1 to W1) and multiple currency pairs (up to 15) simultaneously. If there is a buy signal, a green upward arrow is drawn, i
筛选:
无评论
回复评论