Master Figures

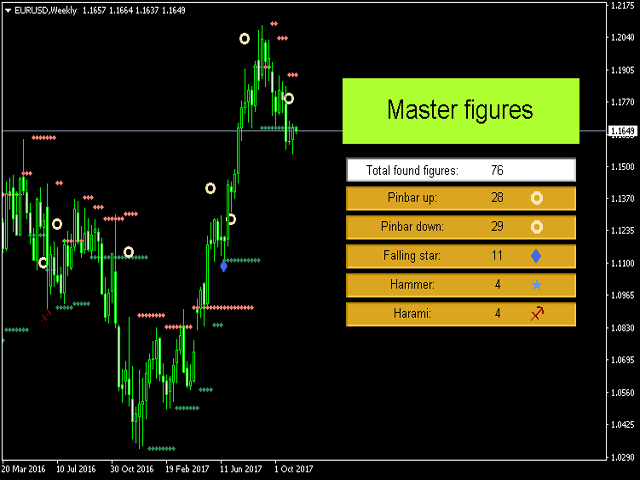
The Master Figures indicator analyzed the market for the most common chart patterns.

  • The first pattern is called Pin bar. This pattern can rightly be considered one of the most widespread. This pattern looks like a candle with a small body and large tail (wick). Once you see it on the chart, open a position against the wick. It is better to use the resistance lines for closing. Master Figures shows this pattern in the form of circles. A position should be opened when a new candle appears after the Pin bar.

  • The next pattern is Shooting Star. Master Figures displays it in the form of stars on the chart. This pattern is very similar to Pin bar, but it has its own peculiarities. In particular, the candle wick may be 2 or more times longer than the body, but the previous candle must be bullish relative to the signal candle, while the next one should be bearish. More accurate signals for this pattern are generated on the higher timeframes, H4 and higher.

  • A pattern inverse to Shooting Star is Hammer. The principle is the same, but the wick of the signal candle is downwards, the previous candle is bearish and the next one is bullish. Enter the market when the last candle closes in the ascending position.

  • The next pattern displayed by the Master Figures indicator on the chart is Harami. It is a model of two candlesticks. First a large candle appears, followed by a small candle. In this case, the small candle is fully engulfed by the large one. The first candle of the pattern has small wicks, ideally - none at all. The second candle has small wicks, which can be no longer than twice the body. If they exceed that size, the entry is made against the trend as well, but the pattern is called "Harami Cross".


Working with the Master Figures indicator

  • It is recommended to close open orders when the price reaches a resistance line. The Master Figures indicator displays these lines on the chart as well.
  • The trades should be opened on the bar following the signal bar, where the pattern was formed. This is explained by the fact that as long as the bar is not closed, the patterns may change their shapes, and a Harami may turn into a Harami Cross. This is a normal situation on the market, which simply has to be taken into account when building trading systems.


Settings of the Master Figures indicator

  • bars - the number of bars to display the indicator.
  • inform - show/hide the information panel on the chart.
  • pinbar - show/hide Pin bars on the chart.
  • color_pinbar - color of the Pin bar pattern.
  • size_pinbar - size of the Pin bar pattern.
  • Falling_star - show/hide the Shooting Star pattern.
  • color_Falling_star - color of the Shooting Star pattern.
  • size_Falling_star - size of the Shooting Star pattern.
  • Hammer - show/hide the Hammer pattern.
  • color_Hammer - color of the Hammer pattern.
  • size_Hammer - size of the Hammer pattern.
  • Harami - show/hide the Harami pattern.
  • color_Harami - color of the Harami pattern.
  • size_Harami - size of the Harami pattern.
  • information_panel_color, information_panel_color2, information_panel_color3 - color palette of the information panel.
  • Resistance - show/hide the resistance lines.
  • Step - resistance change step.
  • Sensitivity - resistance sensitivity.
  • Indenting - indent on bars.
  • Resistance_color1, Resistance_color2 - color of the resistance lines.
推荐产品
For this set of indicators 1. General information     - Calculates with high performance mathematical algorithms.     - Calculated from the price of candles     - The entry point of this order is filtered by the train EMA and the oscillator.     - Calculate the integrity of the candle 2. How does it work?     - You can see two types of order entry points: the notification on the monitor and the arrow.     - You can trust 75-95 percent of this entry point. 3. Settings     - Retracement is retr
This indicator is a must have tool that scans the active chart for candlestick patterns. It labels each bar according the candlestick pattern(s) that it finds enabling you to more easily analyze price action and be more informed about your trading decision. There are 103 common and uncommon possible patterns plus 6 new patterns based on research that the indicator can identify. If a candlestick(s) meets the requirements for multiple patterns, the bar will be labeled with up to 4 patterns names f
Overview Harmonic Patterns MT4 is a technical analysis indicator designed for the MetaTrader 5 platform. It identifies and displays harmonic price patterns, such as Butterfly, Cypher, Crab, Bat, Shark, and Gartley, in both bullish and bearish directions. The indicator calculates key price levels, including entry, stop loss, and three take-profit levels, to assist traders in analyzing market movements. Visual elements and customizable alerts enhance usability on the chart. Features Detects six ha
PZ Harmonacci Patterns
PZ TRADING SLU
3.17 (6)
可以说,这是您可以为MetaTrader平台找到的最完整的谐波价格形成自动识别指标。它检测19种不同的模式,像您一样认真对待斐波那契投影,显示潜在的反转区域(PRZ),并找到合适的止损和获利水平。 [ 安装指南 | 更新指南 | 故障排除 | 常见问题 | 所有产品 ] 它检测19种不同的谐波价格形态 它绘制了主要,衍生和互补的斐波那契投影(PRZ) 它评估过去的价格走势并显示每个过去的形态 该指标分析其自身的质量和性能 它显示合适的止损和获利水平 它使用突破来表明合适的交易 它在图表上绘制所有样式比率 它实现了电子邮件/声音/视觉警报 受斯科特·M·卡尼(Scott M. Carney)的书的启发,该指标旨在满足最纯粹和最熟练的交易者的需求。但是,它采取了一种使交易更容易的方式:在向交易发出信号之前,它会等待Donchian朝正确方向突破,从而使交易信号非常可靠。 斐波那契投影与向量无关 它实现了电子邮件/声音/推送警报 它绘制了ABCD投影 重要提示: 为了符合 Scott M. Carney先生 的商标申诉,某些图案名称已重命名为不言自明的替代方式, Scott M.
Gold Phoenix
Yaroslav Varankin
The perfect tool for Scalng in the Forex markets You can trade both from signal to signal and using take profit  The algorithm does not use Zigzag!  No redrawing!  This is a channel instrument that uses a moving average as a filter. Moving Average  There are 2 parameters for the settings Ma Period = 5 period Moving Average  Channel 1.0 distance of channel lines from the chart Price Signal Filter - calculation of signal opening and filter There is a complete set of Alert There is a multi-timefram
Pattern Searching
Kourosh Hossein Davallou
Pattern Searching: Smart, Precise, & Customizable for MT4!  Are you looking for a powerful tool to quickly and accurately identify trading patterns in Forex? This advanced indicator for MetaTrader 4 (MT4) is exactly what you need!  Key Features That Will Amaze You:  Automatic Classic Pattern Detection: This indicator automatically finds the closest classic Forex patterns for you. Whether you're looking for Smart Money Concepts (SMC) or NDS strategies, this tool covers it all!   * Popular patt
AW Candle Patterns MT4
AW Trading Software Limited
AW 蜡烛形态指标是高级趋势指标与强大的蜡烛形态扫描仪的组合。它是识别和突出显示 30 个最可靠的烛台形态的有用工具。此外,它是一个基于彩色条的电流趋势分析器,带有   可调整大小和定位的插件多时间框架趋势面板。根据趋势过滤调整模式显示的独特能力。 优点: 轻松识别蜡烛形态 不重绘结果 内置多时间趋势面板 禁用模式类型(1、2、3 根蜡烛) 显示形态时趋势过滤的调整 MT5 version - >   HERE   / Instructions and description  -> HERE 显示模式列表: 锤模式 固定/固定 看跌 Harami / 看涨 Harami 看跌 Harami Cross / 看涨 Harami Cross 枢轴点反转向上/枢轴点反转向下 双柱低位收盘价较高/双柱低位收盘价较低 收盘价反转向上 / 收盘价反转向下 中性条 /     两个中性条 双内/内/外 向上推力杆/向下推力杆 晚星/晨星 晚上十字星 / 早上十字星 吞没看跌线/吞没看涨线 镜子酒吧 流星 乌云盖顶 十字星 输入变量: Main settings Trend Filtering Mo
All Symbols   AND  All Time frames Scan                                                                                                                 Document Introduction   The ABCD is a basic harmonic pattern. The ABCD pattern is a visual, geometric chart pattern comprised of three consecutive price swings. It looks like a diagonal lightning bolt and can indicate an upcoming trading opportu
Reversal Pattern Pro
Boonyapagorn Rodvattanajinda
Reversal Patterns Pro Reversal Patterns Pro is a Price Action (PA) analytical tool that scans the reversal patterns.  - Finds and marks the most dependable Japanese candlestick patterns in real-time. - Supports all time frames (Best for Scalping) - Doesn't repaint making it an exceptional indicator for Expert Advisors. Input parameters : - Support & Resistance Mode ( true or false ) for enabling advanced filtering - Donchian Period - RSI Period - RSI Oversold Level - RSI Overbought Level - Al
Crypto_Forex MT4 指标“三只黑乌鸦形态”,无需重绘,无延迟。 - “三只黑乌鸦形态”指标对于价格行为交易非常有效。 - 指标可检测图表上看跌的“三只黑乌鸦形态”:图表上显示红色箭头信号(见图)。 - 支持 PC、手机和电子邮件提醒。 - 其兄弟——看涨的“三白兵形态”指标也已推出(点击下方链接)。 - “三只黑乌鸦形态”指标非常适合与支撑/阻力位结合使用。 ................................................................................................................. 点击这里查看高质量的交易机器人和指标! 这是仅在 MQL5 网站上提供的原创产品。
PZ 123 Pattern
PZ TRADING SLU
1 (1)
123模式 是最受欢迎,功能强大和灵活的图表模式之一。该模式由三个价格点组成:底部,峰值或谷值以及38.2%至71.8%之间的斐波纳契回撤位。当价格突破最后一个峰值或谷值时,该形态被认为是有效的,此时指标绘制箭头,发出警报并可以进行交易。 [ 安装指南 | 更新指南 | 故障排除 | 常见问题 | 所有产品 ] 清除交易信号 可自定义的颜色和尺寸 实施绩效统计 可定制的斐波那契回撤水平 显示适当的止损和获利水平 该指标可用于查找连续或反转形态 它是不可重涂和不可重涂的 它实现了电子邮件/声音/视觉警报 123模式 可以表现为连续或反转模式。为了简化操作,该指标使您可以选择要寻找哪种类型的形态,使其成为趋势或反转交易者的绝佳工具。 设置 将指标加载到任何图表时,将显示一组选项作为输入参数。如果您认为它们太多,请不要感到失望,因为参数被分组为不言自明的块。这就是每个参数块的作用。 幅度-幅度表示替代价格点之间的最小柱线量。要找到大图案,请增加幅度参数。要查找较小的模式,请减小幅度参数。 闵。回撤-形态中所需的最小斐波那契回撤。设置为零不对其进行评估。 最大。回撤-形态中可能的最大斐
Monster Harmonic Indicator
Paul Geirnaerdt
4.59 (29)
Monster Harmonics Indicator is a harmonic pattern indicator. It recognizes Gartley, Bat, Crab, Butterfly, Cypher, White Swan, Black Swan, Shark and several other patterns. Projected patterns that are not yet completed are recognized, too. Monster even shows the PRZ (Potential Reversal Zone). Users can add their own user defined patterns to Monster. Besides the current pattern, Monster also shows all patterns in the symbols history. Monster will provide alerts for developing patterns. Introduced
Rainbow Price Visualizer
Vincent Jose Proenca
Rainbow Price Visualizer v1.21 See where the market really breathes. Turns your MT4 chart into an ultra-precise heatmap that highlights price zones favored by big players. Why it matters 300 price levels at 0.2‑pip resolution — microscopic detail. 8 visual themes (Rainbow, Fire, Ocean…) for instant readibility. Smart opacity: low noise fades, real zones pop. Lightweight rendering with automatic cleanup. Fully customizable: saturation, opacity, resolution, history depth. Bands project into the f
这是一个预测蜡烛收盘价的指标。 该指标主要用于 D1 图表。 该指标适用于传统外汇交易和二元期权交易。 该指标可以用作独立的交易系统,也可以作为您现有交易系统的补充。 该指标分析当前蜡烛,计算蜡烛本身内部的某些强度因素,以及前一根蜡烛的参数。 因此,该指标预测市场走势的进一步方向和当前蜡烛的收盘价。 由于这种方法,该指标既适用于短期盘中交易,也适用于中长期交易。 该指标允许您设置指标在分析市场情况期间将产生的潜在信号的数量。 在指标设置中有一个特殊的参数。 此外,该指标可以通过图表上的消息、电子邮件以及推送通知的形式通知新信号。感谢您的关注!交易愉快! 购买后一定要写信给我! 我会给你我的交易指标的建议! 还可以获得奖金!
Infinity Trend Pro
Yaroslav Varankin
1 (1)
This is a trend indicator without redrawing Developed instead of the binary options strategy (by the color of the Martingale candlestick) Also works well in forex trading When to open trades (binary options) A signal will appear in the place with a candle signaling the current candle It is recommended to open a deal for one candle of the current timeframe M1 and M5 When a blue dot appears, open a deal up When a red dot appears, open a trade down. How to open trades on Forex. When a signal is rec
该指标发现技术分析反转模式,如双底、三重底、头肩顶及其相反的对应物。该指标将它们显示在货币对图表上,如果最近形成了一种模式,则可以向交易者发出信号。这使您可以快速检测可能的趋势反转或修正,在图表中添加一个指标就足够了,之后,您可以更改不同的时间范围以快速找到此类模式,如果没有找到这些模式,或者相反,不是位于历史上最好的地方,您可以更改参数以更好地显示某个货币对。此外,您可以更改显示图案的线条颜色,并启用未完全成型的图案线条的显示。 选项 History - 在图表上搜索形态的柱数; ExtremCountBars - 搜索极值的柱数,例如,第二个峰值的高点(推荐 3-40); MinExtremDist - 2 个极值之间的最小柱数(推荐 2-12,值越高,找到的形态越大); MaxExtremDist - 2 个极值之间的最大柱数(推荐 10-50); MultipleVerticesFilter - 过滤以找到“额外的”高点或低点(如果启用,应该只有 2 个顶部或底部); PeriodMAforEdgeFiltering - 通过 MA 过滤双底和顶部形状的边缘,以便有平滑的上
Blahtech Market Profile
Blahtech Limited
4.53 (15)
Was: $249  Now: $99   Market Profile defines a number of day types that can help the trader to determine market behaviour. A key feature is the Value Area, representing the range of price action where 70% of trading took place. Understanding the Value Area can give traders valuable insight into market direction and establish the higher odds trade. It is an excellent addition to any system you may be using. Blahtech Limited presents their Market Profile indicator for the MetaTrader community. Ins
BONUS INDICATOR HERE :  https://linktr.ee/ARFXTools Trading Flow Using Fibo Eminence Signal 1️⃣ Wait for the Fibonacci to Auto-Draw The system automatically detects swings (from high to low or vice versa) Once the Fibonacci levels appear, the indicator sends an alert notification “Fibonacci detected! Zone is ready.” 2️⃣ Check the Entry Zone Look at the ENTRY LINE (blue zone) This is the recommended SELL entry area (if the Fibonacci is drawn from top to bottom) Wait for the price to enter
Reversal Pattern AI
Stanislav Konin
5 (1)
Reversal Pattern AI is a groundbreaking advancement in indicator development, combining artificial intelligence algorithms, multi-level market analysis, and classical technical analysis methods. It not only detects reversal patterns but also evaluates market inefficiencies, generating highly accurate trading signals.Thanks to its hybrid model, which utilizes price action analysis, volume, volatility, VWAP, and Volume AVG %, the indicator easily adapts to any market conditions. Reversal Pattern A
Trendiness Index
Libertas LLC
5 (3)
"The trend is your friend" is one of the best known sayings in investing, because capturing large trendy price movements can be extremely profitable. However, trading with the trend is often easier said than done, because many indicators are based on price reversals not trends. These aren't very effective at identifying trendy periods, or predicting whether trends will continue. We developed the Trendiness Index to help address this problem by indicating the strength and direction of price trend
SMC Venom 模型 BPR 指標是針對在智慧貨幣 (SMC) 概念內工作的交易者的專業工具。它會自動辨識價格圖表上的兩種關鍵模式: FVG (公平價值缺口)是三根蠟燭的組合,其中第一根和第三根蠟燭之間存在缺口。它在水平之間形成一個沒有成交量支撐的區域,這通常會導致價格調整。 BPR (平衡價格區間)是兩種 FVG 模式的組合,形成一個「橋樑」 - 當價格以低成交量活動移動時,突破並返回到水平的區域,從而在蠟燭之間產生間隙。 這些模式可協助交易者透過分析圖表上的交易量和價格動態(大型市場參與者和普通參與者之間的互動)來識別關鍵的支撐/阻力位、突破區域和切入點。 此指標以矩形和箭頭的形式可視化模式,也支援靈活的警報設定。 主要特點: 模式顯示模式:選擇顯示 BPR 模式(看漲和看跌)或 FVG 模式(看漲和看跌)。 可以隱藏所有圖表分析模式。 以條數過濾:BPR 結構中 FVG 之間的最小/最大距離。 訊號的附加視覺化: 箭頭有 9 種類型可供選擇(標準、細、分形等)或手動輸入 Wingdings 代碼,其表格可以選擇性地顯示在圖表上。 使用 ATR 配置顏色、尺寸及其相對於價格
Before
Nadiya Mirosh
The Before indicator predicts the most likely short-term price movement based on complex mathematical calculations. Most of the standard indicators commonly used in trading strategies are based on fairly simple calculations. This does not mean that there were no outstanding mathematicians in the world at the time of their creation. It is just that computers did not yet exist in those days, or their power was not enough for the sequential implementation of complex mathematical operations. Nowad
Trade with Gann on your side!! MASTER CIRCLE 360 CIRCLE CHART, originally created by Gann admitted that this is “The Mother of all charts”. It is one of the last studies that this great trader left for us. The numeric tab le is apparently quite simple like all the tables and is based on square numbers, the SQUARE OF 12 and is by evolution, one of the most important square numbers. Here we can find CYCLE, PRICE AND TIME thanks to angles and grades, to show past and future support and resistance.
Auto Levels
Yaroslav Varankin
Auto Level this tool is able to determine the levels of support and resistance. search and display when the price has broken through the level and when it pushed off from it. the indicator can be useful if you use resistance support levels in your trading. or the highs and lows of the price, then it will greatly simplify your work and help you more quickly and more accurately determine the rebound or breakdown of the current trend or tendencies level. blue line bottom uptrend red line on top dow
Cosmic Diviner X Planet
Olena Kondratenko
4 (2)
This unique multi-currency strategy simultaneously determines the strength of trends and market entry points, visualizing this using histograms on the chart. The indicator is optimally adapted for trading on the timeframes М5, М15, М30, Н1. For the convenience of users, the indicator renders the entry point (in the form of an arrow), recommended take profit levels (TP1, TP2 with text labels) and the recommended Stop Loss level. The take profit levels (TP1, TP2) are automatically calculated for
QuantumEdge Trader
Hossam Ali Ahmed Ali
QuantumEdge Trader v1.0 AI-Powered Precision Signals for Serious Traders QuantumEdge Trader is a smart and reliable indicator that delivers accurate BUY and SELL signals using advanced market analysis and trend detection. Designed for M1 to M60 timeframes, it's ideal for scalping and intraday strategies. --- Key Features: No Repaint – Signals never change after appearing Smart trend filters to reduce noise Adjustable sensitivity and alerts Perfect for XAUUSD, EURUSD, and m
Nirvana prop controler MT4
Aiireza Arjmandi Nezhad
面向专业交易者与评估账户(Prop)的风险管理与限制监控指标 本工具仅在图表上展示风险管理与限制相关的精确信息,帮助你更专注地做出决策。该指标不执行开仓/平仓/修改操作,也不会与智能交易系统(EA)产生干扰。 功能 监控日内与总回撤 基于余额(Balance)或净值(Equity)计算并显示日内/总回撤(可配置)。 显示距离预设限制的剩余百分比。 清晰专业的图表面板 摘要表:余额、净值、当前盈亏、日内/总回撤、预警阈值。 简洁易读的界面,便于专注决策。 基于风险的仓位大小 根据百分比/固定金额风险和所选止损距离计算大致手数。 在图表上显示风险回报比(R:R)以及入场、止损(SL)、止盈(TP)水平。 警报与通知 接近日内/总回撤阈值时触发警报(阈值百分比可设置)。 价格触及 SL/TP 或其他自定义事件时发送通知。 支持向桌面和移动端推送通知。 兼容性与非干预 指标仅用于信息展示,不执行或管理订单。 可同时用于多个图表与品种。 即使在不允许 EA 的环境中也可使用。 使用方法 将指标加载到所需品种与时间周期上。 设置日内/总限制、计算基准(Balance/Equity)以及时区或每日
History Pattern Search
Yevhenii Levchenko
该指标建立当前报价,可以与历史报价进行比较,并在此基础上进行价格走势预测。指示器有一个文本字段,用于快速导航到所需日期。 选项: 符号 - 选择指标将显示的符号; SymbolPeriod - 选择指标从中获取数据的时段; IndicatorColor - 指示器颜色; HorisontalShift - 由指标绘制的报价移动指定的柱数; Inverse - true 反转引号,false - 原始视图; ChartVerticalShiftStep - 图表垂直移动(键盘上的向上/向下箭头); 接下来是文本字段的设置,您可以在其中输入日期,您可以通过按“回车”立即跳转到该日期。 接下来是文本字段的设置,您可以在其中输入日期,您可以通过按“回车”立即跳转到该日期。
Minotaur Waves Signal
Leandro Bernardez Camero
Minotaur Waves 是一款高精度市场分析工具,结合双重信号引擎设计,旨在识别趋势转折点并确认价格动量的变化。系统集成了强大的 Minotaur Oscillator (牛头人振荡器)与动态区间结构,提供清晰可视的非重绘入场信号,适用于所有货币对,尤其在 EURUSD、GBPUSD、USDJPY 的 M1、M5、M15 和 M30 时间周期下表现最佳。 获取最新更新和操作指南: https://www.mql5.com/en/channels/forexnewadvisor 系统核心组成: 动态区间系统: 实时跟踪价格动量变化,展示关键趋势与突破区域 Minotaur Oscillator: 通过柱状图展示动量极值,精确确认买卖转折点 信号逻辑与入场条件: 交易信号仅在价格行为与振荡器状态共同满足下生成,满足以下全部条件时发出交易提醒: Minotaur Oscillator 出现已确认极值: 高点为 +33 (买入),低点为 -33 (卖出) 价格突破动态区间的关键确认水平 所有计算基于已收盘的K线 ,确保信号不重绘且稳定可靠 在满足以上条件后,系统将触发: 多通道提
Crypto_Forex 指标“晨星模式”适用于 MT4。 - 指标“晨星模式”是价格行为交易的非常强大的指标:无需重绘,无延迟。 - 指标检测图表上的看涨晨星模式:图表上的蓝色箭头信号(见图片)。 - 带有 PC、手机和电子邮件警报。 - 还有它的兄弟 - 看跌“黄昏之星模式”指标可用(点击以下链接)。 - 指标“晨星模式”非常适合与支撑/阻力位结合使用。 ................................................................................................................. 点击这里查看高质量的交易机器人和指标! 这是仅在此 MQL5 网站上提供的原创产品。
该产品的买家也购买
Scalper Inside PRO
Alexey Minkov
4.74 (69)
An exclusive indicator that utilizes an innovative algorithm to swiftly and accurately determine the market trend. The indicator automatically calculates opening, closing, and profit levels, providing detailed trading statistics. With these features, you can choose the most appropriate trading instrument for the current market conditions. Additionally, you can easily integrate your own arrow indicators into Scalper Inside Pro to quickly evaluate their statistics and profitability. Scalper Inside
Atomic Analyst
Issam Kassas
5 (4)
首先值得强调的是,该交易指标是非重绘、非延迟的指标,这使其成为手动和机器人交易的理想选择。 用户手册:设置、输入和策略。 Atomic Analyst是一种PA价格行动指标,利用价格的力量和动量来寻找市场上更好的机会。配备了高级过滤器,可帮助去除噪音和假信号,并提高交易潜力。使用多层复杂的指标,Atomic Analyst扫描图表,并将复杂的数学计算转化为任何初学者都能理解并用来做出一致交易决策的简单信号和颜色。 “Atomic Analyst”是专为新手和经验丰富的交易者量身定制的综合交易解决方案。它将高级指标和一流功能融合为一体的交易策略,使其成为所有类型交易者的多功能选择。 日内交易和剥头皮策略:专为快速准确的日内交易和短期交易而设计。 日内和摆动交易策略:可用作追求价格大幅波动的日内和摆动交易者的可靠工具。 多货币和市场:凭借其可靠的精度,在不同的工具和市场上运作。 多个时间框架:可在多个时间框架上使用,性能良好。 稳定性:所有指标均不重绘、不重绘和不滞后,确保可靠的信号。 信号清晰度:提供箭头信号,用于清晰的入场和出场点。 实时警报:通过交易入场、SL和TP警报通知交易者
Linear Trend Predictor — 结合切入点和方向支撑线的趋势指标。按照突破高/低价通道的原理运作。该指标算法过滤市场噪音,考虑波动性和市场动态。 指示器功能  使用平滑方法,显示市场趋势和开立买入或卖出订单的切入点。  适合通过分析任何时间范围内的图表来确定短期和长期的市场走势。  输入参数可适应任何市场和时间范围,允许交易者独立定制指标。  设定的指示信号不会消失,也不会重新绘制——它是在蜡烛收盘时确定的。  几种类型的通知以箭头组合。  该指标既可以作为独立的交易系统使用,也可以作为其他交易系统的补充。  可供任何经验水平的交易者使用。 主要参数 Volatility Smoothing Level - 指标的主要参数,允许您配置指标以实现舒适的操作。 它的数字范围是 1 到 100,从而增加了您可以获得更长趋势运动的平滑度。 通过少量的数字,您可以获得短期走势并快速退出交易。 使用指标进行交易的时刻:  红线和箭头表示下降趋势和卖出开盘信号。止损应根据前一个上分形来设置。  黄线和箭头表示上升趋势和买入开盘信号。止损应根据前一个下分形来设置。
Dynamic Scalper System
Vitalyi Belyh
5 (1)
“ Dynamic Scalper System ”指标专为在趋势波内进行剥头皮交易而设计。 已在主要货币对和黄金上进行测试,并可与其他交易工具兼容。 提供顺势短线建仓信号,并提供额外的价格变动支持。 指标原理: 大箭头决定趋势方向。 在趋势波内,我们采用一种生成小箭头形式的剥头皮交易信号的算法。 红色箭头代表看涨方向,蓝色箭头代表看跌方向。 敏感的价格变动线会沿着趋势方向绘制,并与小箭头信号协同作用。 信号运作方式如下:当线在适当时刻出现时,将形成入场信号;在出现线时,持仓;线完成后,平仓。 建议的操作时间范围为M1 - H4。 箭头在当前K线上方形成,如果下一根K线已开仓,则不会重新绘制上一根K线上方的箭头。 输入参数 Trend Wave Period - 趋势方向(大箭头)的周期,改变趋势波的时间间隔。值 1 表示趋势方向的最长持续时间,参数值越大,持续时间越短。 Scalper Arrows Period - 信号箭头(小箭头)的计算周期,改变入场信号的生成频率。值 3 表示最频繁的生成频率,参数值越大,箭头频率越低,准确度越高。 这些参数可以根据不同的时间范
Trend Lines PRO
Roman Podpora
5 (1)
TREND LINES PRO 帮助您了解市场真正的方向转变点。该指标显示真实的趋势反转点以及主要参与者重新入场的时机。 您可以看到 BOS线、 趋势变化和更高时间框架的关键水平——无需复杂的设置或不必要的干扰。信号不会重绘,并在K线收盘后仍然保留在图表上。 VERSION MT 5    -   与……搭配使用时,可发挥其最大潜力   RFI LEVELS PRO 指示器 该指标显示的内容: 实际变化 趋势(BOS 线) 一旦信号出现,它就始终有效!这与会重绘的指标有着重要的区别,后者可能会发出信号后又改变信号,从而导致资金损失。现在,您可以更精准、更准确地进入市场。此外,还有一个功能,会在箭头出现后为K线着色,直到达到目标价位(止盈)或出现反转信号为止。 重复条目   以及主要玩家的充值 为了提高寻找入场点时的视觉清晰度,我们创建了一个模块,该模块首先显示买入/卖出区域,并在该区域内寻找最佳入场点。此外,我们还加入了智能逻辑来管理止损位,该逻辑会随着时间的推移逐步降低止损位的大小,从而降低入场交易时的初始风险(移动止损位)。 信号强度水平(BOS) 该指标采用三个显著性等级来衡量
NAM Order Blocks
NAM TECH GROUP, CORP.
3.67 (3)
MT4多時限訂單塊檢測指示器。 特徵 -在圖表控制面板上完全可自定義,提供完整的交互。 -隨時隨地隱藏和顯示控制面板。 -在多個時間範圍內檢測OB。 -選擇要顯示的OB數量。 -不同的OB用戶界面。 -OB上的不同過濾器。 -OB接近警報。 -ADR高低線。 -通知服務(屏幕警報|推送通知)。 概括 訂單塊是一種市場行為,它指示從金融機構和銀行收取訂單。著名的金融機構和中央銀行帶動了外匯市場。因此,交易者必須知道他們在市場上正在做什麼。當市場建立訂單塊時,它會像發生大多數投資決策的範圍一樣移動。 訂單建立完成後,市場將朝著上升和縮小的方向發展。訂單大宗交易策略的關鍵術語是它包括機構交易者正在做的事情。由於它們是主要的價格驅動因素,因此包括機構交易在內的任何策略都可以。 您將在任何時間範圍內實時看到訂單塊,使用我們的控制面板,您將能夠在所選的歷史記錄週期內檢測常規,拒收和未大寫的訂單塊。 現在您可以接收到訂單塊接近警報,我們在MT4上顯示屏幕通知,並將通知推送到您的手機!
GOLD Impulse with Alert
Bernhard Schweigert
4.67 (12)
这个指标是我们2个产品 Advanced Currency IMPULSE with ALERT  +   Currency Strength Exotics 的一个超级组合。 它适用于所有时间框架,并以图形方式显示8种主要货币和一种符号的强势或弱势冲动! 该指标专门用于显示任何符号的货币强度加速,如黄金、异国货币对、商品、指数或期货。这是它的第一个指标,任何符号都可以被添加到第9行,以显示黄金、白银、石油、DAX、US30、MXN、TRY、CNH等的真实货币强度加速(冲动或速度)。 建立在新的基础算法上,它使识别和确认潜在的交易更加容易。这是因为它以图形方式显示了一种货币的强势或弱势是否正在加速,并测量了这种加速的速度--把它想象成你汽车中的速度表。当你加速时,事情显然会发生得更快,这在外汇市场上也是一样的,即如果你配对的货币正在向相反的方向加速,你就会发现一个潜在的有利可图的交易。 动态市场斐波那契28水平被用作警报触发器,将适应市场活动。如果冲动击中黄色触发线,你将收到警报。然后你就知道作为一个交易员应该做什么。货币对和方向已经给出。只需点击警报按钮,就可以切换到该货
MTF Supply Demand Zones
Georgios Kalomoiropoulos
4.82 (22)
下一代自动化供需区。适用于任何图表的创新算法。所有区域都是根据市场的价格行为动态创建的。 两种类型的警报 --> 1) 当价格触及区域时 2) 当新区域形成时 你不会再得到一个无用的指标。您将获得一个完整的交易策略和经过验证的结果。     新的功能:     价格触及供需区时发出警报     创建新的供应/需求区时发出警报     推送通知警报     以点为单位的区域宽度标签     关于 MTF 的又一个时间表。因此,现在您将能够看到高于当前 3 个时间帧,而不是高于当前 2 个时间帧     启用/禁用警报/区域/MTF 功能的按钮 您获得的优势:     消除交易中的情绪。     客观化您的交易条目。     通过高概率设置提高您的利润。     节省绘图区域的时间。     像专业人士一样交易金融市场。     任何市场的即时多时间框架分析。 你在图表上看到了什么?     蓝色和红色矩形是当前时间范围的供需区。     虚线样式线是当前上方第一个时间范围内的供需区域。     实线样式线是当前上方第二个时间范围内的
MetaForecast M4
Vahidreza Heidar Gholami
5 (2)
MetaForecast能够根据价格数据中的谐波来预测和可视化任何市场的未来走势。虽然市场不总是可预测的,但如果价格中存在模式,MetaForecast可以尽可能准确地预测未来。与其他类似产品相比,MetaForecast通过分析市场趋势可以生成更精确的结果。 输入参数 Past size (过去的尺寸) 指定MetaForecast用于创建生成未来预测模型的柱数量。该模型以一条黄色线绘制在所选柱上。 Future size (未来的尺寸) 指定应预测的未来柱数量。预测的未来以粉色线表示,并在其上绘制了蓝色回归线。 Degree (程度) 此输入确定了MetaForecast将在市场上进行的分析级别。 Degree 描述  0 对于程度0,建议使用较大的值来设置“过去的尺寸”输入,以覆盖价格中的所有高峰、低谷和细节。  1 (建议的) 对于程度1,MetaForecast可以理解趋势,并通过较小的“过去的尺寸”生成更好的结果。  2 对于程度2,除了趋势,MetaForecast还可以识别反转点。对于大于1的程度,必须使用较高的“细节”和“噪音减少”输入值。  大于2 不建议使用大于
Introducing the Delta Volume Profile Indicator - Unleash the Power of Institutional Precision!  Technical Indicator: Are you ready to trade like the pros? The Delta Volume Profile Indicator is no ordinary tool. It’s a high-precision, cutting-edge indicator that puts the power of institutional-grade trading in your hands. This unique indicator analyses delta volume distribution in real-time, revealing the market's hidden buy/sell imbalances that the biggest financial institutions rely on to antic
RFI levels PRO
Roman Podpora
5 (1)
该指标能够准确显示反转点和价格回落区域。     行业领军人物 。您能洞察新趋势的形成,并以最高的精准度做出决策,掌控每一笔交易。 与……结合时,展现其最大潜力     趋势线专业版   指标  VERSION MT5 该指标显示的内容: 新趋势开始时的反转结构和反转水平及其激活。 显示屏   获利了结   和   止损   风险回报比最低的水平     RR 1:2       。 具有智能减值逻辑的止损。 显示指定指标中两种趋势类型的反转形态。 指标: 根据     趋势线     (全球趋势变化) 潮流专业版     (趋势快速变化) 简单有效   扫描器   实时趋势(新增)。 多时间框架工具筛选。 展示   利润   在 LOGIC AI 信号之后。 以下列出今日走势积极的金融工具。(RB键) 能够为终端启用通知(警报)功能,并向移动设备推送通知。 逻辑人工智能     — 利用人工智能寻找最佳切入点。 只有在启用 MTF(多时间框架分析)模式时,该功能才可用。 兼容性。 当与趋势线指标结合使用时,该指标能发挥其最大潜力。 这     RFI LEVELS PRO    
TPSpro RFI Levels
Roman Podpora
4.86 (28)
俄语说明 /  英文 说明   -  MT5 版本 主要功能: 显示卖家和买家的活跃区域! 该指标显示所有正确的买入和卖出的初始脉冲水平/区域。当这些水平/区域被激活时,即开始寻找入场点的位置,水平线会改变颜色,并填充特定颜色。此外,还会显示箭头,以便更直观地了解情况。 LOGIC AI - 激活模板时显示用于搜索入口点的区域(圆圈) 为了提高视觉清晰度,添加了使用人工智能搜索入口点的显示区域的功能。 显示更高时间范围内的级别/区域(MTF 模式) 新增使用更高时间间隔显示级别/区域的功能。此外,该指标还具有自动趋势检测功能 (   TPSproTREND PRO   )。 独立的专业分步交易算法 该算法专为顺势和逆势的日内交易而设计。每个活动模板均提供详细的说明。 适用于不同的时间范围 TPSpro RFI 水平指标可用于图表上的任何时间间隔,从分钟(M1)到每月(MN)。 图形和声音警报 该指标提供图形和声音提示,让您不会错过交易信号。 此外,还支持手机通知。 简单有效的活性模板扫描器 这是一个非常紧凑的主动模式扫描仪,当在一个方向上的所有时间间隔内激活模式时,它会自动发出警报并
Adaptive Volatility Range
Stanislav Konin
5 (3)
Adaptive Volatility Range [AVR] is a powerful tool for identifying key trend reversal points. AVR accurately reflects the Average True Range (ATR) of volatility, taking into account the Volume-Weighted Average Price (VWAP). The indicator adapts to any market volatility by calculating the average volatility over a specific period, ensuring a stable rate of profitable trades. You receive not just an indicator but a professional automated trading system , AVR-EA . Advantages: Automated Trading Sys
Dynamic Forex28 Navigator
Bernhard Schweigert
4.43 (7)
Dynamic Forex28 Navigator - 下一代外汇交易工具。 当前 49% 折扣。 Dynamic Forex28 Navigator 是我们长期流行的指标的演变,将三种功能合二为一: 高级货币强度 28 指标 (695 条评论)+ 高级货币 IMPULSE 带警报 (520 条评论)+ CS28 组合信号(奖励)。 有关指标的详细信息 https://www.mql5.com/en/blogs/post/758844 下一代强度指标提供什么? 您喜欢的原始指标的一切,现在通过新功能和更高的精度进行了增强。 主要特点: 专有货币强度公式。  所有时间范围内的平滑和准确的强度线。 非常适合识别趋势和精确进入。 动态市场斐波那契水平(市场斐波那契)。  此指标独有的独特功能。 斐波那契应用于货币强度,而不是价格图表。 适应实时市场活动以获得准确的反转区域。 实时市场动量。  第 9 行显示市场是活跃还是被动。 对于定时交易至关重要。 全面的警报和显示。  每种货币最强的买入和卖出动量。 ​​28 对的双重动量买入和卖出。 超买/超卖警告外部范围和止损。 反转
Super Reversal Indicator with Alert 概述 Super Reversal Indicator with Alert 是一款多时间周期交易工具,旨在通过结合随机指标动量、供需区域以及价格反转信号,帮助交易者识别高概率的市场反转机会。 该指标通过清晰的视觉信号和实时提醒,帮助交易者发现潜在的市场转折点。 核心功能 多时间周期随机指标分析 使用来自更高时间周期的随机振荡器(用户可自定义) 识别动量变化和交叉信号 包含超买和超卖水平,帮助实现更精准的入场 反转拒绝信号 检测关键价位上的强烈拒绝形态 识别以下位置的反转 日内高点卖出反转 日内低点买入反转 在图表上直接绘制箭头,直观清晰 供需区域 自动绘制来自 H4 和 D1 时间周期的重要区域 标记 供应区(潜在卖出区域) 需求区(潜在买入区域) 区域会动态更新并延伸至图表 智能提醒系统 弹出提醒 声音提醒 手机推送通知 邮件提醒(可选) 提醒触发条件包括 随机指标信号 拒绝信号 价格进入区域 可视化信号 在图表上显示买入和卖出箭头 清晰标注反转条件 界面简洁,易于阅读 交易逻辑 该指标结合三大核心要素来识别反
Advanced Supply Demand
Bernhard Schweigert
4.91 (299)
现在优惠 40%! 任何新手或专业交易者的最佳解决方案! 该指标是一款独特、高质量、且价格合理的交易工具,因为我们已经整合了许多专有功能和新公式。 依据此更新,您将能够显示双重时间帧区域。 您不仅可以显示一个较高的时间帧,还可以同时显示图表时间帧,加上更高的时间帧:显示嵌套时区。 供需双方所有交易者都会喜欢它。 :) 重要信息披露 高级供需的最大潜力,请访问 https://www.mql5.com/zh/blogs/post/720245   想象您的交易如何得以改善,是因为您能够精准定位入场或目标位吗? 构建于新的底层算法,它可以更轻松地识别出买卖双方之间的潜在失衡。 这是因为它以图形方式展示供需最强劲区域,及其过去的表现(显示旧区域)。 这些功能旨在帮助您更轻松地发现最佳入场区域和价位。 现在您可以针对您的交易品种和时间帧来优化和编辑区域强度! 高级供需指标适用于所有产品和时间帧。 它是一个新的公式,非常新的功能是两个区域强度函数可由用户输入进行调整! 这在交易中是一大优势。 当您学习如何使用专有功能,例如带有价格游离最小 X 因子的区域强度时,您能够判断该区域强劲与否。 供需
Currency Strength Wizard
Oleg Rodin
4.85 (59)
货币强度向导是一个非常强大的指标,为您提供成功交易的一体化解决方案。该指标使用多个时间范围内所有货币的数据来计算这个或那个外汇对的力量。此数据以易于使用的货币指数和货币电力线的形式表示,您可以使用它们来查看这种或那种货币的力量。 您所需要的只是将指标附加到您要交易的图表上,该指标将向您显示您交易的货币的真实强度。该指标还向您显示买卖量压力的极值,您可以在顺势交易时利用这些压力。该指标还显示了基于斐波那契的可能目标。该指标可用于各种交易时间范围。该指标支持各种货币对的交易。 该指标为您提供所有类型的警报,包括推送通知。 购买后请联系我。我将与您分享我的交易技巧,并免费为您提供丰厚的红利指标! 祝您交易愉快,获利丰厚!
Volatility Trend System - a trading system that gives signals for entries. The volatility system gives linear and point signals in the direction of the trend, as well as signals to exit it, without redrawing and delays. The trend indicator monitors the direction of the medium-term trend, shows the direction and its change. The signal indicator is based on changes in volatility and shows market entries. The indicator is equipped with several types of alerts. Can be applied to various trading ins
Super Signal Market Slayer 無重繪|高精準|多市場智能趨勢指標 在市場中,真正困難的不是下單, 而是在混亂的波動中,看清「趨勢是否已經開始」。 Market Slayer 正是為此而生。 這是一款專為日內交易設計的無重繪智能指標, 透過多層確認與趨勢過濾機制,只在關鍵時刻給出清晰、可信的 Buy / Sell 訊號。 核心優勢 無重繪信號 訊號一旦出現即固定,不回跳、不消失,所見即所得。 高精準趨勢判斷 經多品種實測,於黃金 M5 / M15 週期表現尤為穩定。 多市場支援 適用於黃金、外匯、指數與主流加密貨幣。 專為日內交易優化 聚焦 M5、M15,避免雜訊,提升可執行性。 清晰直觀 初學者亦可快速理解與使用。 技術邏輯簡述 Market Slayer 並非單一箭頭邏輯,而是整合: 趨勢方向識別 動量啟動確認 市場雜訊過濾 自適應靈敏度調整 只保留「值得出手」的交易機會,避免情緒化進場。 適合誰使用 想遠離隨機交易、建立紀律系統的交易者 對重繪與延遲指標感到厭倦的日內交易者 希望與 EA 或半自動策略搭配的使用者 使用建議 預設參數已針對黃金與外匯
TrendLine PRO MT4
Evgenii Aksenov
4.83 (167)
Trend Line PRO   指标是一个独立的交易策略。 它显示趋势变化,交易的入口点,以及自动计算三个级别的止盈和止损保护 Trend Line PRO  非常适合所有元交易者符号:货币,金属,加密货币,股票和指数 该指标用于真实账户交易,这证实了该策略的可靠性 您可以在这里找到使用   Trend Line PRO   和真实信号的机器人:   https://robomarket.org/product-category/signals/ 目前,Trend Line PRO指标的售价为75美元。 促销后价格为 149 美元 。 趋势线专业的优点 永远不要重绘它的信号; 将其作为独立策略的可能性; 它有三个自动水平止盈和止损水平  该指标具有iCustom信号缓冲区,允许您基于它创建交易机器人 具有通知功能 该指标已证明其在真实账户交易中的有效性 如何设置和优化趋势线PRO指标: 通过更改幅度参数以及 TP 和 SL 水平,将重点放在指标面板上的利润上 您可以使用以下方式自动优化指标参数: Optimizer Utility 详细说明(ENG): 这里 趋势线PRO指标如
FX Power MT4 NG
Daniel Stein
4.95 (21)
FX Power:分析货币强度,助您做出更明智的交易决策 概述 FX Power 是一款专业工具,帮助您全面了解主要货币和黄金在任何市场条件下的真实强度。通过识别强势货币用于买入,弱势货币用于卖出, FX Power 简化了交易决策,并帮助您发现高概率的交易机会。不论您是想跟随趋势还是通过极端的 Delta 值预测反转,这款工具都能完美适应您的交易风格。别再盲目交易——用 FX Power 让您的交易更加智慧。 1. 为什么 FX Power 对交易者极具价值 实时货币和黄金强度分析 • FX Power 实时计算并显示主要货币和黄金的相对强度,助您全面了解市场动态。 • 监控领先或落后资产,轻松识别值得交易的货币对。 全面的多时间框架视图 • 跟踪短期、中期和长期时间框架的货币和黄金强度,以便将您的交易策略与市场趋势保持一致。 • 无论是快进快出的短线交易还是更长期的投资策略, FX Power 都能为您提供所需的信息。 Delta 动态分析用于趋势和反转 • 极端 Delta 值常常预示反转机会,而平缓的 Delta 变化则确认趋势延续。 • 使用 Delta 分析,轻
Matrix Arrow Indicator MT4
Juvenille Emperor Limited
5 (3)
矩阵箭头指标 MT4 是一种独特的 10 合 1 趋势,遵循 100% 非重绘多时间框架指标 ,可用于所有符号/工具:外汇、商品、加密货币、指数、股票。  Matrix Arrow Indicator MT4 将在其早期阶段确定当前趋势,从多达 10 个标准指标中收集信息和数据,它们是: 平均定向运动指数 (ADX) 商品渠道指数 (CCI) 经典 Heiken Ashi 蜡烛 移动平均线 移动平均收敛散度 (MACD) 相对活力指数 (RVI) 相对强弱指数 (RSI) 抛物线SAR 随机振荡器 威廉姆斯的百分比范围 当所有指标给出有效的买入或卖出信号时,相应的箭头将打印在图表上,在下一根蜡烛/柱线开盘时,指示强劲的上升趋势/下降趋势。用户可以选择使用哪些指标,并可以单独调整每个指标的参数。 Matrix Arrow Indicator MT4 仅从选定的指标中收集信息,并仅根据其数据打印箭头。 Matrix Arrow Indicator MT4 还可以为所有新信号发送终端、推送通知或电子邮件警报。无论您是黄牛、日内交易者还是波段交易者, Matrix Arrow Indicat
目前八折优惠! 对任何新手或专家交易者来说都是最好的解决方案! 这个仪表板软件适用于28种货币对。它基于我们的两个主要指标(高级货币强度28和高级货币冲动)。它对整个外汇市场提供了一个伟大的概述。它显示高级货币强度值,货币运动速度和28个外汇对在所有(9)时间段的信号。想象一下,当你可以使用图表上的单一指标观察整个市场,以确定趋势和或剥头皮的机会时,你的交易将得到改善 我们已经在这个指标中建立了一些功能,使你更容易识别强势和弱势货币,同时识别和确认潜在的交易。该指标以图形方式显示货币的强势或弱势是增加还是减少,以及它在所有时间段的表现。 增加的新功能是动态市场斐波那契水平,它适应当前的市场条件变化,这是一个已经在我们的高级货币强度28和高级货币冲动指标中使用的成熟的加分项。 在交易时,总是将弱势货币和强势货币配对,这个新指标将帮助你做到这一点。 用户手册:点击这里  https://www.mql5.com/en/blogs/post/708783 特点  显示每个时间段的ACS28和GAP-speed(冲动)的货币强度值。 列:颜色代码以7种颜色显示货币强度:强势
Order Block Hunter
Noha Mohamed Fathy Younes Badr
5 (10)
Order block hunter indicator is the best indicator for  hunt the order blocks that area where there has been a large concentration of limit orders waiting to be executed Order blocks are identified on a chart by observing previous price action and looking for areas where the price experienced significant movement or sudden changes in direction .This indicator does that for you by using very complicated codes and helps you to take the best areas To buy and sell because it make marks at the best a
Trend indicator AI
Ramil Minniakhmetov
4.49 (84)
趋势人工智能指标是一个伟大的工具,将加强交易者的市场分析结合趋势识别与可操作的进入点和逆转警报。 该指标使用户能够自信和精确地驾驭外汇市场的复杂性 除了主要信号,趋势Ai指标识别在回调或回调期间出现的次要入口点,使交易者能够利用既定趋势内的价格修正。 重要优势: *MT4及MT5工程 *明确买入或卖出信号 ·不重绘 *适用于所有资产 小心我不卖EA或设置电报它骗局. 所有设置免费在这里的博客。  重要! 购买后立即与我联系,以获得指示和奖金! 真实的操作监控以及我的其他产品可以在这里找到: https://www.mql5.com/en/users/mechanic/seller&nbsp ; 设置和输入: 建议为所有资源设置默认设置。 第...
GEM Signal MT4
Shengzu Zhong
GEM Signal Pro GEM Signal Pro 是一款適用於 MetaTrader 4 的趨勢跟隨指標,專為希望在圖表上獲得更清晰訊號、更有結構的交易設定,以及更實用風險管理的交易者而設計。 它不僅僅顯示一個簡單的箭頭,GEM Signal Pro 還能以更清晰、更易讀的方式呈現完整的交易思路。當條件確認完成後,指標可在圖表上顯示進場價、止損價與止盈目標,幫助交易者更有效率地評估交易設定。 運作方式 該指標首先根據其內部邏輯識別有效的初始訊號。 當確認條件滿足後,GEM Signal Pro 會在圖表上顯示完整的交易設定。這讓交易者可以更清楚地看到交易結構,並減少手動分析與計算的工作量。 圖表上的交易價位 對於已確認的訊號,GEM Signal Pro 可顯示: 進場價 止損價 止盈 1 止盈 2 止盈 3 風險報酬比 這讓交易設定更容易理解,也有助於讓圖表分析更有條理。 內建風險管理 風險管理是此指標設計的重要部分。 止損位基於近期市場結構,結合附近的擺動高低點與可選的 ATR 緩衝距離。這能讓交易價位更貼近當前市場條件,而不只是依賴固定距離。 圖表資訊面板 GEM Si
购买此指标即可免费获得我的专业交易管理器。 首先,值得强调的是,这个交易系统是一个非重绘、非重画和非滞后的指标,这使得它非常适合手动和机器人交易。 在线课程,手册和下载预设。 “智能趋势交易系统 MT5”是专为新手和经验丰富的交易者量身定制的综合交易解决方案。它结合了超过 10 个优质指标,具有 7 多个强大的交易策略,使其成为适用于各种市场条件的多功能选择。 趋势跟随策略:提供精确的入场和止损管理,以有效地跟随趋势。 反转策略:识别潜在的趋势反转,使交易者能够利用区域市场的机会。 剃头策略:专为快速准确的日内交易和短期交易而设计。 稳定性:所有指标都不会重绘、不会重画和不会滞后,确保可靠的信号。 定制:支持自定义策略,以满足个人交易偏好。超过 7 种策略和组合可帮助您找到最佳策略。 信号清晰度:提供箭头信号,以指示清晰的入场和退出点。 实时警报:通过交易进出警报使交易者保持了解。 深入分析:提供更高时间框架的趋势分析和实时交易监控。 自适应颜色编码:利用蜡烛颜色编码来显示成交量、趋势和反转蜡烛信号。通过蜡烛颜色分析市场方向。 “智能趋势交易系统 MT5”赋予交易者必要的工具,以便在
Harmonic Pattern Plus MT4
Young Ho Seo
4.44 (18)
Introduction Harmonic Patterns are best used to predict potential turning point. Traditionally, Harmonic Pattern was identified manually connecting peaks and troughs points in the chart. Manual harmonic pattern detection is painfully tedious and not suitable for everyone. You are often exposed under subjective pattern identification with manual pattern detection. To avoid these limitations, Harmonic Pattern Plus was designed to automate your harmonic pattern detection process. The functionality
Blahtech Supply Demand
Blahtech Limited
4.58 (36)
Was: $299  Now: $99   Supply Demand uses previous price action to identify potential imbalances between buyers and sellers. The key is to identify the better odds zones, not just the untouched ones. Blahtech Supply Demand indicator delivers functionality previously unavailable on any trading platform. This 4-in-1 indicator not only highlights the higher probability zones using a multi-criteria strength engine, but also combines it with multi-timeframe trend analysis, previously confirmed swings
Sygnalizator
Kacper Piskorz
Hi, I made one of best sygnalizators on a stock markets. It's prepared for a pro players. There is not even, a one mistake. It works on every timeframe and every stock market. Test it before you say something, in my 7 years I check houndreds of fakes. This one work right in time, not in slow motions. It' s a dot with 3 levels of strong power depends on how strong market is. If power is high you have very profitable results but the most important it's allways on time. So it is protecting your acc
作者的更多信息
Entry Point M5 — 完整的交易系统 Entry Point M5 是一款强大的指标,被设计成一个功能完善的交易系统,适用于任何货币对。它能够分析价格结构,识别市场反转的关键时刻和新的趋势动能。该指标可以自动适应不同的市场阶段——无论是强趋势行情还是横盘震荡——都能提供清晰直观的交易信号,无需额外的过滤器或辅助工具。 使用这个系统的交易方式非常简单。当 绿色箭头 出现时,开立 买单(Buy) ;当 红色箭头 出现在图表上时,关闭所有买单并开立 卖单(Sell) ;当下一次绿色箭头出现时,关闭所有卖单并重新开立买单。这样,指标就形成了一个完整的交易系统,无需主观判断,只需严格遵循信号。 Entry Point M5 可用于任何货币对和大多数时间周期,包括 M1、M5、M15、H1 及更高周期。凭借内部的自适应公式,指标能够根据不同品种的波动性和价格尺度自动调整参数。 逻辑与工作原理 Entry Point M5 的核心是一个复杂的市场高低点(Pivot 点)识别系统,结合了智能假信号过滤机制以及价格偏离平均值的分析。算法综合了多种技术分析方法,从而最大程度减少虚假信号,只捕捉
XL arrow
Andrey Kozak
XL Arrow is a signal indicator that displays market entry points. The red arrow and the DOWN signal at the right corner indicate it is time to sell, while the blue arrow and the UP signal indicate it is time to buy. Settings PeriodSlower - indicator slowing period. PeriodFaster - indicator acceleration period. Recommendations trading pairs: EURUSD, GBPUSD and USDJPY timeframes: M5 - H4
Quantum
Andrey Kozak
The Quantum Expert Advisor is designed for trading EURUSD H1 . The trading algorithm lies in placing pending orders at the peaks of currency fluctuations, after a preliminary analysis of the market conditions. Trading is fully automated. Lot size is calculated automatically based on the lot percentage. Parameters MaxRisk - percentage of the deposit, used for the automatic calculation of the lot. LongWave - long wave of price fluctuation. ShortWave - short wave of price fluctuation. Level contro
BoxetFx
Andrey Kozak
The BoxetFx Expert Advisor analyzes the market using multiple trading strategies. Once the optimal signals for opening trades are obtained, the EA automatically determines the order volume as a percentage pf the deposit. Next, a pending order is placed in the direction of the expected price movement. When the deal reaches an optimal profit or loss level, it is automatically closed. Multiple analytical centers of information processing allow the EA to diversify the possible risks of the trader by
Medok
Andrey Kozak
The Medok indicator shows the market entry and exit points on the chart using arrows and resistance lines. The indicator is very easy to use. Buy when a blue arrow appears and sell when a red arrow appears. After an order is opened, it is recommended to close a buy position when the price reaches the lower resistance level or to close a sell position when the price reaches the upper resistance level. Recommended values for EURUSD H1 Periods - 2; Acceleration - 0.02. Recommended values for EURU
TOP Xios
Andrey Kozak
TOP Xios is a ready-made trading system, which provides the trader with signals for opening and closing deals. The information panel in the right corner of the screen shows the total number of signals, the number of points in profit or loss and the percentage of valid and false signals. Working with this indicator is very simple. As soon as a blue arrow appears, open a buy deal and wait for a red cross to appear, which indicates the necessity to close the deal. When a red arrow appears, open a s
Buy Market Scanner is a ready-made trading system, which shows the moments when it is necessary to open or close deals. Buy arrows appear on the zero bar without delay and redrawing. The same applies to signals for closing orders. They appear on the zero bar and are not redrawn. The number of profit or loss in points for a certain time period is displayed in the top right corner of the indicator. The indicator works best on the EURUSD currency pair with the H1 timeframe. Operation Principles In
DayWay
Andrey Kozak
The DayWay indicator shows the current trend direction on the chart as a colored line. The best timeframes for operation are M5 and higher. Works on all currency pairs. Suitable for any scalping strategies. Quite easy to use. Recommendations on usage When a blue line appears, wait for a candle to close and open a buy order. When a red line appears, wait for the current candle to close and open a sell order. Parameters Periods - period of the indicator.
Forex Gump
Andrey Kozak
2.4 (5)
Forex Gump is a fully finished semi-automatic trading system. In the form of arrows, signals are displayed on the screen for opening and closing deals. All you need is to follow the instructions of the indicator. When the indicator shows a blue arrow, you need to open a buy order. When the indicator shows a red arrow, you need to open a sell order. Close orders when the indicator draws a yellow cross. In order to get the most effective result, we recommend using the timeframes H1, H4, D1. There
Leo Trend
Andrey Kozak
Leo Trend is a signal indicator that shows the market entry points, as well as the trend direction and flat on the chart in the form of arrows and lines. Leo Trend will be useful both for beginners creating a trading strategy, and for professionals to integrate into ready-made trading systems. Leo Trend works without redrawing and without significant delays. The operation of the indicator is demonstrated in the video. In addition, you can test this indicator in the strategy tester free of charge
Nizma
Andrey Kozak
NIZMA is a ready-made trading system, that is the most efficient on the EURUSD, AUDUSD and GBPUSD currency pairs. The best timeframes are M5 and higher. The system shows the market entry points in the form of arrows, and also displays the information on the strength and direction of the trend. The signals are easy to interpret. It is suitable for both novice and professional traders. With the properly selected settings, it gives the minimum number of false signals. In tests, this number did not
XPointer
Andrey Kozak
5 (3)
XPointer is a completely ready trading system. It shows the trader when to open and close a trade. It works on all currency pairs and all time frames. Very easy to use and does not require additional indicators for its operation. Even a beginner trader can start working with XPointer. But it will also be useful for professional traders to confirm the opening of orders. Features of the XPointer indicator It does not redraw its values. It works on all currency pairs and all time frames. It has al
Lobster
Andrey Kozak
Lobster is a ready-made trading system with a flexible market analysis algorithm. It performs most of the work for a trader. All you have to do is open and close orders following the indicator signals. The indicator will be very useful for both beginners and professionals. It is able to work with other indicators and independently. Features No signal repainting; Any pair; Any timeframe; Flexible market analysis system. How to trade When the blue arrow appears, open a buy order; When the blue c
Gets
Andrey Kozak
Gets is a smart trading system with complex market analysis mechanism. The operation principle of Gets is based on neural networks and diversified collection of information from various market analyzers. Then the system analyzes the statistical databases to create a general idea of the current market situation and the further price movement. The information is displayed on the screen in a simple and intuitive way - in the form of buy and sell arrows. Also, the information on the current trend st
Scalper Zoom
Andrey Kozak
Scalper Zoom is a new trading system designed to facilitate the process of Forex trading both for beginners and professionals. The Scalper Zoom indicator uses an adaptive method of operation and analyzes the market using multiple trading algorithms, while selecting the most efficient one for the given currency pair and timeframe. Working with this indicator is very simple. When a red vertical line appears, open a sell order. Close it when a blue vertical line appears. Follow the opposite steps f
Brabux
Andrey Kozak
Brabux is a ready-made mechanical trading system. It works on all currency pairs and timeframes automatically adjusting to them. It also selects the most efficient trading parameters for receiving a necessary profit. In the indicator parameters, specify the trading period used for calculations and the least acceptable profit in points. Next, the system automatically selects the necessary trading parameters. Trading data is displayed on the info panel. After setting the indicator on the chart and
CoolLine
Andrey Kozak
CoolLine is a signal indicator displaying on a chart points for opening and closing trade positions. The indicator signals are not redrawn. It draws arrows on the zero bar Open[0]. It works on all currency pairs and all time frames. Indicator Advantages Precisely shows the opening and closing points on the chart Does not redraw signals Works on all currency pairs and timeframes Very easy to use; suitable even for beginners Has a very flexible system of settings Can send push and email notificat
Market Scanner Elite is a new generation of indicators of the Market Scanner series. The Elite version features an improved market analysis algorithm, with a better identification of the entry points and filtering of the false signals. The logic of market analysis and calculation of effective entry points applied in this product are significantly different from those applied in Market Scanner . This indicator cannot be called a big brother, as it is a completely new product with innovative analy
Forex Gump Pro
Andrey Kozak
4 (5)
Attention! Friends, since there have been many scammers on the Internet recently selling indicators called ForexGump, we decided to warn you that only on our page is the LICENSE AUTHOR'S VERSION of the INDICATOR sold! We do not sell this indicator on other sites at a price lower than this! All indicators are sold cheaper - fakes! And even more often sold demo versions that stop working in a week! Therefore, in order not to risk your money, buy this indicator only on this site! Forex Gump Pro is
Market Trend
Andrey Kozak
Market Trend - a comprehensive system for determining the trend direction. Analyzes the market using a formula which considers the values of multiple technical indicators and other trading strategies. IT determines not only the current trend direction, but also its movement strength. The indicator is intuitive and very easy to use. The information on the current trend direction and its movement strength are displayed on the chart. If the indicator shows "UP!" then an uptrend is currently present
Aggressive intraday scalper is a mechanical system for intraday scalping, which displays trade opening and closing signals as arrows on the chart. When a signal emerges, the indicator sends email and push notifications. So, you don't have to stay by the monitor analyzing the market and waiting for a signal. Aggressive intraday scalper will do it for you. The system has been developed for those traders who do not have their own trading system and who would love to quickly start trading using the
Jerus Line Scalper is an indicator for scalping on EURUSD, GBPUSD, AUDUSD, USDJPY and USDCAD pairs. Recommended pairs: M5, M15, M30 and H1. The trading strategy is as follows: as soon as the arrow appears, open an order in the direction of the arrow and set take profit to +10 points. Set stop loss at the indicator's stop line. Stop line is displayed in red or blue depending on the indicator signal. Also, the Martingale system can be applied in the system. If a trade is closed at a loss, the next
DotaScalping
Andrey Kozak
DotaScalping is a semi-automated trading system for scalping. The indicator shows recommended moments for opening Buy/Sell trades as dots on the chart. Signals are generated based on the algorithm for price amplitude smoothing. The indicator tries to accurately calculate the moments of the maximum peak price values ​​and produces signals based on the smoothed correlation. The indicator determines the High and Low price values and generates signals based on the trend direction. The indicator is v
ForexGumpUltra
Andrey Kozak
3.25 (4)
ForexGumpUltra is a new and more advanced indicator of the ForexGump series. This indicator easily determines the price direction on any currency pair and any timeframe. The indicator draws its signals on the zero bar and does not redraw them (see the video). In the 34th second of the video it can be seen that this indicator uses new filters to determine the changes in price movement direction without delay, despite the market noise present at the moment (see the video on the 34th second). Once
Forex Gump Scalping
Andrey Kozak
5 (2)
Attention! Friends, since there have been many scammers on the Internet recently selling indicators called ForexGump, we decided to warn you that only on our page is the LICENSE AUTHOR'S VERSION of the INDICATOR sold! We do not sell this indicator on other sites at a price lower than this! All indicators are sold cheaper - fakes! And even more often sold demo versions that stop working in a week! Therefore, in order not to risk your money, buy this indicator only on this site! Forex Gump Scalpin
Bomb Scalper
Andrey Kozak
Bomb Scalper is a ready-made mechanical trading system that analyzes the market using 12 market signals, as well as candle patterns, providing signals for opening and closing trades. On the screenshot below, you can see how the system draws the blue arrow for buying and the red one for selling. Order close signal is shown as the yellow arrow. Besides, during a closing signal, the indicator calculates potential profit/loss. How the indicator works After launching, Bomb Scalper navigates through
Striker
Andrey Kozak
Stiker is a robot capable of trading in automatic or semi-automatic mode . If auto=true in the robot settings, the robot automatically opens and closes orders on its own when a signal appears. If auto=false, the robot analyzes the market and shows signals on the screen, while a trader manually confirms opening or closing orders by clicking the Open Buy and Close Order buttons. This is done to enable traders make trading decisions themselves. This reduces the trading risk. Striker is a smart syst
If you do not yet have your trading strategy, you can take advantage of our ready-made trading strategy, which is most effective for EURUSD H1 currency pair. The indicator "Ready Made Scalping System" automatically analyzes the market and shows the trader when to open and close orders. You just need to follow his instructions. When the arrow appears - open the order, when a square appears with a tick - close the warrant. For convenience of the trader, the indicator when signals appear sends a m
Amok
Andrey Kozak
Amok is a fully automatic trading system that was developed for trading on the EURUSD currency pair, H1 timeframe on micro accounts. Nevertheless, as practice shows, this trading system works well in other currency pairs. Principle of work of the trading robot Amok In the algorithm of the robot, there are more than 7 different trading strategies. This was done to ensure that the robot could work more stably in different market conditions. The program part of the robot uses 12 different indicato
ForexGumpXL
Andrey Kozak
5 (1)
ForexGumpXL is a new generation in the forex gump indicator line. More accurate, faster, less complicated in the settings is all about the new ForexGumpXL indicator. In the new version of the indicator, we have applied a truly new algorithm of work. Now he does not just analyze the market for a price reversal, but with the help of an adaptation algorithm, determining the current volatility in the market indicator with a high degree of probability is able to anticipate false price reversals in or
筛选:
Osama Echchakery
19097
Osama Echchakery 2023.11.28 19:02 
 

用户没有留下任何评级信息

回复评论