• 概述
  • 评论
  • 评论

Trend Deviation

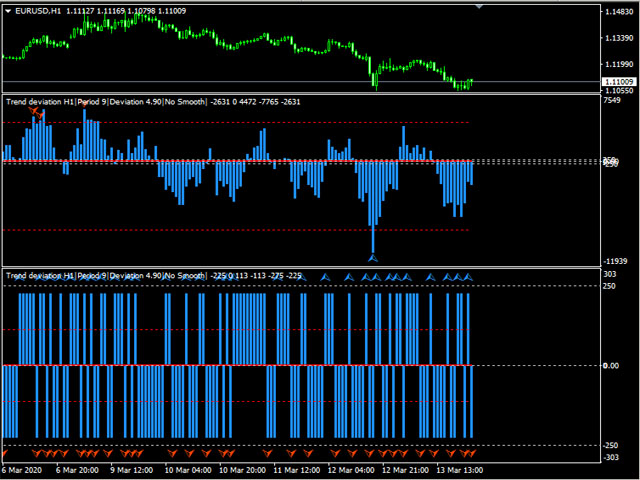
Trend indicator with calculation of dynamic levels and signaling their intersection.

Description of input parameters:

StepTF = true; - Calculation of the indicator by closing the bar (true) or by each tick (false)

BarsCount = 300; - Number of settlement bars

Price = PRICE_CLOSE; - Type of price used

TimeFrame = PERIOD_CURRENT; - Estimated timeframe

TrendPeriod = 9; - Trend calculation period

TrendDeviations = 4.9; - coefficient of deviation

PeriodTrendSmooth = 1; - Trend smoothing period

ModeTrendSmooth = MODE_SMA; - Trend smoothing mode

TrendContinue = false; - Continuation of the trend in the calculations

DeltaCut = 180; - Minimum trend in trend chart units (0 - disabled)

TrendCut = 0; - Trimming level of the trend graph when crossing the base levels

OutCut = 0; - Trimming level of the final trend graph (0 - disabled)

Levels = 250; - Basic levels

LevelsShift = 30; - Minimum distance when crossing dynamic levels for triggering signals

LevelsPercent = 50; - Percentage of calculation of dynamic levels from the extremes of the trend graph

TrendWidth = 2; - Thickness of the trend line (1-5)

TrendColor = clrDodgerBlue; - The color of the trend line

AverageWidth = 2; - Thickness of the zero line of the graph (1-5)

AverageColor = clrRed; - Chart zero line color

LevelsWidth = 1; - Thickness of level lines (1-5)

LevelsColor = clrRed; - Color of level lines

ShowBaseLevels = true; - Show base levels (true)

BaseLevelsColor = clrSilver; - The color of the lines of the basic levels

ArrowUpColor = clrDodgerBlue; - Up arrow color

ArrowDownColor = clrOrangeRed; - Down arrow color

ArrowShift = 50; - Offset arrows relative to the trend graph

ArrowSize = 1; - Arrow size (1-5)

ArrowStyleUp = 217; - Up arrow code

ArrowStyleDn = 218; - Down arrow code

Trigger = false; - Exclude the repetition of unidirectional arrows (true)

Revers = false; - Flip signal (true)

AlertsMessage = false; - Enable alarm messages (true)

AlertMail = false; - Enable sending email when signal (true)

AlertPush = false; - Enable sending messages to the mobile terminal (true)
推荐产品
Master scalping M1
Nataliia Marchuk
Master Scalping M1 is an innovative indicator that uses an algorithm to quickly and accurately determine the trend.The indicator calculates the time of opening and closing positions, the indicator's algorithms allow you to find the ideal moments to enter a deal (buy or sell an asset), which increase the success of transactions for most traders. Benefits of the indicator: Easy to assemble, does not overload the chart with unnecessary information. Can be used as a filter for any strategy. Works on
Infinity Trend Pro
Yaroslav Varankin
1 (1)
This is a trend indicator without redrawing Developed instead of the binary options strategy (by the color of the Martingale candlestick) Also works well in forex trading When to open trades (binary options) A signal will appear in the place with a candle signaling the current candle It is recommended to open a deal for one candle of the current timeframe M1 and M5 When a blue dot appears, open a deal up When a red dot appears, open a trade down. How to open trades on Forex. When a signal is rec
An indicator of pattern #31 ("Long Island") from Encyclopedia of Chart Patterns by Thomas N. Bulkowski. The second gap is in the opposite direction. Parameters: Alerts - show alert when an arrow appears   Push - send a push notification when an arrow appears (requires configuration in the terminal) GapSize - minimum gap size in points ArrowType - a symbol from 1 to 17 ArrowVShift - vertical shift of arrows in points   ShowLevels - show levels ColUp - color of an upward line ColDn - color of a
Wave Wolf MT4
Andrei Salanevich
Wave Wold MT4外汇指标旨在搜索狼波并将其显示在交易终端的当前窗口中。 对于在交易中使用狼波的交易者来说,这是一个很好的指标。 它在交易策略中的应用将显着提高其效率和盈利能力。 有关指标的信息 与其他Wolf wave指标不同,Wave Wold MT4外汇指标具有许多显着提高其有效性的功能: 第一个是打开的Windows5point参数(真值)提供信息支持,即扩展了狼波出现在其上的图表的窗口。 例如,如果EURUSD、AUDUSD和GBPUSD图表是开放的,并且每个图表都安装了Wave WOLD MT4指标,那么如果检测到欧元模型,相应的图表将自动被带到其他图表的顶部,这在交易大量工具时变得非常方便。  第二个功能是MACD上的内置发散分析,用户可以自己选择参数(默认设置(12,26,9))。 顺便说一下,通常振荡器的值不显示在工作窗口上,只反映在形成点(5)时的价格标签的颜色上,特别是,如果标签的颜色是蓝色,则没有发散,如果颜色是红 如何使用指标 Wave WOLD MT4指标显示第4个形成点的假设Wolf模型和第5个点的形成区域(所谓的甜区,以黄色显示)。 如
Trade with Gann on your side!! MASTER CIRCLE 360 CIRCLE CHART, originally created by Gann admitted that this is “The Mother of all charts”. It is one of the last studies that this great trader left for us. The numeric tab le is apparently quite simple like all the tables and is based on square numbers, the SQUARE OF 12 and is by evolution, one of the most important square numbers. Here we can find CYCLE, PRICE AND TIME thanks to angles and grades, to show past and future support and resistance.
What are Heiken Ashi Candles? Heiken Ashi, derived from the Japanese term 'Heikin Ashi,' translates to average price bars. It's an indicator depicting price bars on a chart. Formula for Heiken Ashi candles: - Heiken Ashi opening price: (previous candle's opening + closing price) / 2 - Closing price Heiken Ashi: (opening + high + low + closing) / 4 - Heiken Ashi peak: Max of high, opening, or closing price - Heiken Ashi bottom price: Min of low, opening, or closing price How to Read Heiken A
这是一个预测蜡烛收盘价的指标。 该指标主要用于 D1 图表。 该指标适用于传统外汇交易和二元期权交易。 该指标可以用作独立的交易系统,也可以作为您现有交易系统的补充。 该指标分析当前蜡烛,计算蜡烛本身内部的某些强度因素,以及前一根蜡烛的参数。 因此,该指标预测市场走势的进一步方向和当前蜡烛的收盘价。 由于这种方法,该指标既适用于短期盘中交易,也适用于中长期交易。 该指标允许您设置指标在分析市场情况期间将产生的潜在信号的数量。 在指标设置中有一个特殊的参数。 此外,该指标可以通过图表上的消息、电子邮件以及推送通知的形式通知新信号。感谢您的关注!交易愉快! 购买后一定要写信给我! 我会给你我的交易指标的建议! 还可以获得奖金!
TWO PAIRS SQUARE HEDGE METER INDICATOR Try this brilliant 2 pairs square indicator It draws a square wave of the relation between your two inputs symbols when square wave indicates -1 then it is very great opportunity to SELL pair1 and BUY Pair2 when square wave indicates +1 then it is very great opportunity to BUY pair1 and SELL Pair2 the inputs are : 2 pairs of symbols         then index value : i use 20 for M30 charts ( you can try other values : 40/50 for M15 , : 30 for M30 , : 10 for H1 ,
Super Reversal Pattern
Parfait Mujinga Ndalika
Super Reversal Pattern Indicator Unlock the power of advanced pattern recognition with our Super Reversal Pattern Indicator. Designed for traders seeking precision and reliability, this indicator identifies one of the most effective reversal patterns in technical analysis, offering a significant edge in your trading strategy. Key Features: Non-Repainting Accuracy: Enjoy the confidence of non-repainting technology. Once a Super Reversal Pattern is detected, it remains static, providing consiste
Owl smart levels
Sergey Ermolov
4.24 (37)
MT5版本  |  FAQ Owl Smart Levels Indicator   是一個完整的交易系統,包含   Bill Williams   的高級分形、構建正確的市場波浪結構的 Valable ZigZag 以及標記準確入場水平的斐波那契水平等流行的市場分析工具 進入市場和地方獲利。 策略的详细说明 指示灯使用说明 顾问-贸易猫头鹰助手助理 私人用户聊天 ->购买后写信给我,我会将您添加到私人聊天中,您可以在那里下载所有奖金 力量在於簡單! Owl Smart Levels   交易系統非常易於使用,因此適合專業人士和剛開始研究市場並為自己選擇交易策略的人。 策略和指標中沒有隱藏的秘密公式和計算方法,所有策略指標都是公開的。 Owl Smart Levels 允許您快速查看進入交易的信號,突出顯示下訂單的水平並向您發送有關已出現信號的通知。 優點很明顯: 清楚地顯示主要和更高時間框架的趨勢方向。 指示儀器信號的出現。 標記開單、止損設置和固定利潤的水平。 沒有多餘的,只有必要的結構! ZigZag   表示全球趨勢的方向,因此也表示貿易方向。 市場反轉點的短線清楚地表明在什
Trend Oscillator mw
DMITRII GRIDASOV
趋势振荡器 - 是一种高级自定义 Crypto_Forex 指标,高效的交易工具! - 使用高级新计算方法 - 参数“计算价格”有 20 个选项。 - 有史以来最平滑的振荡器。 - 绿色表示上升趋势,红色表示下降趋势。 - 超卖值:低于 5,超买值:超过 95。 - 使用此指标,有很多机会升级标准策略。 - 具有 PC 和移动警报。 .................................................................................................................... // 出色的交易机器人和指标可在此处获取: https://www.mql5.com/en/users/def1380/seller 这是仅在此 MQL5 网站上提供的原创产品。
Are you tired of the uncertainty that arises when your orders fail to stop at a specific line due to the spread? Look no further! Introducing our  indicator that plots candlesticks based on the Ask price instead of the traditional bid-based chart commonly used in MQL4. With this indicator, you can say goodbye to the frustrations caused by the bid-based chart, as it provides you with a more accurate representation of market movements. By utilizing the Ask price, which represents the price at whic
我们为您提供一个指标"蜡烛收盘台",它将成为您在贸易领域不可或缺的助手。 这就是为什么知道蜡烛何时关闭会有所帮助的原因: 如果你喜欢使用蜡烛花纹进行交易,你就会知道蜡烛何时关闭。 此指标将允许您检查是否形成了已知模式以及是否存在交易的可能性。 该指标将帮助您做好市场开放和市场关闭的准备。 可以设置一个计时器来创建计划新闻的预览,这样就可以检查市场对此的反应。 您可以设置指示灯,以便在蜡烛关闭前几秒钟发送警报/警告。 通知/警报/警报可以发送到: 屏幕警报 电子邮件 移动应用 MT4烛台计时器指示器为什么有用 那么烛台计时器什么时候有用呢?如果你长期交易,你可能不需要蜡烛计时器指示器,因为你的参赛不会受到一分钟或一小时的太大影响。但是,如果你在短时间内是黄牛或交易员,那么你知道时机非常重要。 外汇市场24小时开放,只在周末关门,有些策略可能会受到您入仓时出现错误时机的严重影响。 MT4蜡烛计时器指示器可以显示当前蜡烛中的剩余时间,以便为下一次蜡烛打开做好准备。 可以从这一指标中受益的一些情况例子有: 预定消息传出 地理市场开闭 预定发生的事件,通常是金融、经济或政治事件
Signal trend indicator. Detects the direction of the trend and is coloured accordingly.  Has built in audible and visual alerts when trends change. Can send notifications to your phone or email. Allows Trend and Counter-Trend trading. Works on all timeframes, all currency pairs, metals, indices and cryptocurrencies. Can be used with binary options. Distinctive features No re-drawing; Simple and clear settings; Four types of alerts; Works on all timeframes and all trading tools; Suitable
Noize Absorption Index MT4
Ekaterina Saltykova
5 (1)
Noize Absorption Index - is the manual trading system that measures the difference of pressure between bears forces and bulls forces. Green line - is a noize free index that showing curent situation. Zero value of index shows totally choppy/flat market.Values above zero level shows how powerfull bullish wave is and values below zero measures bearish forces.Up arrow appears on bearish market when it's ready to reverse, dn arrow appears on weak bullish market, as a result of reverse expectation. S
SMC Venom 模型 BPR 指標是針對在智慧貨幣 (SMC) 概念內工作的交易者的專業工具。它會自動辨識價格圖表上的兩種關鍵模式: FVG (公平價值缺口)是三根蠟燭的組合,其中第一根和第三根蠟燭之間存在缺口。它在水平之間形成一個沒有成交量支撐的區域,這通常會導致價格調整。 BPR (平衡價格區間)是兩種 FVG 模式的組合,形成一個「橋樑」 - 當價格以低成交量活動移動時,突破並返回到水平的區域,從而在蠟燭之間產生間隙。 這些模式可協助交易者透過分析圖表上的交易量和價格動態(大型市場參與者和普通參與者之間的互動)來識別關鍵的支撐/阻力位、突破區域和切入點。 此指標以矩形和箭頭的形式可視化模式,也支援靈活的警報設定。 主要特點: 模式顯示模式:選擇顯示 BPR 模式(看漲和看跌)或 FVG 模式(看漲和看跌)。 可以隱藏所有圖表分析模式。 以條數過濾:BPR 結構中 FVG 之間的最小/最大距離。 訊號的附加視覺化: 箭頭有 9 種類型可供選擇(標準、細、分形等)或手動輸入 Wingdings 代碼,其表格可以選擇性地顯示在圖表上。 使用 ATR 配置顏色、尺寸及其相對於價格
Crypto_Forex 指标“主要趋势修正直方图”适用于 MT4,无需重绘。 - 主要趋势修正直方图指标旨在检测大趋势。 - 指标可以采用 2 种颜色:红色表示看跌趋势,蓝色表示看涨趋势(可以更改颜色)。 - 至少 10 个连续的相同颜色的直方图列表示新趋势的开始。 - 指标具有内置的移动和 PC 警报。 - 参数“周期”负责指标的灵敏度。 如何使用指标: 1) 检查至少 10 个连续的相同颜色的直方图列,这意味着新趋势的开始(蓝色 - 表示看涨,红色 - 表示看跌)。 2) 然后,如果出现 1 或 2 个相反颜色的列,然后将其变回主要趋势的颜色 - 那就是趋势修正。 3) 修正后,可以考虑:在主要上涨趋势的情况下开立买入交易,在主要下跌趋势的情况下开立卖出交易。 // 出色的交易机器人和指标可在此处获得: https://www.mql5.com/en/users/def1380/seller 这是仅在此 MQL5 网站上提供的原创产品。
The indicator displays the data of the Stochastic oscillator from a higher timeframe on the chart. The main and signal lines are displayed in a separate window. The stepped response is not smoothed. The indicator is useful for practicing "manual" forex trading strategies, which use the data from several screens with different timeframes of a single symbol. The indicator uses the settings that are identical to the standard ones, and a drop-down list for selecting the timeframe. Indicator Paramet
The Th3Eng PipFinite indicator is based on a very excellent analysis of the right trend direction with perfect custom algorithms. It show the true direction and the best point to start trading. With StopLoss point and Three Take Profit points. Also it show the right pivot of the price and small points to order to replace the dynamic support and resistance channel, Which surrounds the price. And Finally it draws a very helpful Box on the left side on the chart includes (take profits and Stop loss
Stratos Pali
Michela Russo
5 (3)
Stratos Pali Indicator   is a revolutionary tool designed to enhance your trading strategy by accurately identifying market trends. This sophisticated indicator uses a unique algorithm to generate a complete histogram, which records when the trend is Long or Short. When a trend reversal occurs, an arrow appears, indicating the new direction of the trend. Important Information Revealed Leave a review and contact me via mql5 message to receive My Top 5 set files for Stratos Pali at no cost! Dow
This indicator allows to analyze a chart using the rule of supple and demand. You will see zones of sales and purchases and determine the most profitable points to open positions. The indicator is based on the principle of market fractality. Chart zones show places where a strong buyer or seller has made the price reverse and change its direction. The indicator has several types of zones calculation. Color and type of zones displaying are set as desired. The zone width can be displayed in pips.
HMA Trend Professional MT4
Pavel Zamoshnikov
4.57 (7)
Improved version of the free HMA Trend indicator (for MetaTrader 4) with statistical analysis. HMA Trend is a trend indicator based on the Hull Moving Average (HMA) with two periods. HMA with a slow period identifies the trend, while HMA with a fast period determines the short-term movements and signals in the trend direction. The main differences from the free version: Ability to predict the probability of a trend reversal using analysis of history data. Plotting statistical charts for analyzi
EZZ Elite Zig Zag is an indicator for the MetaTrader 4 terminal. This indicator traces the peak of the trend based on the market reversal, thus showing various opportunities in the financial market. EZZ Elite Zig Zag is a visual tool, intuitive, and easy to understand and use.  Test it Yourself by Downloading it for Free. Author Paulo Rocha all rights reserved
Point61 Indicator
Evgeniy Machok
5 (1)
The Point61 indicator is the result of many years of monitoring of price behavior of currency pairs and metals. It is not a secret, that in times of uncertainty, traders are looking for possible levels of support and resistance - the point, where price should stop its movement. There are 2 possible scenarios at these points: 1. Reverse (correction) to the opposite direction; 2. Breakthrough to continue movement. Very often these points are used to set stop orders - TakeProfit or StopLoss
Trendiness Index
Libertas LLC
5 (3)
"The trend is your friend" is one of the best known sayings in investing, because capturing large trendy price movements can be extremely profitable. However, trading with the trend is often easier said than done, because many indicators are based on price reversals not trends. These aren't very effective at identifying trendy periods, or predicting whether trends will continue. We developed the Trendiness Index to help address this problem by indicating the strength and direction of price trend
SimSim Arrow Momentum 是一個標準的「動量」指標,但採用箭頭版本。 MetaTrader 5 版本 指標參數與標準參數類似,另外也增加了一個參數 Delta。 Delta = 0 - 100 相對於 100 值的偏差。改變 100 指標的水平,可以加法或減量。 當價格穿過水平線 = 100 +- Delta 時,指標會產生訊號。 啟用「控制交易」進行操作,將自動開啟基於指標訊號的交易。 您可以將指標用作其預期用途,作為可靠的訊號設備。 然而,它的次要目的是作為“ CONTROL DEAL ”實用程式的信號提供者。 指標與該實用程式之間的共生關係不僅使您能夠看到訊號,而且還能根據它進行交易。 如果您想有效地使用這些訊號,請下載免費實用程式: SimSim Control Deal 。 「SimSim ARROW」系列指標的訊號以其明顯性和清晰度吸引了交易者,這使得它們比顧問更具吸引力。當箭頭出現時,指標的視覺清晰度就會顯現出來這是開啟交易的時刻!相反,當使用顧問時,事件通常以隱藏的方式展開,交易者並不總是清楚為什麼啟動特定操作,因為許多內容仍然隱藏在演算
The Funicular
Daniil Kurmyshev
The Funicular is a functional indicator knowing all the rules of the market and performing constructions more accurate and faster than any professional analyst.  The Funicular helps you see the exact points of the "entrance", and it draws trends with great accuracy determinig their strength and fluctuation time. The main difference from the others is that it builds lines that are independent of timeframe allowing you to perceive the chart as a whole. Simply put, you need The Funicular, because i
RTrends
Nikolay Likhovid
The RTrends indicator does two things: first, it automatically draws the layout of the price chart by plotting trend lines and, secondly, it produces bearish and bullish signals. The layout reflects the fractal nature of the market. Trends from different time horizons are applied simultaneously on the chart. Thus, from a single chart a trader can see trend lines of higher timeframes. The lines, depending on the horizon, differ in color and width: the older the horizon, the thicker the line is. T
Cosmic Diviner X Planet
Olena Kondratenko
4 (2)
This unique multi-currency strategy simultaneously determines the strength of trends and market entry points, visualizing this using histograms on the chart. The indicator is optimally adapted for trading on the timeframes М5, М15, М30, Н1. For the convenience of users, the indicator renders the entry point (in the form of an arrow), recommended take profit levels (TP1, TP2 with text labels) and the recommended Stop Loss level. The take profit levels (TP1, TP2) are automatically calculated for
Crypto_Forex 指标“晨星模式”适用于 MT4。 - 指标“晨星模式”是价格行为交易的非常强大的指标:无需重绘,无延迟。 - 指标检测图表上的看涨晨星模式:图表上的蓝色箭头信号(见图片)。 - 带有 PC、手机和电子邮件警报。 - 还有它的兄弟 - 看跌“黄昏之星模式”指标可用(点击以下链接)。 - 指标“晨星模式”非常适合与支撑/阻力位结合使用。 ................................................................................................................. // 出色的交易机器人和指标可在此处获得: https://www.mql5.com/en/users/def1380/seller 这是仅在此 MQL5 网站上提供的原创产品。
该产品的买家也购买
Gann Made Easy
Oleg Rodin
4.81 (132)
Gann Made Easy 是一个专业且易于使用的外汇交易系统,它基于使用先生理论的最佳交易原则。 W.D.江恩。该指标提供准确的买入和卖出信号,包括止损和获利水平。您甚至可以使用推送通知在旅途中进行交易。 购买后请联系我!我将免费与您分享我的交易技巧和丰厚的红利指标! 您可能已经多次听说过江恩交易方法。通常 Gann 的理论不仅对于新手交易者而且对于那些已经有一定交易经验的人来说都是非常复杂的东西。这是因为江恩的交易方法在理论上并不那么容易应用。我花了几年时间来完善这些知识,并将最好的原则应用到我的外汇指标中。 该指标非常易于应用。您所需要的只是将其附加到您的图表并遵循简单的交易建议。该指标不断进行市场分析工作并寻找交易机会。当它检测到一个好的入口点时,它会为您提供一个箭头信号。该指标还显示止损和获利水平。 换句话说,当您像先生一样进行交易时,该指标会为您提供最佳江恩建议。江恩亲自告诉你此时此刻该做什么。但最好的部分是您不需要了解任何有关江恩交易原则的知识,因为该指标会为您完成整个市场分析工作。
M1 Sniper
Oleg Rodin
5 (5)
M1 SNIPER 是一款易于使用的交易指标系统。它是一个专为 M1 时间框架设计的箭头指标。该指标可以作为独立的系统在 M1 时间框架下进行剥头皮交易,也可以作为您现有交易系统的一部分使用。虽然该交易系统专为 M1 时间框架交易而设计,但它也可以用于其他时间框架。我最初设计此方法是为了交易 XAUUSD 和 BTCUSD。但我发现这种方法在其他市场交易中也同样有用。 指标信号既可以顺势交易,也可以逆势交易。我教授一种特殊的交易技巧,帮助您利用指标信号进行双向交易。该方法基于使用特殊的动态支撑位和阻力位区域。 购买后,您可以立即下载 M1 SNIPER 箭头指标。此外,我还为所有 M1 SNIPER 工具用户免费提供下方屏幕截图所示的 Apollo Dynamic SR 指标!这两个指标的组合可以帮助您更轻松、更准确地利用 M1 时间框架进行交易。 购买后请联系我,免费获取交易提示和奖励指标! 祝您交易成功!
Cycle Maestro
Stefano Frisetti
注意:CYCLEMAESTRO 僅在本網站分發,沒有其他分發者。 演示版本僅供參考,不支援。完整版功能完善,並支援 CYCLEMAESTRO 是第一個也是唯一一個週期分析指標,可用於發出交易、買入、賣出、停損、增加的訊號。 根據 Serghei Istrati 的邏輯創建並由 Stefano Frisetti 編程; CYCLEMAESTRO 與其他指標不同,其挑戰在於僅解釋週期性起作用的事物,並創建具有明確交易信號的不可解釋的指標,這與市場上發現的各種指標不同,在這些指標中,一切都留給用戶解釋,而用戶的解釋不可避免地會隨時間而變化。 憑藉 10 年的經驗,Serghei Istrati 創建了一種邏輯,透過無限次回溯測試,以實用的方式解釋週期性分析,從而消除未經證實的理論,只保留真正有效的理論。 + 適用於 MT4 和 MT5 + 清晰的買進或賣出訊號 + 無法解釋 + 不重新繪製 + 適用於所有列出的資產 + 也清楚地指示了停損和獲利 使用 CYCLEMAESTRO 進行交易訊號簡單而直接:一旦某個區域的背景變成綠色或紅色,就表示交易訊號處於活動狀態:綠色 = 買入
Scalper Inside PRO
Alexey Minkov
4.74 (66)
An exclusive indicator that utilizes an innovative algorithm to swiftly and accurately determine the market trend. The indicator automatically calculates opening, closing, and profit levels, providing detailed trading statistics. With these features, you can choose the most appropriate trading instrument for the current market conditions. Additionally, you can easily integrate your own arrow indicators into Scalper Inside Pro to quickly evaluate their statistics and profitability. Scalper Inside
Dynamic Forex28 Navigator
Bernhard Schweigert
5 (5)
Dynamic Forex28 Navigator - 下一代外汇交易工具。 当前 49% 折扣。 Dynamic Forex28 Navigator 是我们长期流行的指标的演变,将三种功能合二为一: 高级货币强度 28 指标 (695 条评论)+ 高级货币 IMPULSE 带警报 (520 条评论)+ CS28 组合信号(奖励)。 有关指标的详细信息 https://www.mql5.com/en/blogs/post/758844 下一代强度指标提供什么? 您喜欢的原始指标的一切,现在通过新功能和更高的精度进行了增强。 主要特点: 专有货币强度公式。  所有时间范围内的平滑和准确的强度线。 非常适合识别趋势和精确进入。 动态市场斐波那契水平(市场斐波那契)。  此指标独有的独特功能。 斐波那契应用于货币强度,而不是价格图表。 适应实时市场活动以获得准确的反转区域。 实时市场动量。  第 9 行显示市场是活跃还是被动。 对于定时交易至关重要。 全面的警报和显示。  每种货币最强的买入和卖出动量。 ​​28 对的双重动量买入和卖出。 超买/超卖警告外部范围和止损。 反转
Algo Pumping MT4
Ihor Otkydach
4.92 (12)
PUMPING STATION – 您的专属“全包式”交易策略 我们为您推出PUMPING STATION —— 一款革命性的外汇指标,它将使您的交易变得更加有趣且高效。这不仅仅是一个辅助工具,而是一套完整的交易系统,具备强大的算法,帮助您开始更加稳定的交易。 购买本产品,您将免费获得: 专属设置文件:用于自动配置,实现最大化性能。 逐步视频教程:学习如何使用PUMPING STATION策略进行交易。 Pumping Utility:专为PUMPING STATION打造的半自动交易机器人,让交易变得更加方便和简单。 购买后请立即联系我,我将为您提供所有额外资源的访问权限。 PUMPING STATION如何工作: 趋势监控:能够即时识别市场趋势方向。趋势是您最好的朋友。 进场信号:图表上的箭头会提示您何时进场以及交易方向。 明确的交易目标:指标会自动识别最佳的平仓时机。 回调交易:内置的基于布林带的价格通道可检测修正结束并发出新趋势开始的信号。 效率分析:如果当前设置效果较差,系统会自动提示。只需调整PUMPING STATION,即可获得最佳性能。 功能强大: 推送和邮件通知:即
ON Trade Optuma Astro
Abdullah Alrai
5 (5)
当然可以!以下是您提供的文本的中文翻译: 引入 MT4 天文指标:您的终极天体交易伙伴 您准备好将交易体验提升到天文高度了吗?不用再寻找,就在我们的革命性 MT4 天文指标中。这个创新工具超越了传统的交易指标,利用复杂的算法提供无与伦比的天文洞察力和精确计算。 指尖上的宇宙信息: 瞻仰一个详尽的面板,展示了一宝藏般的天文数据。了解行星的地理/太阳心坐标,太阳/地球距离,亮度,伸长度,星座,黄道和赤道坐标,甚至是水平坐标——每个细节都经过精心计算并呈现得美轮美奂。指标生成的垂直线对应于时间值,为您的交易旅程提供了宇宙的视角。 行星线条与关系: 在您的图表上欣赏行星线条的魔力,具有可自定义的比例和角度。通过直观的控制面板轻松切换每个行星线条的可见性。通过连结、六分、四分、三分、对冲和逆行等指标,发现行星关系的艺术。在您选择的时间范围内探索这些宇宙构造,使您能够识别重要的交易机会。 揭示甘恩的智慧: 通过受甘恩启发的平方垂直线揭示潜在的反转时机。这种创新修改将甘恩历经考验的原则带入现实,帮助您提前了解市场的转向和趋势。 月亮引导: 在您的图表上优雅地导航月相,因为新月和满月点缀其间。月亮周期
PRO Renko System
Oleg Rodin
5 (27)
PRO Renko Arrow Based System for trading renko charts.  准确的信号交易任何外汇工具. 另外,我将免费提供系统的附加模块! PRO Renko系统是RENKO图表上高度准确的交易系统。该系统是通用的。 该交易系统可应用于各种交易工具。 该系统有效地中和了所谓的市场噪音,打开了获得准确反转信号的通道。 该指标易于使用,只有一个参数负责产生信号。 您可以很容易地使算法适应您感兴趣的交易工具和renko酒吧的大小。 我很乐意通过提供任何咨询支持来帮助所有客户有效地使用该指标。 祝您交易成功!购买后,立即写信给我! 我将与您分享我的建议和我的renko发电机。 另外,我将免费提供系统的附加模块!
Trend Screener
STE S.S.COMPANY
4.79 (94)
趋势指标,趋势交易和过滤的突破性独特解决方案,所有重要趋势功能都内置在一个工具中! 它是 100% 非重绘多时间框架和多货币指标,可用于所有符号/工具:外汇、商品、加密货币、指数、股票。 限时优惠:支撑和阻力筛选指标仅售 50美元,终身有效。(原价 250 美元)(优惠延长) 趋势筛选器是有效的指标趋势跟踪指标,它在图表中提供带有点的箭头趋势信号。 趋势分析器指标中可用的功能: 1.趋势扫描仪。 2. 具有最大利润分析的趋势线。 3.趋势货币强度计。 4. 带有警报的趋势反转点。 5. 带有警报的强趋势点。 6. 趋势箭头 每日分析示例,每日信号表现...等与我们的趋势筛选指标,可以在这里找到: 点击这里 限时优惠:Trend Screener Indicator 仅售 50 美元且终身可用。原价 125$) 通过访问我们的 MQL5 博客,您可以找到我们所有的高级指标以及分析示例、每日信号表现...等。 : 点击这里 我们的趋势系统由 2 个指标组成: 1. Trend Screener Indicator:显示趋势仪表盘、图表中的趋势线、入场点...等。 2. Trend
Gold Stuff
Vasiliy Strukov
4.85 (262)
Gold Stuff 是专为黄金设计的趋势指标,也可用于任何金融工具。 该指标不会重绘,也不会滞后。 推荐时间框架 H1。 在它指标工作全自动专家顾问 EA Gold Stuff。 你可以在我的个人资料中找到它。 重要! 购买后立即与我联系,以获得说明和奖金!   您可以免费收到我们的强力支持和趋势扫描指标的副本,请私信。大部头书! 购买后立即联系我以获得设置和个人奖励!   设置 绘制箭头 - 打开关闭。 在图表上绘制箭头。 警报 - 打开关闭声音警报。 电子邮件通知 - 打开关闭。 电子邮件通知。 Puch-notification - 打开关闭。 推送通知。 接下来,调整色域。 Gold Stuff 是专为黄金设计的趋势指标,也可用于任何金融工具。 该指标不会重绘,也不会滞后。 推荐时间框架 H1。 在它指标工作全自动专家顾问 EA Gold Stuff。 你可以在我的个人资料中找到它。 购买后立即联系我以获得设置和个人奖励!   设置 绘制箭头 - 打开关闭。 在图表上绘制箭头。 警报 - 打开关闭声音警报。 电子邮件通知 - 打开关闭。 电子邮件通知。 Puch
Hydra Trend Rider
INTRAQUOTES
5 (3)
Hydra Trend Rider is a non-repainting, multi-timeframe trend indicator that delivers precise buy/sell signals and real-time alerts for high-probability trade setups. With its color-coded trend line, customizable dashboard, and mobile notifications, it's perfect for traders seeking clarity, confidence, and consistency in trend trading. Download the Metatrader 5 Version Message us here after purchase to get the Indicator Manual. HURRY!   FLASH SALE is  ON . Price  increasing soon! Read the product
The TPX Dash Needle is everything you need to find the famous Didi Needles on several timeframes and in several pairs at the same time. These are the simultaneous meeting of the 3, 8 and 20 averages that, aligned with the ADX indicator, are synonymous with large and strong movements in the market. With no monthly fees, you get a tool for a fair price that, placed on a VPS, sends the message to your cell phone right away, giving you more free time and not having to be glued to the screen all day
FX Volume
Daniel Stein
4.6 (35)
FX Volume:从经纪商视角洞察真实市场情绪 简要概述 想要提升您的交易策略? FX Volume 可提供零售交易者和经纪商的持仓实时数据——远早于诸如 COT 之类的延迟报告。不论您希望获得持续稳定的收益,还是想在市场中多一分制胜的砝码, FX Volume 都能帮您识别重大失衡、确认突破以及完善风险管理。立即开启体验,让真实的成交量数据为您的交易决策带来革新! 1. 为什么 FX Volume 对交易者格外有用 极具准确度的早期预警 • 快速捕捉有多少交易者正在买入或卖出某个货币对——比大多数人提前一步。 • FX Volume 是 唯一 能够整合多家零售经纪商真实成交量数据并以简洁方式呈现的工具。 强力风险管理 • 及时识别多头或空头仓位的巨大不平衡,这往往预示着潜在的趋势反转,帮助您更自信地设置止损和目标位。 • 独家而真实的数据让每一次交易决策更具可靠性。 优化进场与出场点 • 发现“过度集中”的交易(大多数交易者都在同一方向),并通过真实成交量来确认突破。 • 避免依赖常见指标可能带来的误导信号,而是利用真实的实时成交量。 适配各种交易策略 • 将 FX
Dark Absolute Trend
Marco Solito
4.58 (40)
Dark Absolute Trend   is an Indicator for intraday trading. This Indicator is based on Trend Following  strategy but use also candlestick patterns and Volatility. We can enter in good price with this Indicator, in order to follow the main trend on the current instrument. It is advised to use low spread ECN brokers. This Indicator does Not repaint and N ot lag . Recommended timeframes are M5, M15 and H1. Recommended working pairs: All. I nstallation and  Update Guide   -  Troubleshooting guide  
PZ Trend Trading
PZ TRADING SLU
4.8 (5)
许多盈利交易者不仅知道如何识别市场趋势,而且也能把握趋势建立后的交易机会。 Pz 趋势交易 指标设计用来在趋势行情中尽可能的赚取利润。 已建立的趋势提供了一揽子交易机会,但大多数趋势交易指标完全忽视了它们,让交易者在趋势行情时完全不知道该如何做!一般趋势指标只通知有关的趋势变化,但根本不足以得到卓越的回报. Pz 趋势交易 指标比一般趋势指标显示多达 20 倍的交易 , 因为它注重所谓的市场时机。它不仅显示当前的市场趋势,也有回调,内柱线的突破和调整。它令您在趋势回调之后介入,安全的柱线内突破金字塔加仓,以及发现潜在的反转,和已知的调整。 趋势改变 一个趋势改变在市场方向变化时发生。趋势变化在图表上用带数字的彩色圆圈显示。蓝色 (1) 信号为上涨开始, 而红色 (1) 信号为下跌开始。趋势变化并非评估当前价格动作的结果, 它意味着交易设置是不定时地。如果您正确使用本指标, 在趋势变化时, 您将将已经入场 (参看下面的调整)。 回调 但凡趋势在运动中,行情上下抖动,盈利者收割利润,且其它参与者入场。趋势回调代表好的买入机会,通常是由主力获利离场导致。如果行情在回调后回归上行, 指标将
Quantum Profile System
Stanislav Konin
4 (2)
Quantum Profile System  —   is a comprehensive professional trading system with advanced algorithms. It combines trend direction analysis, volume concentration at key levels, dynamic adaptation to market volatility, and signal generation without delays or repainting. Quantum Profile System integrates the functionality of a volume profile based on linear regression with an adaptive trend channel using ATR. It features volume profiles with construction and display in two directions. Multi-level v
True Direction Oscillator
Muhammad Elbermawi
4.86 (361)
或 (TDO),它是一种使用“ 纯动量 ”原理衡量价格变化率的指数。 当证券价格从 10 上涨到 15 时,价格变化率为 150%,但当它从 15 回落到 10 时,价格变化率仅为 33.3%。这就是为什么像“价格变化率”(ROC) 或“动量”这样的技术分析指标给出的上升价格走势读数高于下降价格走势读数的原因。 TDO 解决了这个问题,以帮助交易者正确读取动量。 重要信息 TDO 用户手册: https://www.mql5.com/en/blogs/post/717970 TDO 常见问题: https://www.mql5.com/en/blogs/post/722015 TDO 视频库: https://www.mql5.com/en/blogs/post/722018 TDO Expert Advisor 示例: https://www.mql5.com/en/blogs/post/731141 TDO 特性 TDO 以百分比计算纯动量,因此它用于比较来自不同市场的不同证券。 (例如:将 EURUSD 与 Gold & Dow Jones Industrial 进行比较)
Grabber System
Ihor Otkydach
5 (1)
向您介绍一款优秀的技术指标——Grabber,它是一套即开即用的“全包式”交易策略。 在一个代码中集成了强大的市场技术分析工具、交易信号(箭头)、提醒功能和推送通知。 每位购买该指标的用户还可免费获得以下内容: Grabber辅助工具:用于自动管理已开仓位 视频操作指南:逐步教学如何安装、设置和使用该指标进行交易 原创Set文件:可快速自动配置,帮助实现最佳交易效果 忘掉其他策略吧!只有Grabber能够真正激励你在交易中攀登新高峰! Grabber策略的主要特点: 交易周期:从M5到H4 适用资产:任意,但我推荐我亲自测试过的品种(GBPUSD、GBPCAD、GBPCHF、AUDCAD、AUDUSD、AUDSGD、AUDCHF、NZDUSD、NZDCAD、EURCAD、EURUSD、EURAUD、EURGBP、EURCHF、USDCAD、USDSGD) 交易时间:全天候 24/7 交易类型:波段交易(反转系统)
Currency Strength Exotics
Bernhard Schweigert
4.88 (32)
目前8折优惠! 对任何新手或专家交易者来说都是最好的解决方案! 这个指标是专门用来显示任何符号的货币强度,如异国货币对、商品、指数或期货。它是同类产品中的第一个,任何符号都可以添加到第9行,以显示黄金、白银、石油、DAX、US30、MXN、TRY、CNH等的真实货币强度。这是一个独特的、高质量的、负担得起的交易工具,因为我们已经纳入了一些专有的功能和一个新的公式。想象一下,你的交易将如何改善,因为你能够准确地确定新趋势或剥头皮机会的触发点? 用户手册:点击这里   https://www.mql5.com/en/blogs/post/708876 它适用于所有时间框架。你将很快能够看到TREND! 根据新的基础算法设计,它使识别和确认潜在交易变得更加容易。这是因为它以图形方式显示了8种主要货币和一种符号的强弱。 该指标显示了8种主要货币(澳元加元瑞士法郎欧元英镑日元新西兰美元)的强弱线,再加上一个符号! 该指标显示了符号的真实价值。例如:对于XAUUSD(黄金):价格以美元报价。如果黄金在上涨,你怎么能知道是黄金的强势还是美元的弱势?只有当黄金走强时,我们才会进行交易。该指
Advanced Currency IMPULSE with ALERT
Bernhard Schweigert
4.91 (485)
目前31%的折扣!! 对任何新手或专家交易者来说都是最好的解决方案! 这个指标是一个独特的、高质量的、负担得起的交易工具,因为我们已经纳入了一些专有的功能和一个秘密的公式。只需一张图表,它就能给出所有28种货币对的警报。想象一下,你的交易将如何改善,因为你能够准确地确定新趋势或剥头皮机会的触发点 建立在新的基础算法上,它使识别和确认潜在交易变得更加容易。这是因为它以图形方式显示了一种货币的强势或弱势是否正在加速,并测量了这种加速的速度--把它想象成你汽车中的速度表。当你加速时,事情显然会发生得更快,这在外汇市场上也是一样的,即如果你配对的货币正在向相反的方向加速,你就会发现一个潜在的有利可图的交易。 货币动量的垂直线和箭头将指导你的交易! 动态的市场斐波那契23水平被用作警报触发器,将适应市场活动。如果冲动触及黄色触发线,您将在MetaTrader或您的电子邮件或推送警报中收到警报。然后你就知道作为一个交易员应该做什么。货币对和方向已经给出。只要点击警报按钮,就可以切换到该货币对或打开一个新的图表,以便进一步分析。警报级别可以通过用户输入来改变,可以选择3个敏感度级别。 尽
TPSproTREND PrO
Roman Podpora
4.68 (25)
VERSION MT5        —        ИНСТРУКЦИЯ RUS           —        INSTRUCTIONS  ENG 主要功能: 准确的输入信号,无需渲染! 如果出现信号,它仍然相关!这是与重提指标的一个重要区别,重提指标可以提供信号然后改变信号,这可能导致存款资金的损失。现在您可以以更高的概率和准确度进入市场。还有一个功能是在箭头出现后为蜡烛着色,直到达到目标(止盈)或出现反转信号。 显示止损/获利区域 为了提高搜索切入点时的视觉清晰度,创建了一个模块,该模块最初显示买入/卖出区域,在该区域中搜索进入市场的最佳点。用于处理止损水平的附加智能逻辑有助于随着时间的推移减小其大小,从而降低进入交易(移动 sl)时的初始风险。 显示较高时间范围内的最小值/最大值(MTF 模式) 添加了一项功能,可以显示较高时间间隔的最小/最大校正位置,并显示趋势变化。此外,MIN/MAX 现在有编号,显示修正内容。 风险回报率 (RR) 使用指标算法,可以检测精确的入场点,平均风险回报比超过1k2。这也伴随着视觉效果,例如,收到信号后会出现蜡烛的彩色草图。 无论价
Volatility Trend System - a trading system that gives signals for entries. The volatility system gives linear and point signals in the direction of the trend, as well as signals to exit it, without redrawing and delays. The trend indicator monitors the direction of the medium-term trend, shows the direction and its change. The signal indicator is based on changes in volatility and shows market entries. The indicator is equipped with several types of alerts. Can be applied to various trading ins
TPSpro RFI Levels
Roman Podpora
4.85 (27)
反转区域 / 峰值交易量 / 主要参与者的活跃区域 =       TS TPSPRO系统 俄语使用说明     /       指示     英语     /       Version MT5 该指标的每位购买者还可免费获得: 6 个月内可访问 RFI SIGNALS 服务的交易信号 - 根据 TPSproSYSTEM 算法准备的切入点。 定期更新的培训材料 - 让您沉浸在策略中并提高您的专业水平。 工作日每天 24 小时提供支持,并可以访问封闭的交易者聊天室 - 沟通、协助和市场情况分析。 作者设定的文件——自动指标设置,无需额外努力即可实现最大效果。 主要功能: 显示卖家和买家的活跃区域! 指标显示所有正确的买入和卖出第一脉冲水平/区域。当这些水平/区域被激活时,即开始寻找切入点的地方,水平会改变颜色并填充特定颜色。还会出现箭头,以便更直观地了解情况。 LOGIC AI - 激活模板时显示用于搜索入口点的区域(圆圈) 为了提高视觉清晰度,添加了使用人工智能搜索入口点的显示区域的功能。 显示更高时间范围内的级别/区域(MTF 模式) 添加了使用更高时间间隔显示级别/区域的功能
Bermaui Deviation Percent
Muhammad Elbermawi
4.94 (111)
或者 ( BD% ) 这是一个波动率指数,以百分比而不是点来衡量波动率。 BD% 的想法是根据在 0% 和 100% 之间移动的经典标准偏差 (CSD) 创建一个索引。 您可以使用 BD% 来比较同一证券在不同时间段或不同时间范围内的波动率。此外,您可以使用 BD% 以百分比而非点数来比较不同市场中不同证券之间的波动率。 如何使用“BD%” 如果 BD% 低于 90%,然后向上越过该水平,则表明价格可能在区间内波动。 如果 BD% 高于 90%,然后向下穿过该水平,并且价格已经高于其简单移动平均线,则这是新的上升趋势开始的迹象。随着 BD% 进一步下行,波动性和趋势强度正在增加。当 BD% 为 0% 时,这意味着波动率处于最高值。 如果 BD% 高于 90%,然后向下穿过该水平,并且价格已经低于其简单移动平均线,则这是新的下降趋势开始的迹象。随着 BD% 进一步下行,波动性和趋势强度正在增加。当 BD% 为 0% 时,这意味着波动率处于最高值。 要了解有关 BD% 的更多信息,请从此处阅读用户手册: https://www.mql5.com/en/blogs/post/718
Cycle Sniper
Elmira Memish
4.39 (36)
NEW YEAR SALE PRICE FOR LIMITED TIME!!! Please contact us after your purchase and we will send you the complimentary indicators to complete the system Cycle Sniper is not a holy grail but when you use it in a system which is explained in the videos, you will feel the difference. If you are not willing to focus on the charts designed with Cycle Sniper and other free tools we provide, we recommend not buying this indicator. We recommend watching the videos about the indiactor and system before pu
Basic Harmonic Patterns Dashboard
Mehran Sepah Mansoor
5 (3)
该仪表盘显示所选符号的最新可用谐波形态,因此您可以节省时间并提高效率 /  MT5 版本 。 免费指标:  Basic Harmonic Pattern 指标列 Symbol: 显示所选符号 Trend:   看涨或看跌 Pattern:  形态类型(Gartley、蝴蝶、蝙蝠、螃蟹、鲨鱼、Cypher 或 ABCD) Entry:   入口价格 SL: 止损价 TP1: 第一止盈价 TP2: 第二次获利价格 TP3: 第三次获利价格 Current price:  当前价格 Age (in bars): 最后绘制的模式的年龄 主要输入 Symbols : 从 "28 种主要货币对 "或 "选定符号 "中选择。 Selected Symbols : 希望监控的符号,用逗号分隔("EURUSD,GBPUSD,XAUUSD")。如果您的经纪商为货币对设置了后缀或前缀,您必须在以下两个参数中添加(货币对前缀或货币对后缀)。 Max Iteration: 调整模式的最大迭代次数(如果该值越小,则模式越少,性能越快;如果该值越大,则模式越多,性能越慢)。事实上,它的工作原理如下:如果该值
FX Levels MT4
Daniel Stein
5 (2)
FX Levels:适用于所有市场的高精度支撑与阻力 快速概览 想要精准确定适用于任何市场(外汇、指数、股票或大宗商品)的支撑与阻力吗? FX Levels 将传统的“Lighthouse”方法与前沿的动态分析相结合,实现近乎通用的准确性。依托真实经纪商经验和自动化的每日与实时更新, FX Levels 帮助您捕捉价格反转点、设置合理的盈利目标,并自信地管理交易。立即使用,体验更准确的支撑/阻力分析如何助力您的交易更上层楼! 1. 为什么 FX Levels 对交易者非常有利 极度精准的支撑 & 阻力区 • FX Levels 专为不同经纪商提供的行情源和时间设置而设计,可生成几乎相同的价位区,解决数据不一致的常见问题。 • 这意味着无论您在哪里交易,都能获得稳定一致的水平线,为策略打下更加牢固的基础。 结合传统与先进技术 • 通过将久经考验的“Lighthouse”方法与动态分析相融合, FX Levels 不仅限于每日刷新,还可针对新的价格波动进行即时更新。 • 您可以选择经典的静态方式,或实时捕捉新出现的水平,以贴近最新的市场行为。 识别清晰的反转点 • FX Lev
Advanced Supply Demand
Bernhard Schweigert
4.91 (295)
现在优惠 33%! 任何新手或专业交易者的最佳解决方案! 该指标是一款独特、高质量、且价格合理的交易工具,因为我们已经整合了许多专有功能和新公式。 依据此更新,您将能够显示双重时间帧区域。 您不仅可以显示一个较高的时间帧,还可以同时显示图表时间帧,加上更高的时间帧:显示嵌套时区。 供需双方所有交易者都会喜欢它。 :) 重要信息披露 高级供需的最大潜力,请访问 https://www.mql5.com/zh/blogs/post/720245   想象您的交易如何得以改善,是因为您能够精准定位入场或目标位吗? 构建于新的底层算法,它可以更轻松地识别出买卖双方之间的潜在失衡。 这是因为它以图形方式展示供需最强劲区域,及其过去的表现(显示旧区域)。 这些功能旨在帮助您更轻松地发现最佳入场区域和价位。 现在您可以针对您的交易品种和时间帧来优化和编辑区域强度! 高级供需指标适用于所有产品和时间帧。 它是一个新的公式,非常新的功能是两个区域强度函数可由用户输入进行调整! 这在交易中是一大优势。 当您学习如何使用专有功能,例如带有价格游离最小 X 因子的区域强度时,您能够判断该区域强劲与否。 供需
Gold Pointer
Sergei Linskii
Gold Pointer   是最好的趋势指标。该指标的独特算法分析资产价格走势,考虑技术和数学分析因素,确定最有利可图的入市点,并发出买入或卖出指令信号。 最佳指标信号: - 卖出 = 红色趋势线 + 红色 TF 指标 + 同方向黄色信号箭头。 - 买入 = 蓝色趋势线 + 蓝色 TF 指标 + 同方向水蓝色信号箭头。 该指标的优点 1. 该指标发出的信号准确度高。 2. 该指标的确认信号不会消失,也不会重新绘制--在确认信号(箭头)后会发出声音警报(警报与信息)。 3. 您可以在任何经纪商的 MetaTrader 4 交易平台上进行交易。 4. 您可以交易任何资产(货币、金属、加密货币、股票、指数等)。 5. 您可以在任何时间框架内进行交易(M5-M15 缩放交易/M30-N1 中期交易/H4-D1 长期交易)。 6. 可在指标设置中更改个别参数(颜色、大小等),以便每位交易者都能轻松调整指标,满足自己的需求。 7. 该指标既可作为交易系统的基本补充,也可作为独立的交易系统使用。 8. 在图表上,无论指标设置在哪个时间框架上,它都会显示六个时间框架(M5 M15 M30
FX Power MT4 NG
Daniel Stein
4.94 (18)
FX Power:分析货币强度,助您做出更明智的交易决策 概述 FX Power 是一款专业工具,帮助您全面了解主要货币和黄金在任何市场条件下的真实强度。通过识别强势货币用于买入,弱势货币用于卖出, FX Power 简化了交易决策,并帮助您发现高概率的交易机会。不论您是想跟随趋势还是通过极端的 Delta 值预测反转,这款工具都能完美适应您的交易风格。别再盲目交易——用 FX Power 让您的交易更加智慧。 1. 为什么 FX Power 对交易者极具价值 实时货币和黄金强度分析 • FX Power 实时计算并显示主要货币和黄金的相对强度,助您全面了解市场动态。 • 监控领先或落后资产,轻松识别值得交易的货币对。 全面的多时间框架视图 • 跟踪短期、中期和长期时间框架的货币和黄金强度,以便将您的交易策略与市场趋势保持一致。 • 无论是快进快出的短线交易还是更长期的投资策略, FX Power 都能为您提供所需的信息。 Delta 动态分析用于趋势和反转 • 极端 Delta 值常常预示反转机会,而平缓的 Delta 变化则确认趋势延续。 • 使用 Delta 分析,轻
作者的更多信息
Advisor for semi-automatic trading with a virtual multi-level trail of take profit and stop loss, a trail of target profit, martingale functions, manual opening of orders, managing third-party orders, counting trading instruments, displaying current information and statistics on a chart. It is possible to set several levels of trailing take profit and stop loss and to each level to assign the percentage of partial closing of the order. The percentage of the lot when closing the level is calculat
Signal indicator Cma 2 Cjcf
VLADISLAV AKINDINOV
5 (1)
A signal indicator consisting of several well-known indicators that process data sequentially. 2 options - for schedule and basement. In the settings it is possible to enable alerts about the change of trend (alerts) sound, by e-mail and push. It is possible to change the colors and thickness of the lines, the colors and codes of the arrows, the number of calculation bars and separately configure the parameters included in the indicators.
FREE
The indicator is a mathematical analog of a two-level RC (resistor-capacitor) filter. On the chart (default colors), the red line is the standard terminal Moving Average, the values ​​of which are filtered by the first level filter (yellow line) and then by the second level filter (blue line). Moving Average sets the preliminary smoothing of the price series.  The indicator has the ability to use the sticking together of any combination of its own charts among themselves, if they are at a dist
MEA2RTEn
VLADISLAV AKINDINOV
The adviser works on the basis of terminal indicators. It can work in martingale mode if you set the number of unidirectional orders to be greater than 1 and adjust the lot coefficients and the step of opening the knees, which can be opened taking into account the indicator signal. If the adviser is launched on several instruments and the comments of the orders are the same, then you can limit the number of simultaneously trading advisers - the advisers themselves will track how much they are c
Arrow indicator of trend reversal with 2-level signaling and multi timeframe. The indicator line consists of 4 colors, indicating the divergence level and possible trend reversals. Light arrows indicate a weak trend, dark arrows indicate a strong one. Sensitivity levels and steps are set in the settings. Signals are output to the mailbox and mobile terminal.
The Expert Advisor trades on a trend reversal on any instrument and timeframe. Testing was carried out on the H4 timeframe. Trades are not frequent and therefore, to increase the number of trades, it is advisable to put on several instruments. To control the number of simultaneously trading advisors, a limit for trading symbols is set and advisors must have the same order comments. Closing deals can be done in virtual mode (preferably). There are information and statistics panels. Indicator base
CCi indicator with dynamic levels based on the standard MA, taken as the basis for reading the levels, and modified data of the standard CCi relative to the MA. The input parameter CutCCi, if greater than 0, limits the vertical drawing of the CCi graph, but does not affect the calculations. There are 3 options for displaying arrows: arrows when crossing levels to exit the level zone - trend, arrows to return after exiting the level zone - reverse and crossing the zero level (red MA line). You ca
Delta 2 symbols
VLADISLAV AKINDINOV
The indicator is designed for pair trading with 2 highly correlated instruments.  Indicator charts can be displayed as lines or histograms. There is an MTF mode, the maximum and minimum deltas for the calculated number of bars are displayed with a check for a specified minimum value. It is possible to enable the calculation of trade operations with checking the current correlation coefficient for the minimum specified, the current delta in points or percent of the maximum (minimum) delta and c
Growth and trend reversal indicator. It does not redraw in the bar calculation mode and can redraw on the 0th bar in the tick calculation mode. The trend line and level lines with their own settings are calculated separately. There are 2 types of arrows - for the intersection of trend lines and the reverse intersection of trend lines (reversal). The arrows are buffer and you can output signals to the Expert Advisor. The arrows can be duplicated with a sound signal, a message from the terminal,
Deviation trend indicator
VLADISLAV AKINDINOV
5 (1)
Indicator of trend deviation with a static level. The deviation coefficient is set for the trend histogram. Signals are the intersection of the level trend histogram in the direction of the trend or during a trend reversal - the option is selected in the indicator settings by the "Revers" parameter. There are all the necessary settings for the design of the indication and sending messages to mail or a mobile terminal. All input parameters have an intuitive name. Analog for MT5: https://www.mql5
CCi MA Trend
VLADISLAV AKINDINOV
The indicator consists of a base of the standard CCI and levels calculated on the basis of MAs, which move following the price. To strengthen the trend movement, the deviation coefficient is used. To exclude triggering in a flat, the minimum trend limiter is used. Signal arrows are displayed on the indicator chart and the price chart - everything is turned off. There is an arrow trigger function - the arrows alternate when it is turned on. You can display signals on a chart, on e-mail and on a m
Multi Closer MT4
VLADISLAV AKINDINOV
The utility is designed to control all account orders with the ability to automatically close them by: profit, breakeven or trailing profit in points separately for each order separately profit, breakeven or trailing profit in points for buy orders of each symbol profit, breakeven or trailing profit in points for sell orders of each symbol profit, breakeven or trailing profit in points for buy+sell orders of each symbol profit, breakeven or trailing profit in points for the entire account as a
Trade informant
VLADISLAV AKINDINOV
The indicator is designed to display information about current trading. The current information and statistics panel displays data on the number of trading orders, their profit and the number of lots. The equity status as a percentage of the balance of funds and the total profit of all orders on this instrument are also displayed. In the statistics panel, you can see information on closed orders from the beginning of the specified date in the settings. The panels have flexible settings for size
The Expert Advisor is designed for pair trading with 2 instruments with high positive or negative correlation. Instrument lots are balanced automatically depending on the tick value of the instrument, and therefore it is advisable to use the base lot of at least 0.05. The function of refills is built-in, taking into account the number of knees and the coefficients of multiplication and addition of lots. Trades are opened when there is a discrepancy by a specified distance in points of instrument
The Expert Advisor is designed for pair trading with 2 selected instruments with automatic calculation of the correlation coefficient and determination of one of 8 possible entries by 4 for positive and negative correlation. The inputs used are set in the settings: 1 and 3 for trading for a fall in the delta between instruments, 2 and 3 for trading for a rise in the delta (a more dangerous trading option). There are trade control buttons, information and statistical panels. There is a wide range
Trend reversal expert
VLADISLAV AKINDINOV
The Expert Advisor is based on a proprietary triple indicator. Each of the 3 parts of the indicator can be disabled and individually configured. Initially, it was supposed to enter trade at a trend reversal, but you can set up an entry along the trend. It is possible to control the main functions using the buttons on the chart, including opening positions manually. There are grid functions with the total profit of all unidirectional positions (for hedging accounts) with martingale functions (opt
Deviation trend
VLADISLAV AKINDINOV
Indicator of trend deviation with a static level. The deviation coefficient is set for the trend histogram. Signals are the intersection of the level trend histogram in the direction of the trend or during a trend reversal - the option is selected in the indicator settings by the "Revers" parameter. There are all the necessary settings for the design of the indication and sending messages to mail or a mobile terminal. All input parameters have an intuitive name. Analog for MT4: https://www.mql5.
Delta 2 Symbols MT5
VLADISLAV AKINDINOV
The indicator is designed for pair trading with 2 highly correlated instruments.  Indicator charts can be displayed as lines or histograms. There is an MTF mode, the maximum and minimum deltas for the calculated number of bars are displayed with a check for a specified minimum value. It is possible to enable the calculation of trade operations with checking the current correlation coefficient for the minimum specified, the current delta in points or percent of the maximum (minimum) delta and c
The indicator calculates the correlation coefficient of 2 instruments, shifts the chart of the 2nd instrument relative to the 1st and displays the charts of both instruments on the current chart. The maximum positive and negative deltas and the current delta as a percentage of the maximum are calculated. It is possible for signals to set a delta for entry and exit with displaying the direction of entry into trade for each instrument. The space between the charts is also filled with different col
Signal scanner MT5
VLADISLAV AKINDINOV
The scanner is designed to scan signal buffers of indicators (arrows) and display the nearest signal bar on the panel in color and digital display. Symbols to be scanned, time frames and the number of bars to be scanned are specified, starting from the current (0th) bar. There is also a complex signal, which indicates a list of timeframes on which the indicator signal must match.   You can collapse the indicator by clicking the left mouse button on the upper left corner of the panel (name) a
Extremum levels
VLADISLAV AKINDINOV
此指標顯示前一天、前一周和前一個月的最高價和最低價。 旨在確定極值點的突破並確定進入交易的方向。 為了更準確地確定反轉水平,您可以顯示斐波那契水平。 也可以在最高價和最低價之間的空間上進行繪製,以更清楚地顯示上一個計費週期的價格變動。 指示當前蠟燭(柱)關閉之前的時間。 2.0 版在鋸齒形上新增了 3 個反轉等級的訊號,並為每個等級提供警報。 This indicator shows the maximum and minimum prices of the previous day, week and month. Designed to identify breakouts of extreme points and determine the direction of entry into a trade. To more accurately determine reversal levels, you can display Fibonacci levels. It can also be plotted in the space between the high and
Semi automatic expert
VLADISLAV AKINDINOV
The advisor is intended for trading on a hedging account, because trades in both directions simultaneously. In this case, you can use both trading with one order (preferably) and a grid of orders in martingale mode. In this case, built-in indicators of our own design are used. There is a limit on the number of simultaneously trading symbols. Trading can be carried out on any symbol with any time frames. The advisor has built-in functionality for manual trading. This is a panel with the ability
Flipping expert
VLADISLAV AKINDINOV
The advisor is intended for trading on a hedging account, because trades in both directions simultaneously and reverses the direction of trade. In this case, you can use both trading with one order (preferably) and a grid of orders in martingale mode. In this case, a built-in indicator of our own design is used. There is a limit on the number of simultaneously trading advisors. Trading can be carried out on any symbol with any time frames.
Semi automatic scalper
VLADISLAV AKINDINOV
The advisor is designed for trading on a hedging account, since it trades simultaneously in both directions. In this case, you can use both trading with one order (preferably), and a grid of orders in the martingale mode. In this case, a built-in indicator of our own design is used. There is a limit on the number of simultaneously trading symbols. Trading can be conducted on any symbol with any timeframes, but the emphasis was placed on trading gold. The advisor has built-in functionality for
Scan pattern
VLADISLAV AKINDINOV
The indicator is designed to help in making a decision on the direction of trading (buy or sell). It is a history scanner that searches for matches of the current pattern (combination of several current bars) with historical data in percentage terms by the relative vertical position of candles relative to each other, the size of each candle, the size of the candle body and the candle shadows. In history, the matches found are indicated by vertical lines on the candle of the beginning of the soug
The indicator is a combination of 3 identical moving averages with a JMA calculation option with different smoothing depth settings. When the fast line crosses the middle and slow lines, the color of all lines changes, and only when the fast line crosses the middle and slow lines in the opposite direction will the color change - a trigger is triggered that does not allow switching directions if only the middle or slow line was crossed, so that the readings do not jump and there is a confident
Trade informant MT5
VLADISLAV AKINDINOV
The indicator is designed to display information about current trading. The current information and statistics panel displays data on the number of trading orders, their profit and the number of lots. The equity status as a percentage of the balance of funds and the total profit of all orders on this instrument are also displayed. In the statistics panel, you can see information on closed orders from the beginning of the specified date in the settings. The panels have flexible size and color se
筛选:
无评论
回复评论