Carsten Pflug / 个人资料
- 信息
|
7+ 年
经验
|
14
产品
|
116
演示版
|
|
9
工作
|
0
信号
|
0
订阅者
|
https://www.mql5.com/en/market/product/67274

THE flexible Expert Advisor for Custom Trading Strategies in MetaTrader 5 The Netsrac TradeAid expert is a powerful tool for traders looking to develop their own trading strategies in MetaTrader 5. With this expert advisor, you can combine a variety of technical indicators and trading rules with a simple "If This (AND This...) Then That" logic to create tailored trading strategies that match your individual preferences. You don´t need any knowledge in MQL5 coding language to build your own
The Netsrac Supply&Demand Dashboard shows you at a glance where relevant zones are located on your favorite assets. Open your chart directly from the dashboard and trade zones that really matter. Features Finds the next relevant supply and demand zone and displays the distance to this zone (in pips) Finds and displays the zones in three different timeframes Calculates a trend indicator for the current and past candle for each configured time frame Opens a chart with your chart template
Netsrac "Supply and Demand Easy" is a small but highly specialized tool for quickly finding supply & demand zones without frills. It shows the next supply and demand zone in the current timeframe. Highly efficient and fast. Works perfectly with the Netsrac "Supply and Demand Dashboard" (https://www.mql5.com/en/market/product/96511 ) Controls Variable Description (SD01) Supply color Set your color for supply zones (default is LightCoral) (SD02) Demand color Set your color for demand zones

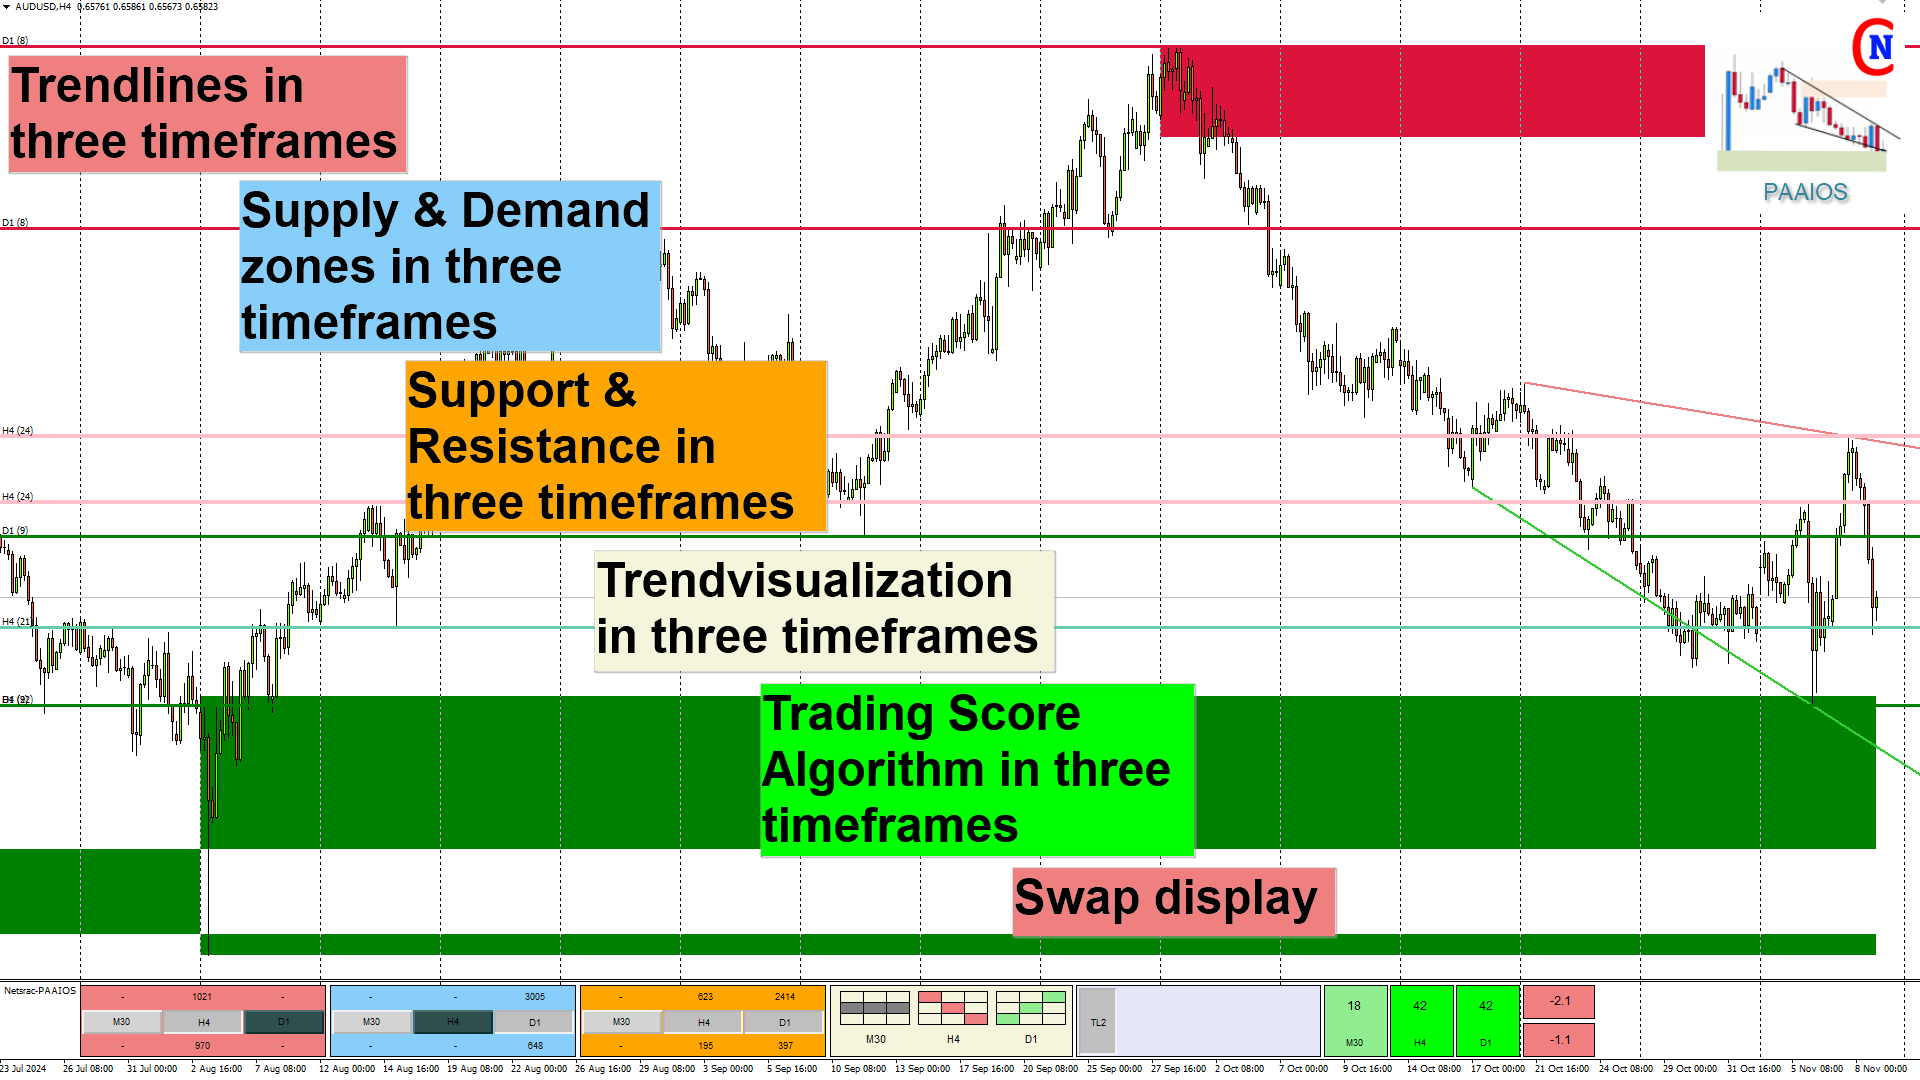
PAAIOS 指 的 是 价格 一体化 解决。 而 这 正 是 该 指标 目的 它 应该 给 你 一 个 来 果断 地 改善 的 交易 可以 时间 框架 中 显示 趋势 "线、需求和供应区。 特点 * 检测多时间框架的供应和需求区 * 探测并显示多时间框架的趋势线 * 探测多个时间段的趋势行为--你可以一目了然地了解全貌 * 如果一个区域/趋势线接近价格,就会提醒你(屏幕、通知、邮件)。 * 使用智能算法,只计算强势的供应和需求区。 供应和需求 - 它是如何工作的 PAAIOS使用一个内部的人字形函数来计算多时间框架的人字形来获得波动。这没有什么特别的。但是PAAIOS测量的是所有的波动,只考虑真正显著的波动开始的区域。所以你可以从多个时间框架中得到真正强大的买方和卖方区域。 趋势线 - 它是如何工作的 Paaios 也 内部 zigzag 来 计算 趋势线。 这 什么 特别 的。 但是 , 如果 使用 较 高 时间 段 的 趋势线 并 供求 关系 结合 , 你 会 得到 真正 强势 的 指示 在 在 价格 价格 价格 价格 价格 价格 价格 价格 价格 价格 价格价格 价格 价格
With the SR Dashboard, you get a powerful tool to control some of the most important information in trading. Assemble a setup according to your strategy and get informed as soon as this setup is valid. Assign scores to defined conditions and let the Dashboard find them. Choose from Trend, Average Daily Range, RSI, Moving Averages, Pivot (Daily, Weekly, Monthly), Highs and Lows, Candlestick Patterns. What can you do with this tool? Use the dashboard as a powerful tool for your discretionary

The intention of the dashboard is to provide a quick overview of the daily, weekly and monthly range of configured assets. In "single asset mode" the dashboard shows you possible reversal points directly in the chart, thus making statistics directly tradable. If a configured threshold is exceeded, the dashboard can send a screen alert, a notification (to the mobile MT5) or an email. There are various ways of using this information. One approach is that an asset that has completed nearly
The Netsrac Correlation Trade Indicator (NCTI) was created to trade correlations between different assets. NCTI offers five different strategies to do this. Five different correlation trading strategies with two or three assets Fast access your assets with one click via asset buttons Your profit/loss at a glance Configurable alerts via screen or mobile You can use the indicator with every timeframe. Higher timeframes give fewer but better signals. If you have some questions or suggestions -

The Netsrac Correlation Trade Indicator (NCTI) was created to trade correlations between different assets. NCTI offers five different strategies to do this. Five different correlation trading strategies with two or three assets Fast access your assets with one click via asset buttons Your profit/loss at a glance Configurable alerts via screen or mobile You can use the indicator with every timeframe. Higher timeframes give fewer but better signals. If you have some questions or suggestions -


Netsrac Correlation Trader(NCT)是一个非常强大的工具,可以用对冲订单交易正负相关的货币对。 1)它寻找正负相关的货币对 2) 如果相关货币对不平衡,它会向你显示一个信号 3) 它可以通过你设置的时间框架和信号值来 "自动交易 "一些或所有的相关货币对(小心处理) 4) 它可以设置正确的手数,以拥有点值和每日范围的最佳对冲交易 5)它可以成为你的单一工具来支持你的关联交易的自由裁量权 你可以为EA的信号使用任何时间框架。小的时间框架比大的时间框架需要更多的人工干预。从M30开始的时间框架更适合于自动交易。我将逐步增加更多的功能,支持手动和自动交易。 如果您有一些问题或建议--请随时联系我。请阅读我的博客文章( https://www.mql5.com/en/blogs/post/726866 ),了解本EA的设置! 请注意。本EA不能进行回测,而且!DEMO是无用的!因为它至少同时在两种资产中交易(对冲订单)。 如果你不知道,这个专家是否适合你--请利用廉价的测试月。你将不会后悔。或者,使用免费的DEMO,可以在这里找到(


- New section: RSI (it is the last feature update for SR-Dashboard to stay consistently for my existing customers)
- Optical and performance enhancements
https://www.mql5.com/en/market/product/34855


