SR Key Breakout and Jump Levels

4.7

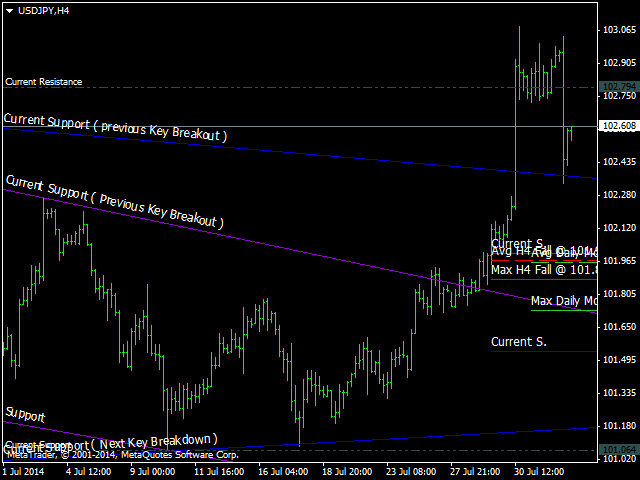
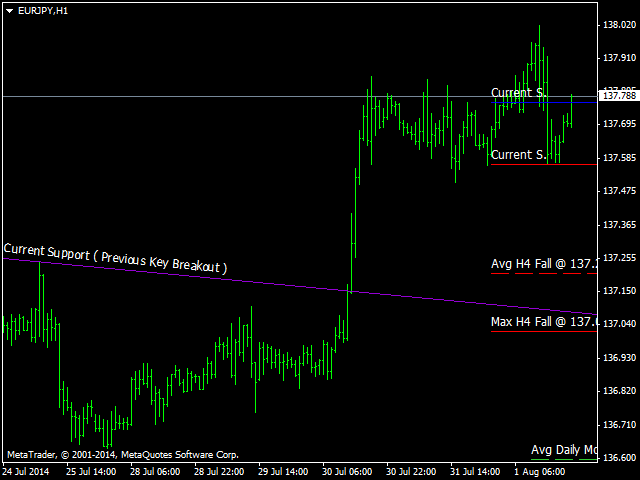
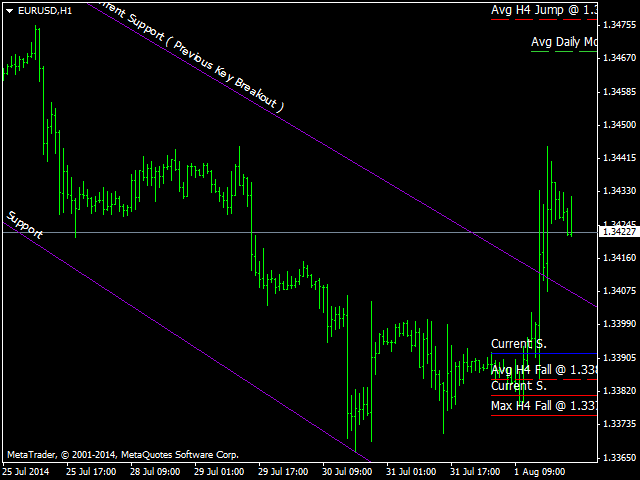
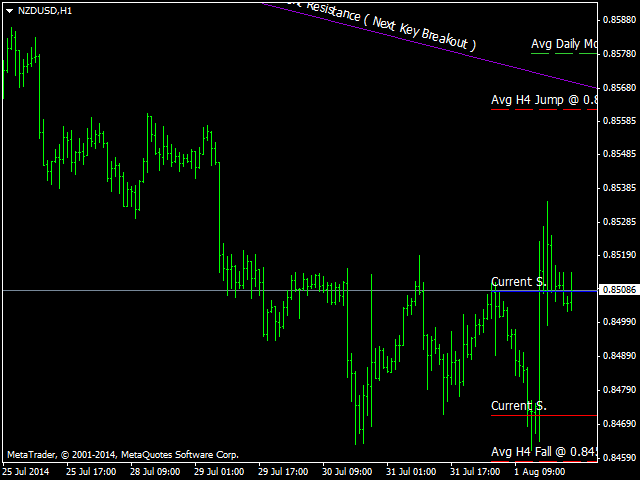
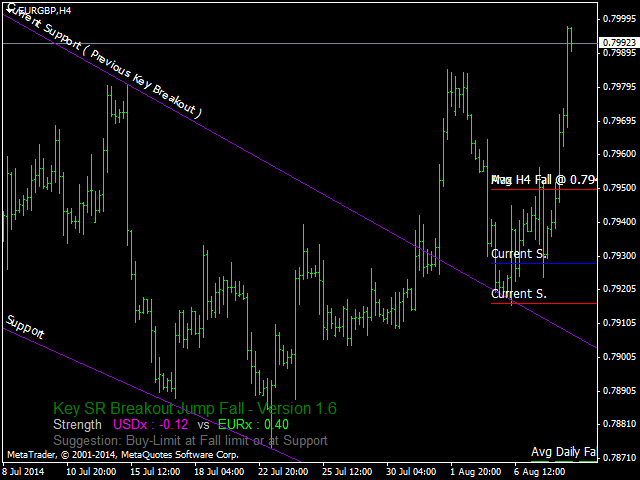
Key Breakout and Jump/Fall levels. No lagging. No repaint.

  1. Trend line is useful for detecting pattern, which is intended for the triangle pattern, Support & Resistance lines, and as a breakout up or down line. 
  2. The trend lines are formed first before the price of the pair reach it. So it does not repaint. 
  3. Each line has a description, such as Support, Resistance, Current-Support as key breakout down, and Current-Resistance as a key breakout up. 
  4. Each broke out line turns into a new support or resistance line. These changes run automatically and in real-time. 
  5. S/R horizontal lines nearest to the trend line are strong S/R levels. 

When human is under pressure, or sometimes under normal circumstances, people often forget about something trivial but actually important. That is a pattern that channel since the beginning has indicated signs of a breakout or breakdown. And when the price is in a consolidation period, sideways, humans often forgotten any triangle pattern. Which makes them ultimately surprised when a breakout or breakdown coming.

This indicator will automatically draw the channel and pattern, and the upper and lower limits in the event of a breakout and breakdown. Scalper or Intraday traders will be able to utilize these indicators on a scale of H1 and H4. Or even on a larger scale charts can be used for Swing.

Use this indicator wisely and remain on good MM, and advised to immediately lock the position that has been moving in the direction expected. Because the face of the market is not easy. Better identify all the signs were there before taking trading positions, including channel and marks the beginning before the breakout and breakdown, and the extent to which the limit of a price jump or jump during high volatility. You do not need to hurry for a drawing and pattern channels because of this indicator works for you.

评分 16
RalfHornig
186
RalfHornig 2020.06.22 22:20 
 

Hallo Frau Yohanda. Sehr guter Indikator. Könnten sie mir bitte eine Deutsche Erklärung der Linien zukommen lassen. Auch von den Farbigen.Bin ganz frisch in diesem Gewerbe. :-) LG Ralf PS eventuell könnten sie mir was auf die Mailadresse schicken ist vielleicht einfacher für Sie. Vielen Dank im Voraus. Ralf110460@gmail.com

Unopiufigo Hugo
26
Unopiufigo Hugo 2020.05.09 16:00 
 

This indicator is good. Just what I need. author also very helpful. 5 stars :)

Abou Azouz
431
Abou Azouz 2020.04.07 01:58 
 

An excellent indicator that deserves really nice support that really deserves five stars

推荐产品
本指标是实践实战交易完善的波浪自动分析的指标 !  案例... 注: 波浪分级用西方叫法不习惯,因受到缠论(缠中说禅)命名方式习惯的影响,我是将基础波浪命名为 笔 ,将二级波段命名为 段 ,同时具有趋势方向的段命名为 主趋段 (以后笔记中都是这种命名方式,先告知大家),但是算法上和缠论关系不大切勿混淆.反映的是本人分析盘面总结的 千变万化纷繁复杂的运行规律 . 对波段进行了标准化定义,不再是不同人不同的浪  ,    对人为干扰的画法进行了排除,在严格分析进场起到了关键的作用 . 使用这个指标,等于将交易界面提升美感,抛弃最原始的K线交易带你进入新的交易层次.如果不是为了交易,在宣传上也将使客户观感提升层次. 指标内容: 1. 基础波浪 (笔) : 首先我们找出了价格波动过程中的基础波动拐点,当然他的有序性低,为下一步的计算提供基础. 2. 二级波段( 段 ) :在基础波浪的基础上,通过算法分析得到层级更明显的二级波段,二级波段为波浪提供了分析基础 3. 波浪( 浪 ): 有着更清晰的趋势,更清晰直观的方向.分析一个波浪是否延续,需要看二级波段的形态,分析二级的构成,可以得出波浪
This indicator Super Neuro Trend indicator.Indicator displays trend movement. Indicator helps to buy and sell. Features FiltPer- displays indicator period. deviation - displaus indicator deviation. Trend - displaus indicator trend.( true,false) Rectangle - displaus indicator rectangle. (true,false)  How to understand the status: If the trend color is green, trend is up. I f the trend color is red, trend is down. I f the trend waiting,trend waiting.     ///////////////////////////////////////////
Chart Analyzer
Innovicient Limited
The Chart Analyzer is an MT4 indicator that provides visual arrow signals without redrawing them. In addition, we have included trendlines to validate your entries. This indicator has been fine-tuned to work with all timeframes and instruments.  The Chart Analyzer has a number of advantages Does not fade or remove arrows when drawn Sends both email and phone alerts. It is light on computer resources Easy to install. Default setting works just fine.  If price opens above the trendline, open bu
Moving Pivot Average    The pivot indicator compares the selected period with its counterpart from the previous period. The indicator uses very flexible algorithm for pivot value calculating. It allows you to allocate in days a certain time intervals (custom bars) and calculate the average pivot value based on High, Low and Close prices of these bars. How many custom bars will be taken into account is determined by the "Days" setting. The pivot line can be considered an average trend line and us
Note : The slow loading of the indicator issue has been addressed . This new version loads fast and does not slow the platform. Version 1.3 : We have updated the indicator to include an historical bar scanning option . So instead of scanning all bars in the history (which can make the indicator slow sometimes ) , you can select the maximum number of bars it can scan which can increase the performance and make the indicator faster. This indicator scans the 1-3 Trendline pattern . The indicato
Happy Kangaroo
Pui Yan Leung
Overview Happy Kangaroo is a trend-following tool designed to identify market direction and provide high-probability entry signals based on volatility. By combining price action with the Average True Range (ATR), it visualize a dynamic support and resistance level of the price.     Key Features   The indicator's power lies in its customizable parameters and mathematical precision:  Dynamic Trend Detection: Uses the ATR period and factor to calculate the volatility bands. It identifies an Uptrend
My Point MT4
Claudia Ramona Angerer
4 (1)
Diagnosis of major and minor pivot Trend detection with many signals Can be used in all symbols Can be used in all time frames Settings: Back Show: The number of candles it displays If you need any adjustments, or have any questions or suggestions, message me How to trade: Blue: sell signal Red: buy signal Blue and red at the same time: no signal Exit signal: Opposite signal
Ska ZigZag BuySell
NKATEKO VUKOSI LEROY MASANGO
Ska ZigZag BuySell indicator determines the overbought and oversold regions within a trend. The indicator determines the overbought region by the candlestick high and the oversold region by the candlestick low. This indicator only gives signals with arrow and audible alerts each and every time when a new candlestick appear. To utilize the full strategy i recommend using "Ska ZigZag BuySell" together with "Ska ZigZag Line". The Ska ZigZag Line indicator is available for free. NOTE: Indicator is h
This is a simple and efficient indicator based on market logic. The indicator creates a range chosen by a trader. Trader selects only two parameters. The first one is the number of candles that define the frame. The second one is the number of candles needed for confirmation frame. The indicator shows all situations in history and works with the actual movement of the market. The indicator works on all timeframes . You are not limited by use of different timeframes, the indicator is able to adap
ENTRY AND EXIT ARROWS Indicator – Description The Entry and Exit Arrows indicator is a simple yet effective momentum-based tool designed to highlight potential buy and sell opportunities directly on the chart using visual arrows. It works by comparing two internal momentum measurements with different sensitivities. When both measurements align in the same direction, the indicator confirms a stronger directional bias and plots a signal. How It Works Buy Signal (Lime Arrow Below Candle): Appea
Introduction to Fractal Pattern Scanner Fractal Indicator refers to the technical indicator that makes use of the fractal geometry found in the financial market. Fractal Pattern Scanner is the advanced Fractal Indicator that brings the latest trading technology after the extensive research and development work in the fractal geometry in the financial market. The most important feature in Fractal Pattern Scanner is the ability to measure the turning point probability as well as the trend probabi
PrecisionCore Arrows
Cosmas Akamadu Nwachukwu
This indicator gives fewer signals but precise that gives less number of signal with more precise signals. By plotting Entry and Exit points  Enter Buy when the Blue Arrow appears  Exit Buy when the Red X sign appears Enter Sell when the Red Arrow Appears    Exit Sell when the Blue X Sign Appears Signal is Non-Repaint  Tested currency Pairs  EUR/USD 1M M5 M15 GBP/USD M5 M15 M30 GBP/JPY M5 M15 M30 Important!  Do not set bars back beyond 1500, anything beyond that becomes more hardware inte
FREE
The indicator determines a special pattern of Joe Dinapoli. It gives very high probability buy and sell signals. Indicator does not repaint. Indicator Usage Buy Signal ''B'' Entry : Market buy order at signal bar close Stop : Low of signal bar Take Profit : First swing high Sell Signal ''S'' Entry : Market sell order at signal bar close Stop : High of signal bar Take Profit : First swing low Indicator Parameters Fast EMA : External Parameter (should be kept as default) Slow EMA: External Parame
Stoch Color Indicator
Adrian Hernandez Castellanos
指数平滑异动指标(Stochastic Oscillator)带颜色 该指标根据指标的趋势来着色背景。该指标根据指数平滑异动指标的值来着色背景,无论是上升趋势还是下降趋势。背景颜色由指数平滑异动指标的参数确定,仅绘制最近400个柱状图(请参阅注释)。 可修改的参数: %K Period : %K 周期 %D Period : %D 周期 Slowing : 慢速周期 Price Field : Low/High, Close/Close MA Method : Simple, Exponential, Smoothed, Linear weighted. Color Positive Trend :上升趋势的背景颜色 Color Negative Trend :下降趋势的背景颜色 Color Neutral Trend :中性趋势的背景颜色 Print all plots ?:默认情况下, 指标仅显示最近两周的值。 如果要查看所有值, 必须将参数设置为“true”(请参阅注释)。 ** 如何使用指标: 与您在图表上拖放和放置的任何其他 MetaTrader 指标一样工作。 结论:
ARM Pro
Aleksandr Makarov
The ARM Pro indicator is an excellent tool that will enhance traders' market analysis by combining trend identification with entry points and reversal alerts. This indicator allows users to confidently and accurately navigate the complexities of the Forex market. Key benefits: ·  Works on MT4 ·  Clear buy and sell signals ·  Doesn't repaint ·  Works on all assets Indicator 100% does not repaint!!! Once a signal appears, it never disappears (wait for the current price to close)! This is unlike
BreakevenMarginCallPanel
Andrian Armand Gannery
This is indicator for checking your trades. Please see the pictures attachment, the indicator show info about: - Breakeven Level; - Margin Call Level; - Two volume info, past and current (With color exchange base on the past volume); - Spreads; - Swap Long and Swap Short (With color change, positive and negative swap); - Running Price; -Today High Low Pips; - Today Open to Current Running Price pips. This indicator not for trading entry, only to assist your trade management Regards
The indicator monitors the MACD trend in multiple timeframes for a specific market. No more shifting in between charts to check the trend direction while trading. Key Features Indicator can be used for all markets Monitors every timeframe, from M1 to MN Able to move display label on chart by single click Indicator Usage The dashboard appears to the left and upper part of the chart when attached. The shell encapsulating a timeframe goes red on a down trend, green on an up trend. If the default
Trend Divergence Indicator: Your Essential Tool for Market Analysis The Trend Divergence Indicator is a powerful tool designed to assist traders in identifying market trends and pinpointing entry points with precision. By leveraging price divergence, this indicator enhances your trading strategy, offering reliable insights and filtering unnecessary signals. Key Features and Benefits of the Trend Divergence Indicator Accurate Trend Analysis: The Trend Divergence Indicator uses price divergence t
-   Real price is 90$   - 50% Discount ( It is 45$ now ) Contact me for instruction, any questions! Introduction V Bottoms and Tops (or Fibonacci Retracement) are popular   chart patterns   among traders due to their potential for identifying trend reversals. These patterns are characterized by sharp and sudden price movements, creating a V-shaped or inverted V-shaped formation on the   chart . By recognizing these patterns, traders can anticipate potential shifts in market direction and posi
The indicator draws trend lines based on Thomas Demark algorithm. It draws lines from different timeframes on one chart. The timeframes can be higher than or equal to the timeframe of the chart, on which the indicator is used. The indicator considers breakthrough qualifiers (if the conditions are met, an additional symbol appears in the place of the breakthrough) and draws approximate targets (target line above/below the current prices) according to Demark algorithm. Recommended timeframes for t
TMoney OrderblockDay
Moises Orlando Urbina Sojo
The indicator is triggered at the start of each trading day and detects both bullish and bearish ORDERBLOCK potentials. These levels are of high operational probability, being able to use a minimum ratio of 3 to 1 to maximize profits. It is recommended to use TimeFrame M5 to M30 for a proper display and consider pending orders at the OB levels of the chart and place the SL up to a maximum of 20 pips from the entry price. Submit the indicator to Backtesting to become familiar with its performan
ACB Breakout Arrows Scanner MT4
KEENBASE SOFTWARE SOLUTIONS
这是我们的指标 ACB Breakout Arrows 的多品种、多时间周期扫描器。默认情况下,它可同时在 28 个货币对和 9 个时间周期 上扫描买入/卖出信号,为交易者节省大量查图时间,提高操作效率。  功能特点 可在一个图表中扫描多达 252* 个品种与时间周期的组合,极大地提升监控能力。 点击任一信号即可打开相应图表,并自动加载预设模板,便于快速跟进。 面板可自由拖动并放置于图表上的任意位置。 支持实时提醒功能,包括弹窗提示、声音报警、推送通知和电子邮件提醒,确保不错过任何重要信号。  输入参数 为 ACB Breakout Arrows 设置信号灵敏度,可根据策略需求微调。 Symbols:填写你希望系统扫描的货币对或交易品种。  刷新历史:如发现图表数据缺失或异常,可通过此选项自动下载并更新历史数据。  选择所需扫描的时间周期,可单选或多选。 提醒设置:自定义提醒类型与条件,提升响应效率。 面板颜色与字体大小均可自由调整,支持个性化视觉体验。 
Double Price Tap
Vitalii Krasil'nikov
Double Price Tap — an MT4 indicator that reliably shows large players' limit levels, reversal points, and likely breakout zones. Short summary Double Price Tap detects real price holding: when two consecutive bars hit the exact same price pip‑to‑pip and fail to break it, that forms a real price boundary. The indicator marks these spots on the chart and highlights where a bounce or an imminent breakout is likely. How to read the signals Up arrow — two consecutive bars touched the same high (p
All Pivot Points
Alfred Kamal
5 (1)
Pivot Points is used by traders to objectively determine potential support and resistance levels. Pivots can be extremely useful in Forex since many currency pairs usually fluctuate between these levels. Most of the time, price ranges between R1 and S1. Pivot points can be used by range, breakout, and trend traders. Range-bound Forex traders will enter a buy order near identified levels of support and a sell order when the pair nears resistance. But there is more one method to determine Pivot po
SmartScalper
Oleg Borisov
5 (2)
The easy-to-use trading system SmartScalper generates the following signals: BUY SELL close BUY close SEEL SmartScalper works on the М15 timeframe and is optimized to work on GBPUSD, XAUUSD, GBPJPY, EURJPY, EURUSD. 12 different sets of trading algorithms are designed for trading (6 buy and 6 sell trades), which can be quickly selected by the trader using buttons in the indicator window, or are set in the input dialog. The efficiency of the trading algorithms chosen by the trader is measured in r
All Pivot Points Scanner
Hussein Adnan Kadhim
Support And Resistance Screener is in one level indicator for MetaTrader that provide multiple tools inside one indicator. The available tools are :  1. Market Structure Screener. 2. Bullish Pullback Zone. 3. Bearish Pullback Zone. 4. Daily Pivots Points 5. weekly Pivots Points 6. monthly Pivots Points 7. Strong Support and Resistance based on Harmonic Pattern and volume. 8. Bank Level Zones. Key Features All in one level indicator. All types of alerts ( Pop-up alert, puss notification alerts.
Alert Up Down MT4
William Oswaldo Mayorga Urduy
METATRADER 5 的警报向上 - 向下 当价格离开 UP 和 DOWN 线之间的区域时,该指标会生成警报。 您可以生成各种类型的警报,例如: > 声音 > 留言框 > 在专家框中留言 > 邮件(之前配置) > 推送通知(先前配置) 线条必须从指标属性配置,而不是从线条属性配置,因为如果从线条属性完成,finonacci 可能会受到影响。 在这些设置中,您可以更改颜色、线条样式和宽度。 线条必须从指标属性配置,而不是从线条属性配置,因为如果从线条属性完成,finonacci 可能会受到影响。 在这些设置中,您可以更改颜色、线条样式和宽度。 线条必须从指标属性配置,而不是从线条属性配置,因为如果从线条属性完成,finonacci 可能会受到影响。 在这些设置中,您可以更改颜色、线条样式和宽度。
Super MA Trend indicator is an indicator designed to find trends. It uses a moving average, a set of candle combinations and High/Low levels to find trends. This indicator is a complete trading system. You can trade with this indicator as you like. Features and Recommendations You can use this indicator on all pairs except for the volatile pairs. It is recommended to use it on M15 and over graphics. The most important element in this indicator are alerts. Do not open orders unless you receive a
Our "Trending Topik" Forex Expert Advisor works based on several non-lagging Forex indicators and combined with Swing High/Low, Break Trendline , break candle stick, ADR Daily and support, pivot, resisten daily , searching current major trends and looking for the best momentum with built-in Hidden Profit, StopLoss, BreakEvent and Trailling. It works on multi pair and multi timeframe like GOLD/XAUSD, EURUSD, GBPUSD, EURJPY and others.  Trending Topik EA Concept EA Trending Topik is the latest
Harmonic Trading is now much easy than ever before with Harmonic Master Scanner Pro you can now scan time frames from 5m to 1w for 17 harmonic patterns on all bares at the same time. Harmonic Master Scanner Pro works based on original MetaTrader4 Zigzag indicator and the standard harmonic patterns elements. This software send alert and email to you when a harmonic pattern is detected on any charts. If you want the scanner to draw the pattern just switch the time frame to the alert time frame. Th
该产品的买家也购买
Neuro Poseidon MT4
Daria Rezueva
4.94 (35)
Neuro Poseidon is a new indicator by Daria Rezueva. It combines precise trading signals with adaptive TP/SL levels - creating best possible trades as a result! Message me and get  Neuro Poseidon Assistant  as a gift to automize your trading process! What makes it stand out? 1. Proven profitability on all assets and timeframes 2. Only confirmed BUY and SELL signals present on the chart 3. Adaptive TP & SL levels generated by the software for each trade 4. Easy to understand - suitable for all
Gann Made Easy
Oleg Rodin
4.84 (165)
Gann Made Easy 是一个专业且易于使用的外汇交易系统,它基于使用先生理论的最佳交易原则。 W.D.江恩。该指标提供准确的买入和卖出信号,包括止损和获利水平。您甚至可以使用推送通知在旅途中进行交易。 购买后请联系我,即可免费获得交易指导和超棒的额外指标! 您可能已经多次听说过江恩交易方法。通常 Gann 的理论不仅对于新手交易者而且对于那些已经有一定交易经验的人来说都是非常复杂的东西。这是因为江恩的交易方法在理论上并不那么容易应用。我花了几年时间来完善这些知识,并将最好的原则应用到我的外汇指标中。 该指标非常易于应用。您所需要的只是将其附加到您的图表并遵循简单的交易建议。该指标不断进行市场分析工作并寻找交易机会。当它检测到一个好的入口点时,它会为您提供一个箭头信号。该指标还显示止损和获利水平。 换句话说,当您像先生一样进行交易时,该指标会为您提供最佳江恩建议。江恩亲自告诉你此时此刻该做什么。但最好的部分是您不需要了解任何有关江恩交易原则的知识,因为该指标会为您完成整个市场分析工作。
Trend Catcher ind
Ramil Minniakhmetov
5 (2)
趨勢捕捉指標 趨勢捕捉指標結合了作者獨有的客製化自適應趨勢分析指標,用於分析市場價格趨勢。它透過過濾掉短期噪音,並專注於潛在的動能強度、波動性擴張和價格結構行為,來識別真實的市場方向。此外,它還結合了平滑和趨勢過濾等客製化指標,例如移動平均線、相對強弱指標 (RSI) 和波動率過濾器。 您可以在這裡查看實際運行情況以及我的其他產品: https://www.mql5.com/en/users/mechanic/seller 請注意,我不會在 Telegram 上出售 EA 或任何設置,那是騙局。所有設定都可以在我的部落格上免費取得。 重要提示!購買後請立即聯繫我,以獲取使用說明和額外獎勵! 請注意,我不會在 Telegram 上出售 EA 或任何設置,那是騙局。所有設定都可以在我的部落格上免費取得。
M1 Sniper
Oleg Rodin
5 (24)
M1 SNIPER 是一款易于使用的交易指标系统。它是一个专为 M1 时间框架设计的箭头指标。该指标可以作为独立的系统在 M1 时间框架下进行剥头皮交易,也可以作为您现有交易系统的一部分使用。虽然该交易系统专为 M1 时间框架交易而设计,但它也可以用于其他时间框架。我最初设计此方法是为了交易 XAUUSD 和 BTCUSD。但我发现这种方法在其他市场交易中也同样有用。 指标信号既可以顺势交易,也可以逆势交易。我教授一种特殊的交易技巧,帮助您利用指标信号进行双向交易。该方法基于使用特殊的动态支撑位和阻力位区域。 购买后,您可以立即下载 M1 SNIPER 箭头指标。此外,我还为所有 M1 SNIPER 工具用户免费提供下方屏幕截图所示的 Apollo Dynamic SR 指标!这两个指标的组合可以帮助您更轻松、更准确地利用 M1 时间框架进行交易。 购买后请联系我,免费获取交易提示和奖励指标! 祝您交易成功!
Advanced Supply Demand
Bernhard Schweigert
4.91 (300)
现在优惠 30%! 任何新手或专业交易者的最佳解决方案! 该指标是一款独特、高质量、且价格合理的交易工具,因为我们已经整合了许多专有功能和新公式。 依据此更新,您将能够显示双重时间帧区域。 您不仅可以显示一个较高的时间帧,还可以同时显示图表时间帧,加上更高的时间帧:显示嵌套时区。 供需双方所有交易者都会喜欢它。 :) 重要信息披露 高级供需的最大潜力,请访问 https://www.mql5.com/zh/blogs/post/720245   想象您的交易如何得以改善,是因为您能够精准定位入场或目标位吗? 构建于新的底层算法,它可以更轻松地识别出买卖双方之间的潜在失衡。 这是因为它以图形方式展示供需最强劲区域,及其过去的表现(显示旧区域)。 这些功能旨在帮助您更轻松地发现最佳入场区域和价位。 现在您可以针对您的交易品种和时间帧来优化和编辑区域强度! 高级供需指标适用于所有产品和时间帧。 它是一个新的公式,非常新的功能是两个区域强度函数可由用户输入进行调整! 这在交易中是一大优势。 当您学习如何使用专有功能,例如带有价格游离最小 X 因子的区域强度时,您能够判断该区域强劲与否。 供需
Scalper Inside PRO
Alexey Minkov
4.74 (68)
Scalper Inside PRO Scalper Inside PRO 是一款适用于 MetaTrader 4 的日内趋势与剥头皮指标,使用专有算法快速识别市场方向和关键目标价位。它能够自动计算进场价、出场价以及多级止盈目标,并显示详细的绩效统计,让您了解不同交易品种和策略以往的表现情况,从而帮助您为当前的市场环境选择最合适的交易工具。此外,您还可以将自己的箭头指标轻松接入 Scalper Inside PRO,快速评估其统计数据和历史表现。 该指标可用于任何交易品种和任何周期(建议在 M5 上进行日内交易),并内置多种交易策略,因此既可以作为独立的剥头皮工具使用,也可以作为您交易系统中功能强大的分析组件。 主要功能 通过专有算法(Next‑Generation Trend Detection Algorithm,NG TDA)快速识别当前市场趋势。 自动计算日内交易的进场价、出场价和多级止盈目标。 内置策略与统计模块,用于评估不同市场环境下各品种的表现。 支持接入自定义箭头指标(PRO 模式),并计算其详细信号统计数据。 适用于外汇、金属、指数、股票、商品、期货和加密货币等各类市
Breakout Arrows Mt4
Michael Oko Oboh
5 (1)
Trend Breakout Arrows Indicator The Trend Breakout Arrows Indicator is a momentum-based signal tool designed to identify potential bullish and bearish breakout opportunities. It displays clear arrow signals directly on the price chart, helping traders quickly recognize possible trend changes and continuation setups. Up Arrow (Buy Signal) A magenta up arrow appears below a candle when bullish momentum begins to strengthen. This signal indicates that buying pressure may be overtaking selling press
Current event:  https://c.mql5.com/1/326/A2SR2025_NoMusic.gif A. 什么是 A2SR ?   * 这是一个领先的技术指标(没有重绘,没有滞后)。  -  指导 : -- 在  https://www.mql5.com/en/blogs/post/734748/page4#comment_16532516 -- 和  https://www.mql5.com/en/users/yohana/blog A2SR 在确定支撑(需求)和阻力(供应)水平方面有一种特殊的技术。 与我们在网上看到的普通方式不同,A2SR 在确定实际 SR 级别时有一个独创的概念。 原技术不是从网上拿来的,也没有在网上公开过。 A2SR 将根据您的交易风格自动选择 SR 级别。 即使您正在更改时间范围,但 SR 级别仍将保留在其位置上。 因为实际的 SR 不是从你使用的时间范围内获得的。 A2SR 拥有完整的交易工具 。 实际支持(需求)和阻力(供应)的真正概念。 新闻事件和央行讲话的市场情绪。 新闻事件和趋势的主要货币强度 (MCS) 的真正概念
MetaBands M4
Vahidreza Heidar Gholami
3.5 (6)
MetaBands使用强大且独特的算法绘制通道并检测趋势,以便为交易者提供进出交易的潜在点。它是一个通道指标和强大的趋势指标。它包括不同类型的通道,可以通过使用输入参数简单地合并以创建新通道。MetaBands使用所有类型的警报通知用户市场事件。 功能 支持大多数通道算法 强大的趋势检测算法 能够合并不同类型的通道 多时间帧和多货币(信号矩阵) 所有类型的警报功能(声音、屏幕闪烁、推送通知、电子邮件、弹出窗口、箭头) 它永远不会重绘 趋势检测 MetaBands使用在通道内振荡的蓝色线来检测趋势。当该线遇到通道的上界时,表明开始下跌趋势,当它遇到下界时,表明开始上涨趋势。如果蓝线接近中线,则市场处于整理期。 该指标使用独特的方法来检测趋势。一开始可能看起来有些复杂,但如果您观看视频教程,您就会意识到它是多么强大且易于使用。 入场和出场信号 当趋势变化或价格穿过上下通道时,MetaBands会立即通过不同的方法提醒交易者,这些方法可以在指标设置中启用。 信号矩阵 要监视来自不同时间框架的多个符号并在一个地方查看信号,请单击右上角按钮或按键盘上的M键以打开信号矩阵。该矩阵可以快速概览
Genesis Matrix Pro is a professional multi-timeframe trend detection indicator designed to help traders identify high-quality market alignment with clarity and structure. It combines 12 different technical indicators into one visual alignment matrix, allowing traders to quickly see when market conditions are bullish, bearish, or neutral. A signal is generated only when the selected strategies are aligned, helping reduce noise and improve decision-making. PLEASE CONTACT ME AFTER PURCHASE TO GET
本产品已针对 2026 年市场进行更新,并针对最新 MT5 版本进行了优化。 价格更新通知: Smart Trend Trading System 目前价格为 $99 。 接下来的 30 次购买 后,价格将上涨至 $199 。 特别优惠: 购买 Smart Trend Trading System 后,请发送私信给我,即可免费领取 Smart Universal EA ,并将您的 Smart Trend 信号转换为自动交易。 Smart Trend Trading System 是一套完整的交易系统,具备不重绘、不回绘、不延迟的特点,专为希望获得更清晰信号、更准确趋势方向以及更有组织交易方式的交易者打造。 Online course , manual and download presets . 它将 10 多种交易工具 整合到一个系统中,包括趋势检测、反转区域、Smart Cloud、移动止损逻辑、支撑与阻力、K线着色、提醒以及多周期分析。 该系统旨在帮助您应对不同的市场环境: 趋势市场: 识别主要趋势,发现回调,跟随动能,并通过止损指导和移动止损选项寻找更清晰的入场机会。 震荡
Dynamic Forex28 Navigator
Bernhard Schweigert
4.43 (7)
Dynamic Forex28 Navigator - 下一代外汇交易工具。 当前 49% 折扣。 Dynamic Forex28 Navigator 是我们长期流行的指标的演变,将三种功能合二为一: 高级货币强度 28 指标 (695 条评论)+ 高级货币 IMPULSE 带警报 (520 条评论)+ CS28 组合信号(奖励)。 有关指标的详细信息 https://www.mql5.com/en/blogs/post/758844 下一代强度指标提供什么? 您喜欢的原始指标的一切,现在通过新功能和更高的精度进行了增强。 主要特点: 专有货币强度公式。  所有时间范围内的平滑和准确的强度线。 非常适合识别趋势和精确进入。 动态市场斐波那契水平(市场斐波那契)。  此指标独有的独特功能。 斐波那契应用于货币强度,而不是价格图表。 适应实时市场活动以获得准确的反转区域。 实时市场动量。  第 9 行显示市场是活跃还是被动。 对于定时交易至关重要。 全面的警报和显示。  每种货币最强的买入和卖出动量。 ​​28 对的双重动量买入和卖出。 超买/超卖警告外部范围和止损。 反转
BTMM State Engine Pro MT4
Garry James Goodchild
BTMM State Engine Pro is a MetaTrader 4 indicator for traders who use the Beat The Market Maker approach: Asian session context, kill zone timing, level progression, peak formation detection, and a multi-pair scanner from a single chart. It combines cycle state logic with a built-in scanner dashboard so you do not need the same tool on many charts at once. What it does Draws the Asian session range; session times can follow broker server offset or be set in inputs. Tracks level progression (L
IQ FX Gann Levels
INTRAQUOTES
5 (2)
IQ FX Gann Levels a precision trading indicator based on W.D. Gann’s square root methods . It plots real-time, non-repainting support and resistance levels to help traders confidently spot intraday and scalping opportunities with high accuracy. William Delbert Gann (W.D. Gann) was an exceptional market analyst, whose trading technique was based on a complex blend of mathematics, geometry, astrology, and ancient mathematics which proved to be extremely accurate. Setup & Guide:  Download  MT5 Ver
PRO Renko System
Oleg Rodin
5 (30)
PRO Renko Arrow Based System for trading renko charts.  准确的信号交易任何外汇工具. 另外,我将免费提供系统的附加模块! PRO Renko系统是RENKO图表上高度准确的交易系统。该系统是通用的。 该交易系统可应用于各种交易工具。 该系统有效地中和了所谓的市场噪音,打开了获得准确反转信号的通道。 该指标易于使用,只有一个参数负责产生信号。 您可以很容易地使算法适应您感兴趣的交易工具和renko酒吧的大小。 我很乐意通过提供任何咨询支持来帮助所有客户有效地使用该指标。 祝您交易成功!购买后,立即写信给我! 我将与您分享我的建议和我的renko发电机。 另外,我将免费提供系统的附加模块!
Neo Wave PRO
Nikolay Raykov
5 (1)
Price & Time Market Structure Indicator A professional market structure tool that analyzes waves through both price and time — not price alone. Main Description NeoWave PRO is a professional market structure indicator for MetaTrader 4 designed for traders who want to move beyond traditional one-dimensional wave tools such as ZigZag, swing indicators, and basic high/low systems. Most wave indicators analyze only one thing: Price. But a real market wave is not only a price movement. A true wave de
GOLD Impulse with Alert
Bernhard Schweigert
4.67 (12)
这个指标是我们2个产品 Advanced Currency IMPULSE with ALERT  +   Currency Strength Exotics 的一个超级组合。 它适用于所有时间框架,并以图形方式显示8种主要货币和一种符号的强势或弱势冲动! 该指标专门用于显示任何符号的货币强度加速,如黄金、异国货币对、商品、指数或期货。这是它的第一个指标,任何符号都可以被添加到第9行,以显示黄金、白银、石油、DAX、US30、MXN、TRY、CNH等的真实货币强度加速(冲动或速度)。 建立在新的基础算法上,它使识别和确认潜在的交易更加容易。这是因为它以图形方式显示了一种货币的强势或弱势是否正在加速,并测量了这种加速的速度--把它想象成你汽车中的速度表。当你加速时,事情显然会发生得更快,这在外汇市场上也是一样的,即如果你配对的货币正在向相反的方向加速,你就会发现一个潜在的有利可图的交易。 动态市场斐波那契28水平被用作警报触发器,将适应市场活动。如果冲动击中黄色触发线,你将收到警报。然后你就知道作为一个交易员应该做什么。货币对和方向已经给出。只需点击警报按钮,就可以切换到该货
Market Structure Order Block Dashboard MT4 是一款 MetaTrader 4 指标, 专为希望直接在图表上解读市场结构和主要价格反应区域的交易者设计。它结合了 BOS、ChoCH、Order Blocks、Fair Value Gaps (FVG)、流动性、Kill Zones、Volume Profile 和紧凑的仪表盘, 便于快速分析。 本指标面向使用市场结构、ICT 和 Smart Money 概念作为决策框架的交易者。它有助于以更结构化的方式识别趋势延续、可能的反转、价格不平衡、流动性目标和关注区域。 买家专属资源 购买后通过 MQL5 私信即可获取完整的 PDF 用户指南和参数设置建议。通过 MQL5 私信提供直接技术支持。 此 MT4 版本涵盖 MT5 1.20 版本的全部功能: Pending BOS / Pending ChoCH 检测 、 可拖动仪表盘 (按住标题栏可将面板拖到图表任意位置)、 多周期面板 、 Order Block 绩效统计 和 自动风险回报区 。Pending Breaks 在 K 线收盘越过前一摆动点的瞬
另有 MT5 版本可供选择 https://www.mql5.com/zh/market/product/170916 M30/H1/H4 波段版已上线 想抓住M5/M15无法捕捉的大行情? Gold Signal Swing Pro(M30/H1/H4)现已发售。 目标每笔$20-$80+。 https://www.mql5.com/en/market/product/177643 KURAMA GOLD SIGNAL PRO(MT4版)— 7层过滤器、自动TP/SL、品质评分搭载 XAUUSD完整交易系统 不重绘。不重画。不延迟。每个信号永久固定。所见即所得。 福利:购买买断版许可证可免费获得 AI Zone Radar(价值$59)+ 完整PDF手册。购买后请给我发消息。 AI Zone Radar: https://www.mql5.com/en/market/product/175834 交易员的信赖:已被活跃的黄
PZ 123 Pattern
PZ TRADING SLU
1 (1)
123模式 是最受欢迎,功能强大和灵活的图表模式之一。该模式由三个价格点组成:底部,峰值或谷值以及38.2%至71.8%之间的斐波纳契回撤位。当价格突破最后一个峰值或谷值时,该形态被认为是有效的,此时指标绘制箭头,发出警报并可以进行交易。 [ 安装指南 | 更新指南 | 故障排除 | 常见问题 | 所有产品 ] 清除交易信号 可自定义的颜色和尺寸 实施绩效统计 可定制的斐波那契回撤水平 显示适当的止损和获利水平 该指标可用于查找连续或反转形态 它是不可重涂和不可重涂的 它实现了电子邮件/声音/视觉警报 123模式 可以表现为连续或反转模式。为了简化操作,该指标使您可以选择要寻找哪种类型的形态,使其成为趋势或反转交易者的绝佳工具。 设置 将指标加载到任何图表时,将显示一组选项作为输入参数。如果您认为它们太多,请不要感到失望,因为参数被分组为不言自明的块。这就是每个参数块的作用。 幅度-幅度表示替代价格点之间的最小柱线量。要找到大图案,请增加幅度参数。要查找较小的模式,请减小幅度参数。 闵。回撤-形态中所需的最小斐波那契回撤。设置为零不对其进行评估。 最大。回撤-形态中可能的最大斐
Enigmera
Ivan Stefanov
5 (8)
ENIGMERA: 市场的核心 重要提示:MQL5.com 演示版本在策略测试器中运行,可能无法完全反映 Enigmera 的功能。请查看描述、截图和视频了解详细信息。如有任何问题,请随时联系我! 该指标的代码已完全重写。版本 3.0 增加了新功能并修复了自指标发布以来积累的错误。 简介 这个指标和交易系统是金融市场的一种独特方法。ENIGMERA 使用分形周期来精确计算支撑和阻力水平。它展示了真实的积累阶段,并提供了方向和目标。无论是在趋势中还是在修正中,这个系统都能工作。 它是如何工作的 指标的大部分功能通过图表左侧的按钮控制,使得能够快速响应不同的市场情况。 按钮 ON/OFF – 显示或隐藏整个指标。 Channel – 激活支撑通道,显示可接受的偏差范围。 Dev1 (第一偏差) – 指示价格在支撑偏差内的波动,信号表示市场正在整合或积累力量。 Dev2 (第二偏差) – 显示价格在偏差之间的波动,表示趋势形成和方向。 Dev3 (第三偏差) – 表示趋势的显著加速和高波动性。 45deg (45度) – 显示市场的节奏和相对于 45 度线的运动稳定性。 Tgt1/2
Harmonic Pattern Plus MT4
Young Ho Seo
4.44 (18)
Introduction Harmonic Patterns are best used to predict potential turning point. Traditionally, Harmonic Pattern was identified manually connecting peaks and troughs points in the chart. Manual harmonic pattern detection is painfully tedious and not suitable for everyone. You are often exposed under subjective pattern identification with manual pattern detection. To avoid these limitations, Harmonic Pattern Plus was designed to automate your harmonic pattern detection process. The functionality
地震仪 市场地震探测器。 Description in English : https://www.mql5.com/en/market/product/113869?source=Site+Market+Product+Page#description How to use the Seismograph : https://www.mql5.com/en/market/product/113869#!tab=comments&page=2&comment=52806941 Create an EA : https://www.mql5.com/en/market/product/113869#!tab=comments&page=3&comment=52816509 无论您以何种方式交易,您都绝对希望避免进入低流动性市场。 然而,即使你确保在应该繁忙的市场时间进入,事实是许多人经常被困在流动性低的市场中。 经过几个小时的等待,市场突然变得繁忙起来,但是......事实证明,现在很多人都站在了与市场相反的方向上。 如果人们不得不等待浮动负数需要很长时间,甚至人们不得不止
Scalper Vault
Oleg Rodin
5 (37)
Scalper Vault 是一个专业的剥头皮系统,为您提供成功剥头皮所需的一切。该指标是一个完整的交易系统,可供外汇和二元期权交易者使用。推荐的时间范围是 M5。 该系统为您提供趋势方向的准确箭头信号。它还为您提供顶部和底部信号以及江恩市场水平。无论您拥有何种交易经验,该系统都易于使用。您只需要遵循简单的规则并每天重复该过程。 建议将此系统用于主要货币对。感谢您的关注! 请注意,该指标在策略测试器中可能无法正常工作。因此,我建议仅在模拟或真实账户的真实交易条件下使用该系统。 指示器提供所有类型的警报,包括推送通知。 购买指标后请与我联系。我将免费与您分享我的个人交易建议和出色的奖励指标! 祝您交易愉快,盈利!
Delta Fusion Pro
Francesco Secchi
5 (2)
Delta Fusion Pro – 高级订单流分析,专为日内交易设计 Delta Fusion Pro 是一款专业的 MetaTrader 4 指标,能够揭示市场中的主动订单流,实时显示机构压力的强度和方向。与传统的成交量指标不同,它分析买盘(Ask)与卖盘(Bid)之间的成交量差值(Delta),用于提前预测反转、确认趋势并识别专业兴趣区域。 主要特点 智能自动调节系统 根据以下条件自动调整所有参数: 交易品种类型(外汇、加密货币、指数、大宗商品、股票) 操作周期 市场波动率(ATR) 最近平均成交量 无需手动配置,适合新手交易者——指标自动完成校准! 核心功能 净Delta与累计Delta 计算主动买盘/卖盘成交量差值,支持自定义 EMA 平滑 实时显示方向性压力 可自定义直方图颜色(买入/卖出) 价格/成交量背离 自动检测常规与隐藏背离 强度分类:强/中/弱 高级过滤:成交量确认、趋势、时间距离 图形信号(彩色箭头) 市场失衡 识别显著的买盘/卖盘比例失衡(可配置比率) 最小成交量阈值验证 图表显示彩色点(多头/空头) Infusion Volume 检测异常成交量峰值(
Trend Lines PRO
Roman Podpora
5 (1)
TREND LINES PRO 帮助您了解市场真正的方向转变点。该指标显示真实的趋势反转点以及主要参与者重新入场的时机。 您可以看到 BOS线、 趋势变化和更高时间框架的关键水平——无需复杂的设置或不必要的干扰。信号不会重绘,并在K线收盘后仍然保留在图表上。 VERSION MT 5    -   与……搭配使用时,可发挥其最大潜力   RFI LEVELS PRO 指示器 该指标显示的内容: 实际变化 趋势(BOS 线) 一旦信号出现,它就始终有效!这与会重绘的指标有着重要的区别,后者可能会发出信号后又改变信号,从而导致资金损失。现在,您可以更精准、更准确地进入市场。此外,还有一个功能,会在箭头出现后为K线着色,直到达到目标价位(止盈)或出现反转信号为止。 重复条目   以及主要玩家的充值 为了提高寻找入场点时的视觉清晰度,我们创建了一个模块,该模块首先显示买入/卖出区域,并在该区域内寻找最佳入场点。此外,我们还加入了智能逻辑来管理止损位,该逻辑会随着时间的推移逐步降低止损位的大小,从而降低入场交易时的初始风险(移动止损位)。 信号强度水平(BOS) 该指标采用三个显著性等级来衡量
The Propfolio Master Suite is the ultimate all-in-one analytical workstation for professional traders. Combining the power of the Beat The Market Maker (BTMM) methodology, Smart Money Concepts (SND/Liquidity), and Advanced Volume Profile, this suite replaces multiple different indicators with one optimized engine. Monitor up to 14 pairs simultaneously from a single chart, instantly identify market cycles, and seamlessly map institutional footprints with the click of a button. The Command Center
RFI levels PRO
Roman Podpora
5 (1)
该指标能够准确显示反转点和价格回落区域。     行业领军人物 。您能洞察新趋势的形成,并以最高的精准度做出决策,掌控每一笔交易。 与……结合时,展现其最大潜力     趋势线专业版   指标  VERSION MT5 该指标显示的内容: 新趋势开始时的反转结构和反转水平及其激活。 显示屏   获利了结   和   止损   风险回报比最低的水平     RR 1:2       。 具有智能减值逻辑的止损。 显示指定指标中两种趋势类型的反转形态。 指标: 根据     趋势线     (全球趋势变化) 潮流专业版     (趋势快速变化) 简单有效   扫描器   实时趋势(新增)。 多时间框架工具筛选。 展示   利润   在 LOGIC AI 信号之后。 以下列出今日走势积极的金融工具。(RB键) 能够为终端启用通知(警报)功能,并向移动设备推送通知。 逻辑人工智能     — 利用人工智能寻找最佳切入点。 只有在启用 MTF(多时间框架分析)模式时,该功能才可用。 兼容性。 当与趋势线指标结合使用时,该指标能发挥其最大潜力。 这     RFI LEVELS PRO    
Advanced Currency IMPULSE with ALERT
Bernhard Schweigert
4.9 (490)
目前40%的折扣!! 对任何新手或专家交易者来说都是最好的解决方案! 这个指标是一个独特的、高质量的、负担得起的交易工具,因为我们已经纳入了一些专有的功能和一个秘密的公式。只需一张图表,它就能给出所有28种货币对的警报。想象一下,你的交易将如何改善,因为你能够准确地确定新趋势或剥头皮机会的触发点 建立在新的基础算法上,它使识别和确认潜在交易变得更加容易。这是因为它以图形方式显示了一种货币的强势或弱势是否正在加速,并测量了这种加速的速度--把它想象成你汽车中的速度表。当你加速时,事情显然会发生得更快,这在外汇市场上也是一样的,即如果你配对的货币正在向相反的方向加速,你就会发现一个潜在的有利可图的交易。 货币动量的垂直线和箭头将指导你的交易! 动态的市场斐波那契23水平被用作警报触发器,将适应市场活动。如果冲动触及黄色触发线,您将在MetaTrader或您的电子邮件或推送警报中收到警报。然后你就知道作为一个交易员应该做什么。货币对和方向已经给出。只要点击警报按钮,就可以切换到该货币对或打开一个新的图表,以便进一步分析。警报级别可以通过用户输入来改变,可以选择3个敏感度级别。 尽
IQ FX Strength  answers the single most important question in trading: "Who is truly driving the market right now?" Designed with a stunning Hybrid UI, this tool separates true trend moves from market noise, allowing you to catch "Explosive" moves before the crowd sees them. System Requirement: For higher accurate signal and optimal, smoother performance of this indicator without any lag, a good CPU (with   RAM of  atleast 8GB or above) and fast internet connection is highly recommended. IQ FX
作者的更多信息
Current event:  https://c.mql5.com/1/326/A2SR2025_NoMusic.gif A. 什么是 A2SR ?   * 这是一个领先的技术指标(没有重绘,没有滞后)。  -  指导 : -- 在  https://www.mql5.com/en/blogs/post/734748/page4#comment_16532516 -- 和  https://www.mql5.com/en/users/yohana/blog A2SR 在确定支撑(需求)和阻力(供应)水平方面有一种特殊的技术。 与我们在网上看到的普通方式不同,A2SR 在确定实际 SR 级别时有一个独创的概念。 原技术不是从网上拿来的,也没有在网上公开过。 A2SR 将根据您的交易风格自动选择 SR 级别。 即使您正在更改时间范围,但 SR 级别仍将保留在其位置上。 因为实际的 SR 不是从你使用的时间范围内获得的。 A2SR 拥有完整的交易工具 。 实际支持(需求)和阻力(供应)的真正概念。 新闻事件和央行讲话的市场情绪。 新闻事件和趋势的主要货币强度 (MCS) 的真正概念
Current event:  https://c.mql5.com/1/326/A2SR2025_NoMusic.gif A2SR MT5 版 指标:自动化实际供需 (S/R)。 + 交易工具。 Product description in English here. --   Guidance   : -- at   https://www.mql5.com/en/blogs/post/734748/page4#comment_16532516 -- and  https://www.mql5.com/en/users/yohana/blog 强大、真实、省时,助您做出更明智的交易决策。 + 兼容 EA 的对象。 主要优势 领先的实际 SR 水平(不滞后,不重绘) 自 2014 年以来,A2SR 在 MT4 平台上经过多年的可靠性验证 ,现已面向 MetaTrader 5 平台推出。 它凭借领先的、不重绘的指标,为交易者带来卓越的优势,帮助他们在价格触及支撑位和阻力位之前识别实际支撑位和阻力位。 A2SR 提前计算支撑位和阻力位——在价格触及支撑位和阻力位之前——让交
地震仪 市场地震探测器。 Description in English : https://www.mql5.com/en/market/product/113869?source=Site+Market+Product+Page#description How to use the Seismograph : https://www.mql5.com/en/market/product/113869#!tab=comments&page=2&comment=52806941 Create an EA : https://www.mql5.com/en/market/product/113869#!tab=comments&page=3&comment=52816509 无论您以何种方式交易,您都绝对希望避免进入低流动性市场。 然而,即使你确保在应该繁忙的市场时间进入,事实是许多人经常被困在流动性低的市场中。 经过几个小时的等待,市场突然变得繁忙起来,但是......事实证明,现在很多人都站在了与市场相反的方向上。 如果人们不得不等待浮动负数需要很长时间,甚至人们不得不止
只交易真正重要的突破。 True Breakouts 是一款高精度 MT5 指标,它使用独有的突破模式来检测真实的市场突破。 这是传统指标所不具备的罕见概念。 Full description in English:   https://www.mql5.com/en/market/product/162325 True Breakouts 通过以下方式识别真正的突破: 独特的专有模式, 提供更高的准确率, 在您的 MT5 图表上直接显示清晰的突破确认信息, 并且可用于 MT5 账户中的所有交易品种。 (外汇、商品、指数、股票、加密货币、债券等) 主要优势: 独有的真正突破模式。 通过真实的市场研究发现的罕见概念,而非重复的逻辑。 比传统方法更高的准确率。 旨在超越市场上常见的突破指标。 清晰的视觉突破线。 直接在图表上即时识别有效的突破区域。 针对真实交易进行优化。 经过不同市场条件和时间框架的测试。 独立、轻量、专注。 纯粹的突破智能,摒弃不必要的复杂性。 配备源自 True Breakout 内置概念的 SR 水平。 True Brea
各位交易员大家好 :) 在 A2SR MT4 和 MT5 产品平台上服务用户 12 年后,现在是时候推出我的旗舰级 EA 产品了: 交易员救星 (TRADER'S SAVIOR)。 新一代黄金剥头皮交易智能交易系统 专为低资金投入实现精准、稳定和持续的卓越表现而设计。 初始资金仅需 300 美元: 2026 ,   2025 ,   2020 - 2026 。 Direct use ,   no need to require a special SET file . Minimum qualifications required for your broker. Account type :   RAW/Raw Spread/Razor of ECN . 交易员救星是一款专为 MetaTrader 5 平台上的 XAUUSD(黄金)交易量量身打造的精准智能交易系统, 针对 M10 时间框架进行了优化,采用高效的剥头皮交易策略。 English description . 限时限量发售 - 抢先体验价 仅限 50 台,以优惠价发售。 每售出 10 台,价格将逐步上涨,直至
Ideally, this is we hope : The good numbers on news should make the related currency become stronger, and the bad numbers on news should make the related currency become weaker. But the fact is: The good numbers on news that has been written on the economic news calendar could not always instantly make the related currency become stronger. and vice versa, the bad numbers could not always instantly make the related currency become weaker. Before placing new position: We need to know which actuall
UEX Reader - 智能交易系统 基于 UEX 指标的全自动交易 EA。 https://www.mql5.com/en/market/product/152936 UEX Reader 提供两种灵活的交易策略: 常规策略和均价策略。 交易仓位可以单独执行,也可以 根据 UEX 指标识别的市场方向同时执行。 尽管 UEX Reader 基于指标运行,但仍可在 MT5 测试器中进行测试。 - - - - - - - - - - - - - - - - - - - - - - - - - - - - - - - - - - - - - - - - - - - - - UEX Reader 智能交易系统使用步骤: https://www.mql5.com/en/market/product/166805/comments PDF document :  https://c.mql5.com/31/1830/UEX_Reader_ExpertAdvisor.zip - - - - - - - - - - - - - - - - - - - - - - - - -
FREE
Semi Automated EA for working as your trading assistant. Overview Trading planner will make you act like professional traders in real markets. Before entering markets, they make a plan for their trades, screening out all opportunities in all time frames. Trading Planner can be used for all Time Frames (M1 ~ MN). Simply draw trendline as a trend and Support/Resistance . At this version , market opportunities will be taken by trendline using strategy of 1, 2, 3 . Simply draw the trendline by defin
What Trades Manager can do for your trades . Collect all order positions into one chart (pict. 1). All orders will be grouped by pair symbol , sum of order positions, lots, running pips, and profit/losses. All orders will be summarized and displayed at the bottom of the panel. You can set target profit, stop loss and placing stop-profit automatically to each order (pict. 4). From one chart, it will be easier to monitor and manage all orders without moving to another chart. The green color is sur
地震仪 市场地震探测器。 Description in English   : https://www.mql5.com/en/market/product/114637 How to use the Seismograph   : https://www.mql5.com/en/market/product/114637#!tab=comments&page=1&comment=52816464 Creating an EA : https://www.mql5.com/en/market/product/114637#!tab=comments&page=1&comment=52816487 无论您以何种方式交易,您都绝对希望避免进入低流动性市场。 然而,即使你确保在应该繁忙的市场时间进入,事实是许多人经常被困在流动性低的市场中。 经过几个小时的等待,市场突然变得繁忙起来,但是......事实证明,现在很多人都站在了与市场相反的方向上。 如果人们不得不等待浮动负数需要很长时间,甚至人们不得不止损或止损,那真的很累。  在阅读产品说明之前,请不要租用它。 阅读说明后,您
* 由于所有主要货币数据的真实性,——建议使用实时图表。 Get   UEX Reader - Expert Advisor   for free: https://www.mql5.com/en/market/product/166805 什么是纯美元欧元指数: 英文说明: https://www.mql5.com/en/market/product/152936 使用纯美元欧元指数,探索外汇市场的真实脉搏 ——这是一个创新指标,能够真正揭示全球两种最强势货币之间隐藏的优势和劣势。 与欧元美元等单一货币对不同,此工具衡量美元和欧元在多个主要货币对中的总体表现 ,从而提供清晰、均衡的真实市场情绪视角。 通过整合所有核心美元和欧元货币对的数据, 此指标构建了同步的指数图表,能够反映真实的货币走势 ——而不仅仅是单一货币对的波动。 当美元占据主导地位、欧元反击时,您将立即看到并收到通知, 并在两者之间的平衡发生变化时获得洞察力,这通常比市场做出反应提前几分钟。 这一概念将成为您应对市场的可靠抓手。 纯美元和欧元指数使交易者能够预测趋势变化, 过滤虚假信号,并根据真实的市场
筛选:
fxloot
211
fxloot 2020.09.12 05:30 
 

nice indicator but no support it seems

Yohana Parmi
11852
来自开发人员的回复 Yohana Parmi 2022.12.24 08:45
Hello, Fyi, 'SR Key Breakout and Jump Levels' is final release and it is a small part of A2SR. No update is needed in the moment. Thank you for your kindness to change your review rating in this product. You may need A2SR for complete trading instruments for real traders. Many thanks.
Cassio Bittencourt
405
Cassio Bittencourt 2020.08.02 15:13 
 

用户没有留下任何评级信息

Frank Paetsch
7501
Frank Paetsch 2020.07.17 03:20 
 

good indicator, thank you Yohana

RalfHornig
186
RalfHornig 2020.06.22 22:20 
 

Hallo Frau Yohanda. Sehr guter Indikator. Könnten sie mir bitte eine Deutsche Erklärung der Linien zukommen lassen. Auch von den Farbigen.Bin ganz frisch in diesem Gewerbe. :-) LG Ralf PS eventuell könnten sie mir was auf die Mailadresse schicken ist vielleicht einfacher für Sie. Vielen Dank im Voraus. Ralf110460@gmail.com

FST
309
FST 2020.06.04 18:34 
 

用户没有留下任何评级信息

Unopiufigo Hugo
26
Unopiufigo Hugo 2020.05.09 16:00 
 

This indicator is good. Just what I need. author also very helpful. 5 stars :)

Abou Azouz
431
Abou Azouz 2020.04.07 01:58 
 

An excellent indicator that deserves really nice support that really deserves five stars

david880
304
david880 2019.05.20 06:23 
 

Excellent indicator. Clear information with accurate level of support and resistance. Highly recommended :)

alden24
187
alden24 2019.04.23 14:39 
 

用户没有留下任何评级信息

jomon davis
774
jomon davis 2019.03.10 18:52 
 

No one could imagine that an indicator would actually do a perfect analysis by without putting pressure on a human mind.

This is something remarkable & credit totally goes to the creator, yohana parmi who have one extra level of IQ,

Kudos to you & the amount of time spent to understand the actual market structure and put it into an indicator, this is the best way you could contribute to struggling traders in terms of humanity. No wonder the world evolved and revolves around a woman. 👏

yinka
101
yinka 2019.02.17 17:58 
 

Excellent indicator...Keep up the good work bro!!! I love this indicator

Bo Chen
674
Bo Chen 2018.12.08 00:15 
 

A good indicator. I used it for a few days and felt very professional. I still have to study. I am going to buy 2 ASR, hoping to help me make a better profit. ! Thanks to the author

maximemagnol
19
maximemagnol 2018.10.11 21:10 
 

用户没有留下任何评级信息

pnutfx503
1529
pnutfx503 2018.04.05 12:49 
 

用户没有留下任何评级信息

Dmitry Karagusov
798
Dmitry Karagusov 2017.04.14 16:46 
 

Один из самых качественных индикаторов, которые мне встречались. Отзывчивый автор. По просьбе добавил нужную мне опцию, хотя индикатор недорогой. Спасибо.

Paulus Nangoy
3545
Paulus Nangoy 2014.09.19 19:33 
 

A great and must have indicator, highly recommended :)

回复评论