Stop Grabber Pattern MT4
- 指标
- 版本: 1.0
- 激活: 15

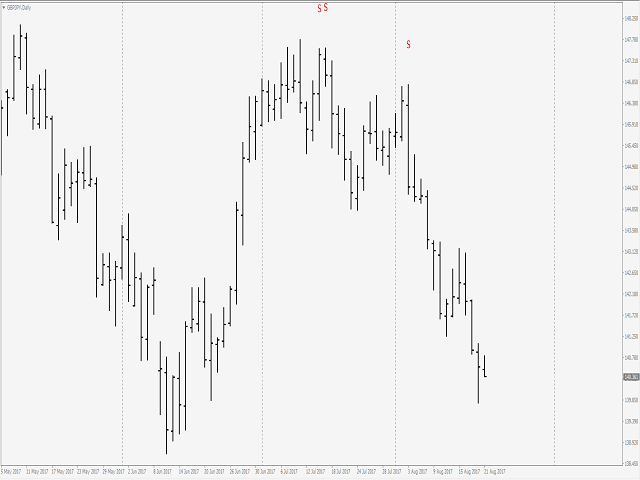
The indicator determines a special pattern of Joe Dinapoli. It gives very high probability buy and sell signals. Indicator does not repaint.
Indicator Usage
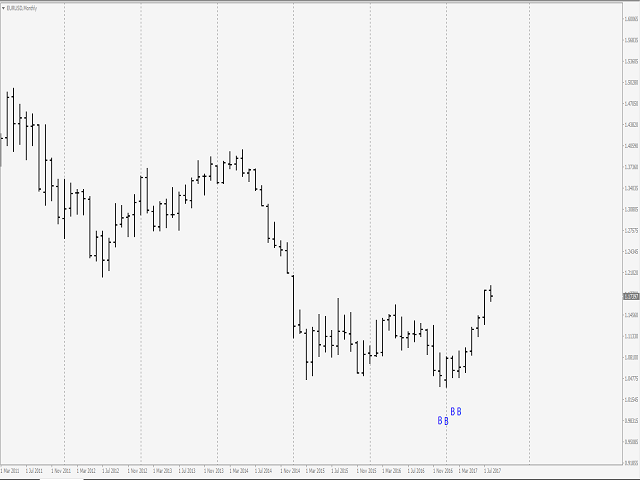
- Buy Signal ''B''
- Entry : Market buy order at signal bar close
- Stop : Low of signal bar
- Take Profit : First swing high
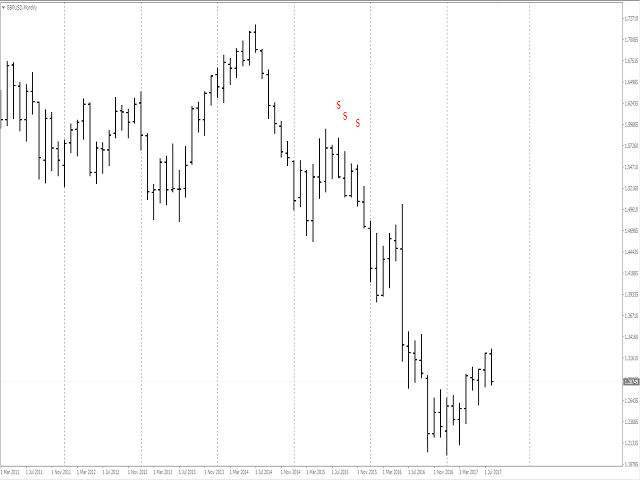
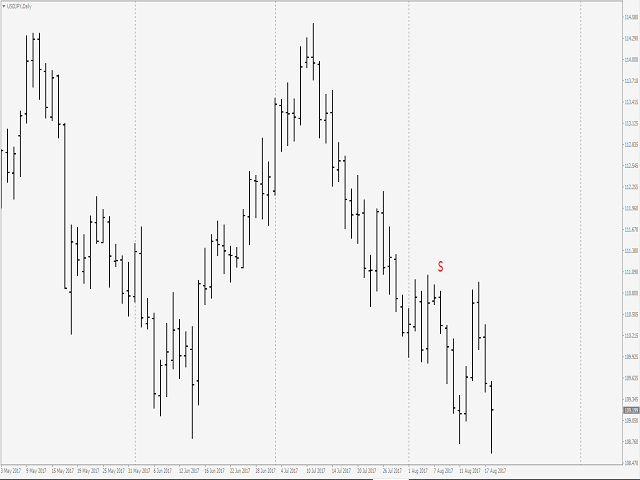
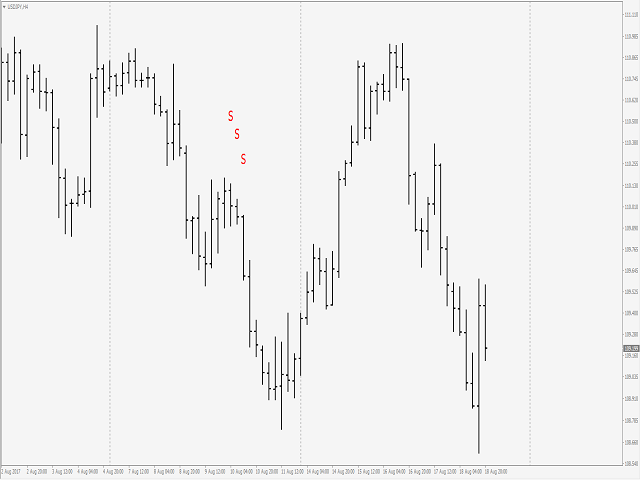
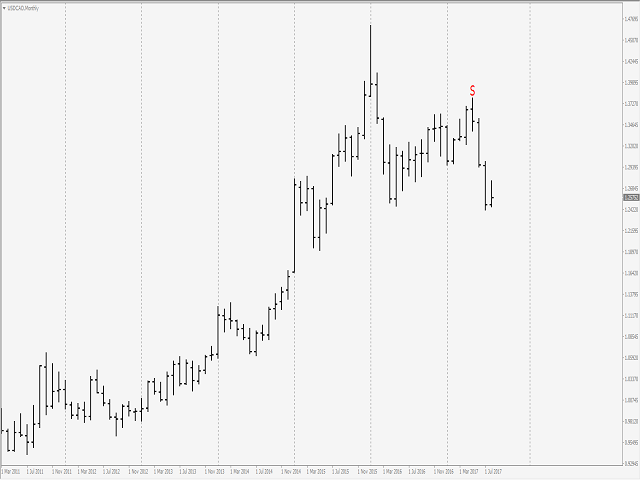
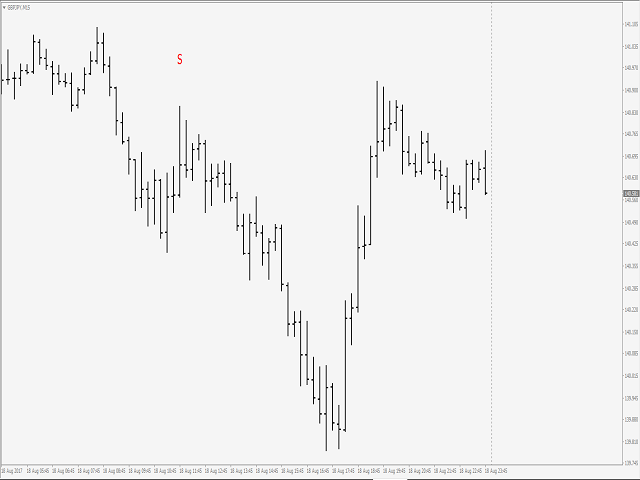
- Sell Signal ''S''
- Entry : Market sell order at signal bar close
- Stop : High of signal bar
- Take Profit : First swing low
Indicator Parameters
- Fast EMA : External Parameter (should be kept as default)
- Slow EMA: External Parameter (should be kept as default)
- Signal EMA: External Parameter (should be kept as default)
- Marker Offset: Adjust display location of signal on chart
- Font Size: Size of signal letter on chart
For MT5 version, please visit ► https://www.mql5.com/en/market/product/52775

用户没有留下任何评级信息