Beginner friendly all in one

Features 

Beginner friendly tools that incorporates one of the most useful indicators into simple and efficient strategy.

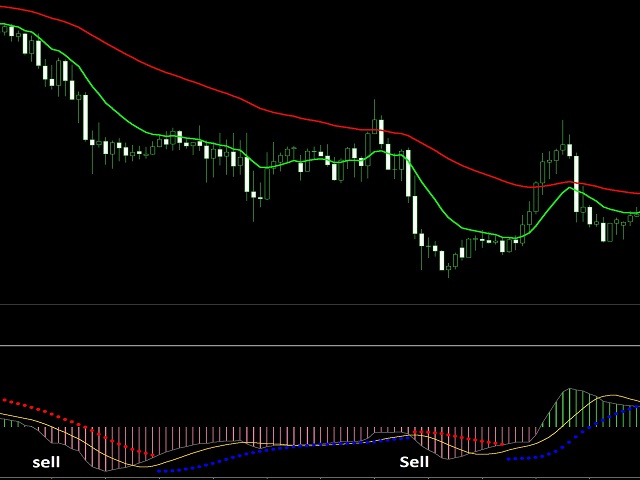
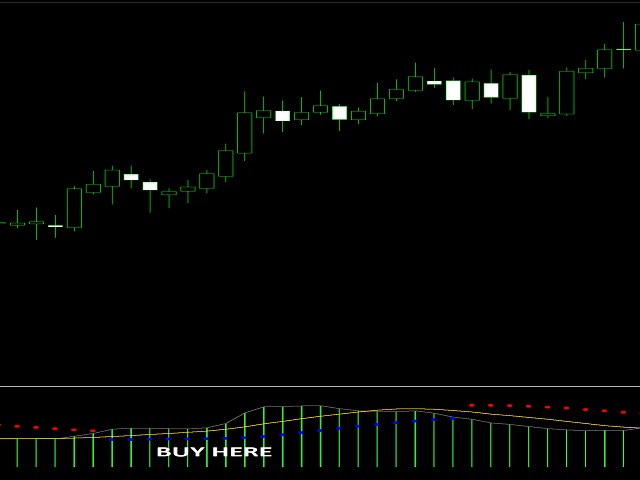
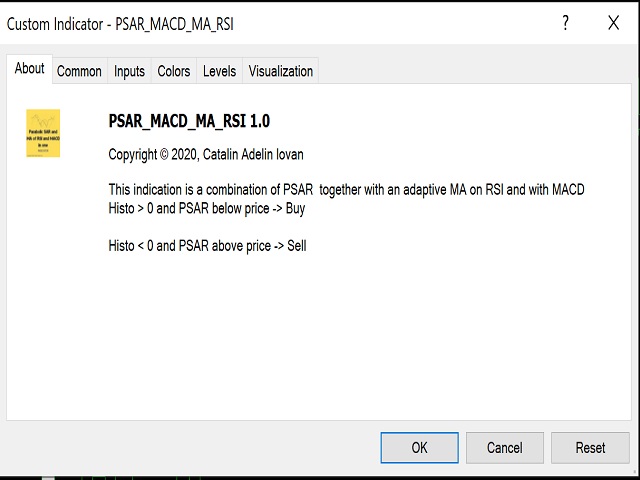
This oscillator merges MA of RSI and parabolic SAR based on MACD values.

Compared to standard parabolic SAR you'll see it is smoother and it seems likely to identify better significant price breaks. You will also have histogram that shows price bias and to assist with making trading decisions based on alignment.


Market to run

It can be adapted to all type of trading styles such as scalping, day trading or swing. It doesn't matter if its forex, stock , crypto and so on. It can be adapted and optimized to all of them.


Contact 

 For any question that you have feel free to let me know


Logo made by https://www.fiverr.com/aleksa19

推荐产品
Pivot levels Auto V1
Hafis Mohamed Yacine
What Is a Pivot Point? A pivot point is a technical analysis indicator, or calculations, used to determine the overall trend of the market over different time frames. The pivot point itself is simply the average of the intraday high and low, and the closing price from the previous trading day. On the subsequent day, trading above the pivot point is thought to indicate ongoing bullish sentiment, while trading below the pivot point indicates bearish sentimen How to Use Pivot Points The very ess
Parabolic SAR Auto Trader EA
Mohammad Khairy Abdul Ghany
Parabolic SAR Auto Trader EA v1.0 is a fully automated trading system for MetaTrader 4 based on the popular Parabolic SAR indicator, designed to follow market trends and capture momentum movements efficiently. This Expert Advisor automatically detects trend reversals using Parabolic SAR signals and executes trades with built-in risk management and trailing stop functionality. Key Features: Fully automated Parabolic SAR trading system Trend-following strategy using SAR reversal signals Fixe
Fibonacci strategies EA trades Fibonacci levels. You can choose whether the EA should trade a manually plotted fibonacci or whether it should automatically plot a fibonacci. In automatic fibonacci drawing mode, the EA automatically plots a fibonacci retracement based on the number of bars you select on the BarsToScan setting in the indicator. The fibonacci is automatically updated in real time as new highest and lowest values appears amongst the selected bars. You can select which level values
I will support only my client. สำหรับลูกค้า Parameters General Trade Settings Money Management  Lot : Fixed (can change) Strategies  - H4 Strategies it is fixed with MA, Bollinger band, Candlestick Levels Close Functions  - H4 Strategies MagicNumber  - individual magic number. The EA will only manage position of the chart symbol with this magic number. NextOpenTradeAfterMinutes  - 15 minutes is default, can change it MaxSpread  - upto currency pairs, MaxSlippage  - upto currency pairs, Push No
Signal Eskiya
Vitalii Zakharuk
Signal Eskiya, in addition to channel lines, reflects entry signals in the form of arrows. Trading strategies using the channel indicator belong to the classic methods of technical analysis, are easy to execute, and therefore available even to beginners. Price ranges work equally well on any trading assets and timeframes, they can be used both independently and with additional confirmation from oscillators and market volumes. American traders say: “Trend is your friend”, which means “Trend is
Super Trend Channels
Muhammed Emin Ugur
Super Trend Channels MT4 Indicator Looking for a versatile and powerful channel indicator for your MetaTrader 4 trading platform? Look no further than the "Super Trend Channels" indicator! This advanced tool is designed to help traders identify trend channels accurately, enabling you to make informed trading decisions with confidence. Key Features: Multi-Channel Support: The "Super Trend Channels" indicator supports multiple channels simultaneously. You can visualize various channel types, inclu
Neuro Poseidon MT4
Daria Rezueva
4.93 (28)
Neuro Poseidon is a new indicator by Daria Rezueva. It combines precise trading signals with adaptive TP/SL levels - creating best possible trades as a result! Message me and get  Neuro Poseidon Assistant  as a gift to automize your trading process! What makes it stand out? 1. Proven profitability on all assets and timeframes 2. Only confirmed BUY and SELL signals present on the chart 3. Adaptive TP & SL levels generated by the software for each trade 4. Easy to understand - suitable for all
Intelligence
Mikhail Rasporskiy
the expert Advisor is an artificial intelligence that uses built-in algorithms to calculate currency support levels and place orders. defined by five main levels support.in in cases of a breakdown of the strongest support, the adviser closes orders and opens an order in the direction of the trend, thereby saving the Deposit from being completely drained. new levels are defined, and the EA starts working. does not use martingale. it works on any timeframe, but preferably 30 minutes. the tes
Euro Gift EurUsd M15
Marek Kupka
3 (5)
Euro Gift (EURUSD M15) I am celebrating my birthday, so i will publish some EAs for FREE. This EA has been developed for EURUSD M15.  Strategy is based on ICHIMOKU indicator and has very little parameters - so its VERY ROBUST. It uses Stop pending orders with   ATR   Stop Loss . At 9:00 pm we are closing trading every Friday to prevent from weekly gaps. !!!Adjust these times to your broker time. Preset values are for UTC+2 only!!! For every candle the pending orders are modified to adapt the mar
FREE
MT4版本: https://www.mql5.com/en/market/product/90395 MT5版本: https://www.mql5.com/en/market/product/99545 隆重推出“No Marti No Party”智能交易系统 (EA):激进交易策略的缩影。 该 EA 不适合胆小的人,因为它遵循高风险、高回报的原则,可能会导致大幅收益或重大损失。 顾名思义,Martingale 策略是该 EA 的核心。 它旨在积极加倍亏损交易,旨在挽回损失并在此过程中获利。 然而,这种方法需要钢铁般的意志和大量的账户余额来承受潜在的回撤。 在考虑使用此 EA 之前,在美分账户(一种资本要求最低的账户类型)上进行广泛测试至关重要。 这使得交易者能够衡量其表现并评估他们是否能够应对其激烈的交易风格。 “No Marti No Party”EA 交易不遵循保守的风险管理规则。 相反,它靠波动性而繁荣,通过快速交易追逐快速利润。 这意味着它可以在短时间内产生可观的回报,但如果市场条件不利,它同样有能力消灭一个账户。 敢于冒险进入“No Marti No Pa
Fibonacci Trend Marker
Grigoriy Malychenko
斐波那契趋势标记 ( Fibonacci Trend Marker ) 是一种趋势指标,通过使用斐波那契回撤水平分析当前K线相对于前几根K线的最高-最低 (HL) 范围的行为。它通过K线颜色的变化,直观地跟踪趋势强度,提示可能的趋势减弱或反转。 特点: 专为趋势交易者设计,帮助基于斐波那契水平快速识别趋势变化。 在市场波动性充足且有3-5根K线形成明显趋势时,适用于任何时间框架。 K线大小自动适应图表比例,确保缩放时显示正确。 对趋势变化的高度敏感性源于对当前K线的实时分析,使其非常适合在M1和M5时间框架上进行剥头皮交易。 如何交易? 入场: 在前一根已关闭的K线颜色变化后开仓。例如,如果一根K线在红色后关闭为蓝色,表明上升趋势—开启买入 (Buy) 交易。 离场: 当前一根K线的颜色反转时平仓,或在达到目标时平仓,例如趋势方向上的1-2根K线,具体取决于市场波动性。 当前(未关闭)K线的颜色会随报价变化而改变,这对剥头皮交易者尤其有用,可在K线完成前提前平仓。 设置: 周期 (Period) — 设置用于计算的前几根K线的数量(例如3、5、10)。 斐波水平 (Fibo
AuroraV5
Ron Fritzhugh Bryan
I could write a fantastic description with lots of quantitative testing parameters but we have a saying that "taste of a pudding is in the eating " so I will simple put a CHALLENGE :Test this EA on any of the major and minor pairs (AUD,USD,EUR,CHF,NZD )and I guarantee you  50% discount if you can prove in a test on any of the major pairs above  that you have incurred  more than 3 error runs. *NOW HAPPY TESTING* Then you get to write the description unhindered!!!!!!!!!!!!!!!!!!!!!!!!!!!!!!!
Pattie Breakout ORB EA
Patrick Jeannot
4.75 (4)
Pattie Opening Range Breakout (ORB) is a range of price variation, which for each session, it generates a combination of support and resistance levels, positioning itself in favor of breaking out of the bands, when it is exceeded on the upside is a signal to buy or enter long and when it is exceeded on the downside it is a signal to sell or enter short. Pattie Break Out  EA  is a specialized trading tool designed to automate  time session-based breakouts . The EA operates by drawing a price rang
NO REPAINT ADVANCED CHART PATTERN INDICATOR By definition, a price ( chart)  pattern is a recognizable configuration of price movement that is identified using a series of  trendlines  and/or curves. When a price pattern signals a change in trend direction, it is known as a reversal pattern; a continuation pattern occurs when the trend continues in its existing direction following a brief pause. Advanced Chart Pattern Tracker is designed to find the MOST ACCURATE patterns. A special script is a
PTW NON REPAINT TRADING SYSTEM + HISTOGRAM Non-Repainting ,   Non-Redrawing   and   Non-Lagging  Trading System. Does the following: - Gives Accurate Entry and Exit Points - Scalping, Day and Swing Trading  - 95% Accuracy  - Targets, where to take profits. - Shows Trends, Support and resistance levels - Works on All Brokers - Works on All Currencies, CFDs and Stocks - It does not place trades for you, it only shows you what trades to place. - It works on All Timeframes - It is for Trend or ran
This is a simple and efficient indicator based on market logic. The indicator creates a range chosen by a trader. Trader selects only two parameters. The first one is the number of candles that define the frame. The second one is the number of candles needed for confirmation frame. The indicator shows all situations in history and works with the actual movement of the market. The indicator works on all timeframes . You are not limited by use of different timeframes, the indicator is able to adap
Global Trend
Vitalii Zakharuk
Global Trend Indicator, shows the signals for entry. Displays both entry points and the trend itself. Shows statistically calculated moments for entering the market with arrows. When using the indicator, the risk factor can be optimally distributed. Settings: Uses all one parameter for settings. Choosing a parameter, it is necessary to visually resemble it so that the appropriate graph has a projection of extremes. Parameters: Length - the number of bars for calculating the indicator. Use
Jobot Basic Martingale
Jakkarin Chinsuwan
This EA can run on every currencies pairs recommend EURUSD, USDJPY, EURJPY, GBPUSD Timeframe 30 Minute (M30) The important advantage of this EA is that you can start to trade with $1000 min imum initial Deposit. And the robot can support your manual transactions on EURUSD. ACCOUNT LEVERAGE: 1:100 ACCOUNT (Stop Out): 50% or less ACCOUNT TYPE: Real account ACCOUNT MODE: Hedging account Take Profit: Automatically Stop Loss: Automatically LOT size: Manual first order
AI Forecast MT4
Leonardo Antonio Camacaro Armas
The "AI Forecast" indicator is the result of a unique experiment in which I asked an AI how to create the best indicator to anticipate the market. The AI suggested measuring the past history of the price and its reactions to different levels, and then calculating the probabilities of the price reaction in the future. With this idea, I designed with the help of another AI the "AI Forecast" indicator, which adapts to any MetaTrader chart and shows you three lines: one for entry and two for possi
Sure Hedging AIEA
Osamudiamen Lambert Osawaru
EnhancedGridAI - Advanced Automated Trading System Comprehensive User Guide & Technical Reference Disclaimer:T rading foreign exchange on margin carries a high level of risk and may not be suitable for all investors. The high degree of leverage can work against you as well as for you. Before deciding to trade foreign exchange, you should carefully consider your investment objectives, level of experience, and risk appetite. The possibility exists that you could sustain a loss of some or all of_
Free automatic fibonacci
Tonny Obare
4.67 (49)
Free automatic Fibonacci is an indicator that automatically plots a Fibonacci retracement based on the number of bars you select on the BarsToScan setting in the indicator. The Fibonacci is automatically updated in real time as new highest and lowest values appears amongst the selected bars. You can select which level values to be displayed in the indicator settings. You can also select the color of the levels thus enabling the trader to be able to attach the indicator several times with differe
FREE
CandleWave
Catalin Zachiu
CandleWave:驾驭金融浪潮 介绍 您是寻求终极优势的交易者吗? CandleWave 就是您的最佳选择,它是您在金融市场不可预测的水域中航行的战略副驾驶。 该专家顾问 (EA) 将日本蜡烛图的古老智慧与现代分析相结合,创造了强大的协同作用,可以 重新定义您的交易游戏。 特征 掌握移动平均线 简单移动平均线 (SMA) 充当您的指南针,引导您度过市场风暴。 无论您是正处于趋势的顶峰还是预期趋势反转,移动平均线都能在混乱中提供清晰的信息。 它的工作原理如下: 趋势趋势:当 SMA 向上倾斜时,表明看涨趋势。 CandleWave 与主流潮流保持一致,让您可以自信地驾驭波浪。 反转点:向下倾斜的移动平均线暗示潜在的趋势反转。 CandleWave 时刻保持警惕,随时准备在风向转变时调整风帆。 连续关闭:冲浪势头 动量捕捉:当两根看涨蜡烛相互跟随时,就像捕捉到强劲的波浪一样。 CandleWave 认识到了这一势头并锁定了利润。 风险缓解:相反,两根看跌蜡烛预示着潜在的损失。 CloseBy2Consec 行动迅速,保护您的资本免受逆流影响。 为什么选择 Ca
I will support only my client. สำหรับลูกค้า Parameters General Trade Settings Money Management  Lot : Fixed (can change) Strategies  - M30 Strategies you can using both it is fixed with MA, Bollinger band, Candlestick Levels Close Functions  - M30 Strategies MagicNumber  - individual magic number. The EA will only manage position of the chart symbol with this magic number. NextOpenTradeAfterMinutes  - 8 minutes is default, can change it MaxSpread  - upto currency pairs, MaxSlippage  - upto cur
黃牛終端介面軟體是一個指標,它不從事自動買賣交易。 此指標顯示當前交易區域,當出現剝頭皮交易機會時可以進入交易。 當出現倒賣訊號時,相關交易對的右側,綠松石色燈亮起,並在其上方寫有確切的交易方向。 之後,點擊綠松石按鈕即可進入交易。 將開啟一個新分頁。 隨後,預計蠟燭收盤,這是進入倒賣交易的條件。 為了透過黃牛終端進行成功的黃牛交易; 請務必觀看說明部分中的影片。 像士兵一樣堅持使用黃牛終端軟體 。 每個交易對的右側有 5M、15M 和 DIRECTION 欄。 首先,點擊“通知”按鈕並將其設為綠色。 您無需一直注視著螢幕。 只需等待綠松石燈訊號或 Metatrader 警報訊息聲音即可。 閱讀上面寫的確切操作方向(也是方向欄文字),它是綠松石色的。 在確切的交易方向上,點擊綠松石按鈕進行倒賣。 在為剝頭皮交易打開的新選項卡中,像獵人一樣等待 pinbar 或吞噬蠟燭關閉。 當 pinbar 或吞沒蠟燭收盤是建倉條件時,按照黃牛終端指示的方向建倉。 在與持倉入場方向相反的一側添加止損單。 (例如,如果是多頭交易,則止損單的位置是最後收盤蠟燭的最低價位。) 然後,將您的止盈訂單新增
Introduction to GARCH Indicator GARCH is the short initial for Generalized Autoregressive Conditional Heteroskedasticity and it is the volatility prediction model commonly used in financial industry. GARCH model was first appeared in the work by Danish Economist, Tim Peter Bollerslev in 1986. The 2003 Nobel Prize winner, Robert F Engle also added much contribution for the refinement of GARCH model with Tim’s work. Our GARCH INM predictor took the original method of Nelder Mead for GARCH model bu
FREE
本指标是实践实战交易完善的波浪自动分析的指标 !  案例... 注: 波浪分级用西方叫法不习惯,因受到缠论(缠中说禅)命名方式习惯的影响,我是将基础波浪命名为 笔 ,将二级波段命名为 段 ,同时具有趋势方向的段命名为 主趋段 (以后笔记中都是这种命名方式,先告知大家),但是算法上和缠论关系不大切勿混淆.反映的是本人分析盘面总结的 千变万化纷繁复杂的运行规律 . 对波段进行了标准化定义,不再是不同人不同的浪  ,   对人为干扰的画法进行了排除,在严格分析进场起到了关键的作用 . 使用这个指标,等于将交易界面提升美感,抛弃最原始的K线交易带你进入新的交易层次.如果不是为了交易,在宣传上也将使客户观感提升层次. 指标内容: 1. 基础波浪 (笔) : 首先我们找出了价格波动过程中的基础波动拐点,当然他的有序性低,为下一步的计算提供基础. 2. 二级波段( 段 ) :在基础波浪的基础上,通过算法分析得到层级更明显的二级波段,二级波段为波浪提供了分析基础 3. 波浪( 浪 ): 有着更清晰的趋势,更清晰直观的方向.分析一个波浪是否延续,需要看二级波段的形态,分析二级的构成,可以得出波浪后
The expert works on the Fibonacci levels on the previous candle With some digital way to enter the deal On the five minute frame Work on currency pairs only Do not use TakeProfit or Stop Loss How the expert works It is placed on the three currency pairs GBPUSD GBPJPY GBP AUD Same settings without changing anything When he works, he will work on only one currency of them until it closes on a profit Profit is only seven points Please watch the video Explains how the expert works. Max Spread = 0.3
Trend Lines
Rohlan Samino
This indicator is suitable for seeing trends and determining the time to open a position. It is equipped with a Stop Loss position. Easy to use. Just watch the arrows provided. Indicator parameters Shift - the number of bars used for the indicator shift to Right." Step Point per Period - the number of pips for down or Up trend lines" Time Frame - Calculate @ this Time Frame." Max_Bar - the number of bars used for calcuulate indicators (if '0' then All bars to calcuulate)." Alert_On - On or Off
Alligator Trader
Ciprian Ghebanoaei
3 (2)
Alligator Trader is a fully automatic, professional trading robot. Designed specifically for the foreign exchange market   USDJPY M30. EA does not need to configure parameters. Ready to work on  USDJPY M30. , You only need to decide on the choice of the lot. It has a smart algorithm which detects the trend, filters out market noise. The expert creates orders on trend direction. Input and output orders are given by a combination of two indicators that can be found on any MT4 platform: Alligator
FREE
Transition Trend
Tatiana Savkevych
The Transition Trend indicator shows the points of potential market reversal. The indicator's smart algorithm detects the trend, filters out market noise and generates entry signals and exit levels. Simple, visual and efficient trend detection. Uses just one parameter for settings. The indicator does not redraw and does not lag. You can set up message alerts as sound or email. Works on all currency pairs and all timeframes. Ready-made trading system.
该产品的买家也购买
Scalper Inside PRO
Alexey Minkov
4.74 (68)
Scalper Inside PRO Scalper Inside PRO 是一款适用于 MetaTrader 4 的日内趋势与剥头皮指标,使用专有算法快速识别市场方向和关键目标价位。它能够自动计算进场价、出场价以及多级止盈目标,并显示详细的绩效统计,让您了解不同交易品种和策略以往的表现情况,从而帮助您为当前的市场环境选择最合适的交易工具。此外,您还可以将自己的箭头指标轻松接入 Scalper Inside PRO,快速评估其统计数据和历史表现。 该指标可用于任何交易品种和任何周期(建议在 M5 上进行日内交易),并内置多种交易策略,因此既可以作为独立的剥头皮工具使用,也可以作为您交易系统中功能强大的分析组件。 主要功能 通过专有算法(Next‑Generation Trend Detection Algorithm,NG TDA)快速识别当前市场趋势。 自动计算日内交易的进场价、出场价和多级止盈目标。 内置策略与统计模块,用于评估不同市场环境下各品种的表现。 支持接入自定义箭头指标(PRO 模式),并计算其详细信号统计数据。 适用于外汇、金属、指数、股票、商品、期货和加密货币等各类市
Dynamic Forex28 Navigator
Bernhard Schweigert
4.43 (7)
Dynamic Forex28 Navigator - 下一代外汇交易工具。 当前 49% 折扣。 Dynamic Forex28 Navigator 是我们长期流行的指标的演变,将三种功能合二为一: 高级货币强度 28 指标 (695 条评论)+ 高级货币 IMPULSE 带警报 (520 条评论)+ CS28 组合信号(奖励)。 有关指标的详细信息 https://www.mql5.com/en/blogs/post/758844 下一代强度指标提供什么? 您喜欢的原始指标的一切,现在通过新功能和更高的精度进行了增强。 主要特点: 专有货币强度公式。  所有时间范围内的平滑和准确的强度线。 非常适合识别趋势和精确进入。 动态市场斐波那契水平(市场斐波那契)。  此指标独有的独特功能。 斐波那契应用于货币强度,而不是价格图表。 适应实时市场活动以获得准确的反转区域。 实时市场动量。  第 9 行显示市场是活跃还是被动。 对于定时交易至关重要。 全面的警报和显示。  每种货币最强的买入和卖出动量。 ​​28 对的双重动量买入和卖出。 超买/超卖警告外部范围和止损。 反转
Enigmera
Ivan Stefanov
5 (8)
ENIGMERA: 市场的核心 重要提示:MQL5.com 演示版本在策略测试器中运行,可能无法完全反映 Enigmera 的功能。请查看描述、截图和视频了解详细信息。如有任何问题,请随时联系我! 该指标的代码已完全重写。版本 3.0 增加了新功能并修复了自指标发布以来积累的错误。 简介 这个指标和交易系统是金融市场的一种独特方法。ENIGMERA 使用分形周期来精确计算支撑和阻力水平。它展示了真实的积累阶段,并提供了方向和目标。无论是在趋势中还是在修正中,这个系统都能工作。 它是如何工作的 指标的大部分功能通过图表左侧的按钮控制,使得能够快速响应不同的市场情况。 按钮 ON/OFF – 显示或隐藏整个指标。 Channel – 激活支撑通道,显示可接受的偏差范围。 Dev1 (第一偏差) – 指示价格在支撑偏差内的波动,信号表示市场正在整合或积累力量。 Dev2 (第二偏差) – 显示价格在偏差之间的波动,表示趋势形成和方向。 Dev3 (第三偏差) – 表示趋势的显著加速和高波动性。 45deg (45度) – 显示市场的节奏和相对于 45 度线的运动稳定性。 Tgt1/2
Trend Lines PRO
Roman Podpora
5 (1)
TREND LINES PRO 帮助您了解市场真正的方向转变点。该指标显示真实的趋势反转点以及主要参与者重新入场的时机。 您可以看到 BOS线、 趋势变化和更高时间框架的关键水平——无需复杂的设置或不必要的干扰。信号不会重绘,并在K线收盘后仍然保留在图表上。 VERSION MT 5    -   与……搭配使用时,可发挥其最大潜力   RFI LEVELS PRO 指示器 该指标显示的内容: 实际变化 趋势(BOS 线) 一旦信号出现,它就始终有效!这与会重绘的指标有着重要的区别,后者可能会发出信号后又改变信号,从而导致资金损失。现在,您可以更精准、更准确地进入市场。此外,还有一个功能,会在箭头出现后为K线着色,直到达到目标价位(止盈)或出现反转信号为止。 重复条目   以及主要玩家的充值 为了提高寻找入场点时的视觉清晰度,我们创建了一个模块,该模块首先显示买入/卖出区域,并在该区域内寻找最佳入场点。此外,我们还加入了智能逻辑来管理止损位,该逻辑会随着时间的推移逐步降低止损位的大小,从而降低入场交易时的初始风险(移动止损位)。 信号强度水平(BOS) 该指标采用三个显著性等级来衡量
KT Alpha Hunter Arrows MT4
KEENBASE SOFTWARE SOLUTIONS
大多数箭头指标只给你一个信号,然后把剩下的判断全部留给你自己。KT Alpha Hunter Arrows 给你的,是一套完整的交易计划。 每一个信号箭头出现时,图表上都会同时绘制完整计划:入场线、止损位、四个止盈目标,以及实时 Edge 结论,告诉你当前品种和时间周期是否值得交易。套装中还包含 Trade Manager EA,在你手动入场后负责后续执行,让你在市场波动和情绪干扰下依然保持纪律。非重绘。只在K线收盘后给出信号。适用于 Forex、黄金、指数,以及你交易的其他任何品种。 核心功能 非重绘买入和卖出箭头,只在K线收盘后出现。 每个信号都带有入场线、结构性止损和四个止盈目标。 Edge Dashboard 会分别评估当前图表上的买入和卖出机会。 结论系统:No Edge、Marginal、Tradeable、Good 或 Strong。 一键 Auto Optimize 按钮,可根据当前品种和时间周期自动调整设置。 完整套装包含 Trade Manager EA,并内置五种专为本指标设计的交易管理方案。 Prop Firm Risk Panel 可在图表上实时追踪日内回撤
PZ Trend Trading
PZ TRADING SLU
4.8 (5)
许多盈利交易者不仅知道如何识别市场趋势,而且也能把握趋势建立后的交易机会。 Pz 趋势交易 指标设计用来在趋势行情中尽可能的赚取利润。 已建立的趋势提供了一揽子交易机会,但大多数趋势交易指标完全忽视了它们,让交易者在趋势行情时完全不知道该如何做!一般趋势指标只通知有关的趋势变化,但根本不足以得到卓越的回报. Pz 趋势交易 指标比一般趋势指标显示多达 20 倍的交易 , 因为它注重所谓的市场时机。它不仅显示当前的市场趋势,也有回调,内柱线的突破和调整。它令您在趋势回调之后介入,安全的柱线内突破金字塔加仓,以及发现潜在的反转,和已知的调整。 趋势改变 一个趋势改变在市场方向变化时发生。趋势变化在图表上用带数字的彩色圆圈显示。蓝色 (1) 信号为上涨开始, 而红色 (1) 信号为下跌开始。趋势变化并非评估当前价格动作的结果, 它意味着交易设置是不定时地。如果您正确使用本指标, 在趋势变化时, 您将将已经入场 (参看下面的调整)。 回调 但凡趋势在运动中,行情上下抖动,盈利者收割利润,且其它参与者入场。趋势回调代表好的买入机会,通常是由主力获利离场导致。如果行情在回调后回归上行, 指标将
Step into the world of Forex trading with confidence, clarity, and precision using   Gold Indicator   a next-generation tool engineered to take your trading performance to the next level. Whether you’re a seasoned professional or just beginning your journey in the currency markets, Gold Indicator equips you with powerful insights and help you trade smarter, not harder. Built on the proven synergy of three advanced indicators, Gold Indicator focuses exclusively on medium and long-term trends eli
MetaBands M4
Vahidreza Heidar Gholami
3.5 (6)
MetaBands使用强大且独特的算法绘制通道并检测趋势,以便为交易者提供进出交易的潜在点。它是一个通道指标和强大的趋势指标。它包括不同类型的通道,可以通过使用输入参数简单地合并以创建新通道。MetaBands使用所有类型的警报通知用户市场事件。 功能 支持大多数通道算法 强大的趋势检测算法 能够合并不同类型的通道 多时间帧和多货币(信号矩阵) 所有类型的警报功能(声音、屏幕闪烁、推送通知、电子邮件、弹出窗口、箭头) 它永远不会重绘 趋势检测 MetaBands使用在通道内振荡的蓝色线来检测趋势。当该线遇到通道的上界时,表明开始下跌趋势,当它遇到下界时,表明开始上涨趋势。如果蓝线接近中线,则市场处于整理期。 该指标使用独特的方法来检测趋势。一开始可能看起来有些复杂,但如果您观看视频教程,您就会意识到它是多么强大且易于使用。 入场和出场信号 当趋势变化或价格穿过上下通道时,MetaBands会立即通过不同的方法提醒交易者,这些方法可以在指标设置中启用。 信号矩阵 要监视来自不同时间框架的多个符号并在一个地方查看信号,请单击右上角按钮或按键盘上的M键以打开信号矩阵。该矩阵可以快速概览
PZ Swing Trading
PZ TRADING SLU
5 (3)
Swing Trading 是第一个旨在检测趋势方向的波动和可能的反转波动的指标。它使用在交易文献中广泛描述的基准摆动交易方法。该指标研究多个价格和时间向量,以追踪总体趋势方向,并检测市场超卖或超买并准备好进行修正的情况。 [ 安装指南 | 更新指南 | 故障排除 | 常见问题 | 所有产品 ] 市场波动的利润不会被窃取 指示器始终显示趋势方向 彩色价格带代表机会基准 彩色虚线表示可能的反转波动 该指标分析其自身的质量和性能 它实现了一个多时间仪表板 可定制的趋势和波动周期 它实现了电子邮件/声音/推送警报 指示器为非重涂或重涂 什么是摇摆交易 摇摆交易是一种尝试在一天到一周内从证券中获得收益的交易方式,尽管某些交易最终可以保持更长的寿命。摇摆交易者使用技术分析来买入弱点和卖出力量,并有耐心等待这些机会的发生,因为在发生一波抛售浪潮之后购买证券而不是陷入抛售更有意义。 机会基准 关于历史数据的大量研究证明,适合于波动交易的市场倾向于在基线价格带上下交易,基线价格带由图表显示,使用平均真实区间计算得出。波动交易者使用基线,该策略是购买常态和卖出躁狂,或做空常态并掩盖沮丧。在没有疲
Current event:  https://c.mql5.com/1/326/A2SR2025_NoMusic.gif A. 什么是 A2SR ?   * 这是一个领先的技术指标(没有重绘,没有滞后)。  -  指导 : -- 在  https://www.mql5.com/en/blogs/post/734748/page4#comment_16532516 -- 和  https://www.mql5.com/en/users/yohana/blog A2SR 在确定支撑(需求)和阻力(供应)水平方面有一种特殊的技术。 与我们在网上看到的普通方式不同,A2SR 在确定实际 SR 级别时有一个独创的概念。 原技术不是从网上拿来的,也没有在网上公开过。 A2SR 将根据您的交易风格自动选择 SR 级别。 即使您正在更改时间范围,但 SR 级别仍将保留在其位置上。 因为实际的 SR 不是从你使用的时间范围内获得的。 A2SR 拥有完整的交易工具 。 实际支持(需求)和阻力(供应)的真正概念。 新闻事件和央行讲话的市场情绪。 新闻事件和趋势的主要货币强度 (MCS) 的真正概念
M30/H1/H4 波段版已上线 想抓住M5/M15无法捕捉的大行情? Gold Signal Swing Pro(M30/H1/H4)现已发售。 目标每笔$20-$80+。 https://www.mql5.com/en/market/product/177643 KURAMA GOLD SIGNAL PRO(MT4版)— 7层过滤器、自动TP/SL、品质评分搭载 XAUUSD完整交易系统 不重绘。不重画。不延迟。每个信号永久固定。所见即所得。 福利:购买买断版许可证可免费获得 AI Zone Radar(价值$59)+ 完整PDF手册。购买后请给我发消息。 AI Zone Radar: https://www.mql5.com/en/market/product/175834 交易员的信赖:已被活跃的黄金交易员社区使用。因精度和易用性获得赞誉。 你的问题 — 以及解决方案 你知道黄金每天波动$30-50。你知道这里有钱可赚。但是: - 入场过早,价格反向$10后才朝你的方向走 -
BTMM State Engine Pro MT4
Garry James Goodchild
BTMM State Engine Pro is a MetaTrader 4 indicator for traders who use the Beat The Market Maker approach: Asian session context, kill zone timing, level progression, peak formation detection, and a multi-pair scanner from a single chart. It combines cycle state logic with a built-in scanner dashboard so you do not need the same tool on many charts at once. What it does Draws the Asian session range; session times can follow broker server offset or be set in inputs. Tracks level progression (L
Dynamic Scalper System
Vitalyi Belyh
5 (1)
“ Dynamic Scalper System ”指标专为在趋势波内进行剥头皮交易而设计。 已在主要货币对和黄金上进行测试,并可与其他交易工具兼容。 提供顺势短线建仓信号,并提供额外的价格变动支持。 指标原理: 大箭头决定趋势方向。 在趋势波内,我们采用一种生成小箭头形式的剥头皮交易信号的算法。 红色箭头代表看涨方向,蓝色箭头代表看跌方向。 敏感的价格变动线会沿着趋势方向绘制,并与小箭头信号协同作用。 信号运作方式如下:当线在适当时刻出现时,将形成入场信号;在出现线时,持仓;线完成后,平仓。 建议的操作时间范围为M1 - H4。 箭头在当前K线上方形成,如果下一根K线已开仓,则不会重新绘制上一根K线上方的箭头。 输入参数 Trend Wave Period - 趋势方向(大箭头)的周期,改变趋势波的时间间隔。值 1 表示趋势方向的最长持续时间,参数值越大,持续时间越短。 Scalper Arrows Period - 信号箭头(小箭头)的计算周期,改变入场信号的生成频率。值 3 表示最频繁的生成频率,参数值越大,箭头频率越低,准确度越高。 这些参数可以根据不同的时间范
Neo Wave PRO
Nikolay Raykov
Price & Time Market Structure Indicator A professional market structure tool that analyzes waves through both price and time — not price alone. Main Description NeoWave PRO is a professional market structure indicator for MetaTrader 4 designed for traders who want to move beyond traditional one-dimensional wave tools such as ZigZag, swing indicators, and basic high/low systems. Most wave indicators analyze only one thing: Price. But a real market wave is not only a price movement. A true wave de
Quant Direction
Georgios Kalomoiropoulos
Quant Direction 是一款三维市场分析工具。它通过同时计算多个维度上的精确百分比偏差,提供完全客观的、基于算法的市场分析视角。该算法采用先进的人工智能建模工具开发,并经过全面测试,旨在以独特的精准度解读市场。它可以分析您平台上的任何货币对或金融工具。 无论您是短线 交易者、日内 交易者还是波段交易者,Quant Direction 都是您的理想之选。 交易者的真正优势 Quant Direction 的真正优势在于彻底消除情绪、屏幕疲劳和过度思考。它无需手动点击十几个图表来寻找方向并反复质疑自己的偏好,引擎即可在几毫秒内即时处理 8 个时间周期(从 5 个月到月线)。它能准确告诉你任何时刻谁在掌控市场,确保你始终朝着概率最高的方向进行交易。 市场分析的三个维度 该算法将市场分为三个不同的交易维度,为您提供完整的宏观和微观视角: 超短线交易分析: 捕捉即时、快速的动量变化和较低时间框架的执行点。 日内分析: 识别真实的、潜在的每日方向性偏差。 波动分析: 专注于宏观趋势,确保您不会与大盘机构的走势背道而驰。 独家评分引擎 Quant Direction 的底层采用了一套
MonsterDash Harmonic Indicator
Paul Geirnaerdt
4.54 (26)
MonsterDash Harmonic Indicator is a harmonic pattern dashboard. It recognizes all major patterns. MonsterDash is a dashboard that displays all detected patterns for all symbols and (almost) all timeframes in sortable and scrollable format. Users can add their own user defined patterns . MonsterDash can open and update charts with the pattern found. Settings MonsterDash's default settings are good enough most of the time. Feel free to fine tune them to your needs. The color settings are for thos
RFI levels PRO
Roman Podpora
5 (1)
该指标能够准确显示反转点和价格回落区域。     行业领军人物 。您能洞察新趋势的形成,并以最高的精准度做出决策,掌控每一笔交易。 与……结合时,展现其最大潜力     趋势线专业版   指标  VERSION MT5 该指标显示的内容: 新趋势开始时的反转结构和反转水平及其激活。 显示屏   获利了结   和   止损   风险回报比最低的水平     RR 1:2       。 具有智能减值逻辑的止损。 显示指定指标中两种趋势类型的反转形态。 指标: 根据     趋势线     (全球趋势变化) 潮流专业版     (趋势快速变化) 简单有效   扫描器   实时趋势(新增)。 多时间框架工具筛选。 展示   利润   在 LOGIC AI 信号之后。 以下列出今日走势积极的金融工具。(RB键) 能够为终端启用通知(警报)功能,并向移动设备推送通知。 逻辑人工智能     — 利用人工智能寻找最佳切入点。 只有在启用 MTF(多时间框架分析)模式时,该功能才可用。 兼容性。 当与趋势线指标结合使用时,该指标能发挥其最大潜力。 这     RFI LEVELS PRO    
The Propfolio Master Suite is the ultimate all-in-one analytical workstation for professional traders. Combining the power of the Beat The Market Maker (BTMM) methodology, Smart Money Concepts (SND/Liquidity), and Advanced Volume Profile, this suite replaces multiple different indicators with one optimized engine. Monitor up to 14 pairs simultaneously from a single chart, instantly identify market cycles, and seamlessly map institutional footprints with the click of a button. The Command Center
KuKl
IGOR KIRIANEN
The indicator is built on a non-standard Zig Zag, it draws accumulations after which if the price leaves this zone and a test of this zone occurs, then a sound signal is given and an arrow appears - after the test candle closes.The indicator does not redraw its signals, it is very easy to use, there are only three settings 1- this is the zig zag parameter 2- this is the minimum price exit from the zone 3- this is the maximum price exit from the zone. The lower the parameter for Zig Zag, the more
NAM Order Blocks
NAM TECH GROUP, CORP.
3.67 (3)
MT4多時限訂單塊檢測指示器。 特徵 -在圖表控制面板上完全可自定義,提供完整的交互。 -隨時隨地隱藏和顯示控制面板。 -在多個時間範圍內檢測OB。 -選擇要顯示的OB數量。 -不同的OB用戶界面。 -OB上的不同過濾器。 -OB接近警報。 -ADR高低線。 -通知服務(屏幕警報|推送通知)。 概括 訂單塊是一種市場行為,它指示從金融機構和銀行收取訂單。著名的金融機構和中央銀行帶動了外匯市場。因此,交易者必須知道他們在市場上正在做什麼。當市場建立訂單塊時,它會像發生大多數投資決策的範圍一樣移動。 訂單建立完成後,市場將朝著上升和縮小的方向發展。訂單大宗交易策略的關鍵術語是它包括機構交易者正在做的事情。由於它們是主要的價格驅動因素,因此包括機構交易在內的任何策略都可以。 您將在任何時間範圍內實時看到訂單塊,使用我們的控制面板,您將能夠在所選的歷史記錄週期內檢測常規,拒收和未大寫的訂單塊。 現在您可以接收到訂單塊接近警報,我們在MT4上顯示屏幕通知,並將通知推送到您的手機!
PZ Harmonacci Patterns
PZ TRADING SLU
3.17 (6)
可以说,这是您可以为MetaTrader平台找到的最完整的谐波价格形成自动识别指标。它检测19种不同的模式,像您一样认真对待斐波那契投影,显示潜在的反转区域(PRZ),并找到合适的止损和获利水平。 [ 安装指南 | 更新指南 | 故障排除 | 常见问题 | 所有产品 ] 它检测19种不同的谐波价格形态 它绘制了主要,衍生和互补的斐波那契投影(PRZ) 它评估过去的价格走势并显示每个过去的形态 该指标分析其自身的质量和性能 它显示合适的止损和获利水平 它使用突破来表明合适的交易 它在图表上绘制所有样式比率 它实现了电子邮件/声音/视觉警报 受斯科特·M·卡尼(Scott M. Carney)的书的启发,该指标旨在满足最纯粹和最熟练的交易者的需求。但是,它采取了一种使交易更容易的方式:在向交易发出信号之前,它会等待Donchian朝正确方向突破,从而使交易信号非常可靠。 斐波那契投影与向量无关 它实现了电子邮件/声音/推送警报 它绘制了ABCD投影 重要提示: 为了符合 Scott M. Carney先生 的商标申诉,某些图案名称已重命名为不言自明的替代方式, Scott M.
Smart Price Action Concepts
Issam Kassas
4.77 (13)
本产品已针对 2026 年市场进行更新,并针对最新 MT5 版本进行了优化。 价格更新通知: Smart Price Action Concepts 目前价格为 $200 。 接下来的 30 次购买 后,价格将上涨至 $299 。 特别优惠: 购买后,请发送私信给我,即可领取 免费赠品 + 礼物 。 首先需要强调的是,这款交易工具是不重绘、不回绘、不延迟的指标,因此非常适合专业交易使用。 Online course , and manual Smart Price Action Concepts 指标是一款非常强大的工具,适合新手和有经验的交易者使用。它将 20 多个实用指标整合到一个系统中,结合了 Inner Circle Trader Analysis 和 Smart Money Concepts Trading Strategies 等高级交易理念。该指标专注于 Smart Money Concepts,帮助交易者理解大型机构如何交易,并辅助预测其市场行为。 它特别擅长流动性分析,使交易者更容易理解机构交易逻辑。它也非常适合预测市场趋势并仔细分析价格走势。通过让交易与机构策略保
GoldRush Trend Arrow Signal
Kirk Lee Holloway
5 (2)
GoldRush 趨勢箭頭信號 GoldRush 趨勢箭頭信號 指標為 XAU/USD 中的高速、短期短線交易者提供精確、實時的趨勢分析。 專為1分鐘時間框架設計,此工具顯示方向箭頭以明確顯示入場點,使短線交易者能在波動市場中自信操作。 該指標包含主要和次要警示箭頭。主要信號為白色和黑色方向箭頭,用於指示趨勢方向的轉變;次要信號為藍色和紅色箭頭,用於確認主要箭頭指示的方向並提示潛在交易入場點。 注意:當趨勢方向發生變化後僅出現一個主要警報箭頭時,請注意可能會出現多個次要藍/紅箭頭。次要信號將在滿足信號標準的任何蠟燭圖後出現,因此在長期趨勢移動中,螢幕上將顯示大量次要箭頭(如附帶的截圖所示)。您可在設置中開啟或關閉任一箭頭類型。 以下是我使用此指標進行交易的方式: - 對於買入入場,我會耐心等待白箭頭在蠟燭收盤時出現,並在下一根可用蠟燭收盤時出現藍箭頭時進行買入交易。 - 對於賣出入場,我會耐心等待黑箭頭在蠟燭收盤時出現,並在下一根可用蠟燭收盤時出現紅箭頭時進行賣出交易。 - 獲利了結/止損設置由使用者自行負責,但我個人使用最低R:R為1:2,並發現這在倫敦/紐約開盤等
Introduction to Fractal Pattern Scanner Fractal Indicator refers to the technical indicator that makes use of the fractal geometry found in the financial market. Fractal Pattern Scanner is the advanced Fractal Indicator that brings the latest trading technology after the extensive research and development work in the fractal geometry in the financial market. The most important feature in Fractal Pattern Scanner is the ability to measure the turning point probability as well as the trend probabi
Cycle Sniper
Elmira Memish
4.39 (36)
Please contact us after your purchase and we will send you the complimentary indicators to complete the system Cycle Sniper is not a holy grail but when you use it in a system which is explained in the videos, you will feel the difference. If you are not willing to focus on the charts designed with Cycle Sniper and other free tools we provide, we recommend not buying this indicator. We recommend watching the videos about the indiactor and system before purchasing. Videos, settings  and descri
Non repaint signal indicator
Marrion Netondo Wabomba
MV Arrow– Professional Swing Signal Indicator comment for set files and user manual. MV Arrow v4.0 is a precision-based MT4 arrow indicator designed to identify high-probability swing BUY and SELL zones using a multi-filter confirmation system. It focuses on market extremes , filtering noise and low-quality signals to deliver clear, well-spaced trade opportunities . This indicator is ideal for traders who prefer clean charts, disciplined entries, and confirmation-based signals rather than co
GOLD Impulse with Alert
Bernhard Schweigert
4.67 (12)
这个指标是我们2个产品 Advanced Currency IMPULSE with ALERT  +   Currency Strength Exotics 的一个超级组合。 它适用于所有时间框架,并以图形方式显示8种主要货币和一种符号的强势或弱势冲动! 该指标专门用于显示任何符号的货币强度加速,如黄金、异国货币对、商品、指数或期货。这是它的第一个指标,任何符号都可以被添加到第9行,以显示黄金、白银、石油、DAX、US30、MXN、TRY、CNH等的真实货币强度加速(冲动或速度)。 建立在新的基础算法上,它使识别和确认潜在的交易更加容易。这是因为它以图形方式显示了一种货币的强势或弱势是否正在加速,并测量了这种加速的速度--把它想象成你汽车中的速度表。当你加速时,事情显然会发生得更快,这在外汇市场上也是一样的,即如果你配对的货币正在向相反的方向加速,你就会发现一个潜在的有利可图的交易。 动态市场斐波那契28水平被用作警报触发器,将适应市场活动。如果冲动击中黄色触发线,你将收到警报。然后你就知道作为一个交易员应该做什么。货币对和方向已经给出。只需点击警报按钮,就可以切换到该货
Quants HL Break
Ferhat Mutlu
5 (2)
通過純價格行為進行高級計算,以找到 LH 和 HL 突破。 它會給你一個很好的市場反轉點。 LH 和 HL 信號也可用於 traingle 突破。 一旦突破發生,則表明強烈反轉。 移動平均線的漂亮過濾器。 我強烈建議將其與趨勢指標一起使用。 可用作支撐和阻力、供需指標的額外確認。 可以在以下外匯線程中找到更多詳細信息: 該指標未重新繪製。 Buffers :   SetIndexBuffer ( 0 ,UpBar);      SetIndexBuffer ( 1 ,UpBar2);           SetIndexBuffer ( 2 ,DnBar);      SetIndexBuffer ( 3 ,DnBar2);           SetIndexBuffer ( 4 ,UpBarTop);      SetIndexBuffer ( 5 ,UpBarLow);                    SetIndexBuffer ( 6 ,DnBarTop);      SetIndexBuffer ( 7 ,DnBarLow);           SetIn
MR Volume Profile 4
Sergey Khramchenkov
The "MR Volume Profile 4" indicator is a charting tool that displays trading volume at different price levels rather than time intervals. A key concept in volume profile is the point of control (POC)—the price level with the highest volume traded during the session or time range. While tools like VWAP or OBV provide volume trends, the "MR Volume Profile 4" indicator offers granular detail about where the most market activity occurs at specific price levels. This makes it a more precise tool for
Kinetic Trend
Alexandr Lapin
5 (1)
Автор: Александр Лапин --- Описание: Kinetic Trend — уникальный индикатор, основанный на математической модели затухания кинетической энергии цены. Он строит три независимые инерционные линии (основную, реверсную и зеркальную), а также отображает адаптивные зоны отклонения и их пересечения. Индикатор не использует стандартные индикаторы, такие как Moving Average или RSI, и предлагает абсолютно новый способ визуализации тренда и силы движения. --- ️ Что делает индикатор: Три инерц
作者的更多信息
Have you ever wanted a system which contains all major indicators together as a whole? Instead of dozens of strategies, why not use one that contains all of them, and can be run as a whole or individually? Well, now it's your chance to have it , because I am very glad to bring you one of my best creations : ALL IN ONE  Expert Advisor Features  This EA its a all in one strategy. It has a multiple combination of all major indicators that can be used separately or together as a whole, to make a
All in one MA cross
Catalin Adelin Iovan
All moving averages in one strategy Have you ever wanted a simple and efficient strategy that actually works?  Well, now it's your chance to have it , because I am very glad to bring you another of my best creations : ALL in one MA CROSS This EA its an all in one strategy. It contains all types of moving averages that can be modified together with a risk management plan. If you want the indicator only , here it is : https://www.mql5.com/en/market/product/54184#!tab=overview Features  The wa
All moving averages in one indicator Have you ever wanted an indicator which contains all types of moving averages and show you when they cross?  And at the same time works on all timeframes and it's very simple to configure? Well, now it's your chance to have it , because I am very glad to bring you another of my best creations : ALL in one MA indicator This indicator is the base indicator used for this strategy. https://www.mql5.com/en/market/product/54168#!tab=overview Features  The w
The five guardians
Catalin Adelin Iovan
The five guardians This indicator is a combination of the next indicators, each with their own settings. CCI MACD ADX DMI STOCHASTIC When all five of them align with the same movement we get a green color which represents the buy movement , and contrary we have a red color which represents a sell movement. If its gray, its undecided, and we have to wait until a better signal will appear. Logo made by  https://www.fiverr.com/aleksa19
Features  A n indicator will be given if we have a break on high volume. Up Arrow Volume> Average_Volume * Multiplier Price> Highest Price for Last N candle, plus set, Pip / Percentage Value Down Arrow Volume> Average_Volume * Multiplier Price <Lowest Price for Last N candle, minus set, Pip / Percentage Value Market to run It can be adapted to all type of trading styles such as scalping, day trading or swing. It doesn't matter if its forex, stock , crypto and so on. It can be adapted an
DMI ADX Histogram Oscillator I present you one of the most precise and powerful indicator Its made of DMI Histogram together with ADX Oscillator. It has inside arrow to show a buy or sell setup. Features  The way it works its the next one : the histogram is a difference between DMI+ and DMI-.   At the same time together we have the oscillator ADX for Market to run It can be adapted to all type of trading styles such as scalping, day trading or swing. It doesn't matter if its forex, stock ,
Description An amazing and effcient scalper, suited for all types of accounts. Its designed especially for EURUSD 15min chart. No martingale, no extra risk, none of that gambling stuff that can destroy your account. Its a plug and play strategy, meaning that you dont have to modify anything, except the input value of the lots. Strategy : Its made of multiple averages combinations EMA,SMMA, SMA, applied to different candles : closes/ hl2 / hl3 . In general it always enter at the beginning of
EURUSD 5min scalper
Catalin Adelin Iovan
Features An amazing scalper created for EURUSD 5 min time frame, with very low risk and high reward at the same time. After more than 500h of optimization I am glad to present you this EA . It was made in mind for IC markets MQL5 platform, an adapted for their data, but I suppose it must works on other brookers as well. I will also publish soon the MT4 version for IC markets as well. Link to 1 min scalper  https://www.mql5.com/en/market/product/54413 Description Strategy is made from ADX togeth
EURUSD 1min scalper
Catalin Adelin Iovan
Features An amazing scalper created for EURUSD 1 min time frame. Compared to the 5 min version https://www.mql5.com/en/market/product/54412#!tab=overview , this one is a higher risk/ reward . Just like the 5 min version, this one needed more than 500h of optimization . It was made in mind for IC markets MQL5 platform, an adapted for their data, but I suppose it must works on other brookers as well. I will also publish soon the MT4 version for IC markets as well. Description Strategy is made fro
筛选:
无评论
回复评论