IVolX 2 DPOC
- 指标
- 版本: 2.0
- 激活: 5

Vol2DPOC volume
vol2DOC-任何时间段的动态水平音量指indicator
指标的主要设置:
- 交易量来源-为交易量选择数据(tick或real)
- DPOCOn-启用/禁用指标
- DPOCFrom-计算开始日期
- DPOCTo-结算结束日期
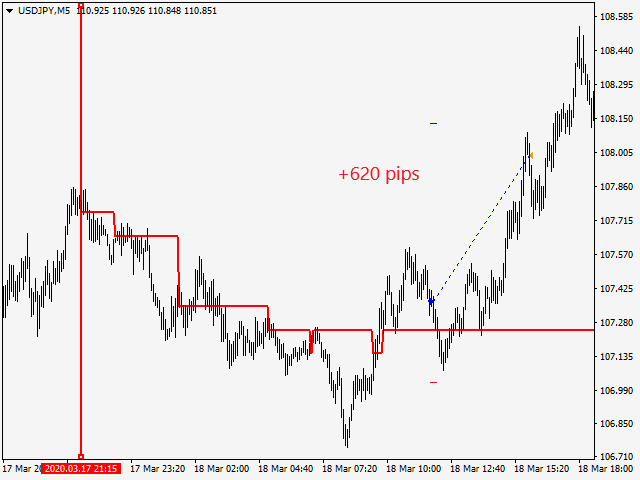
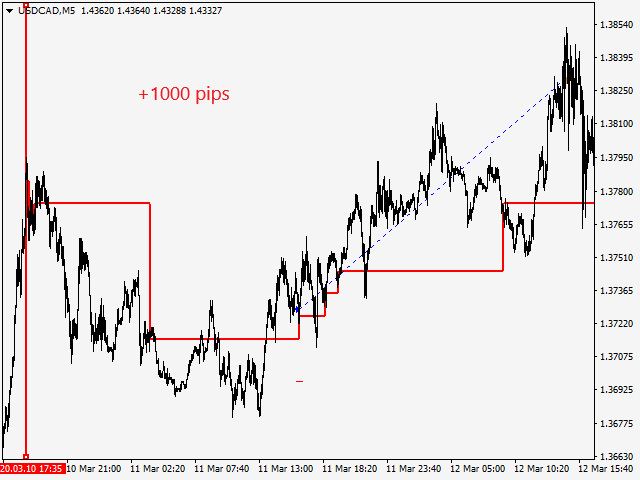
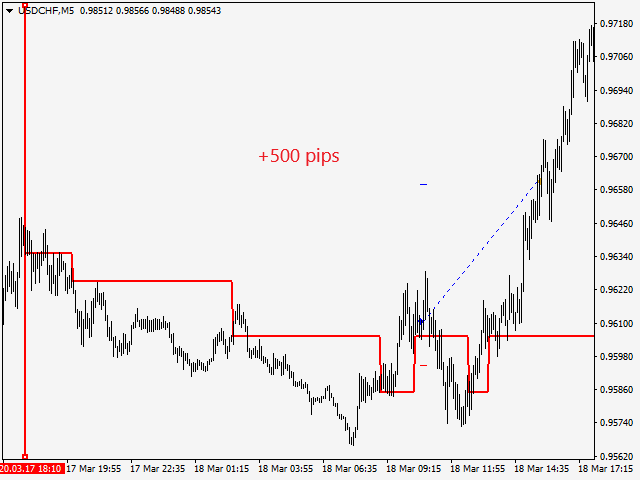
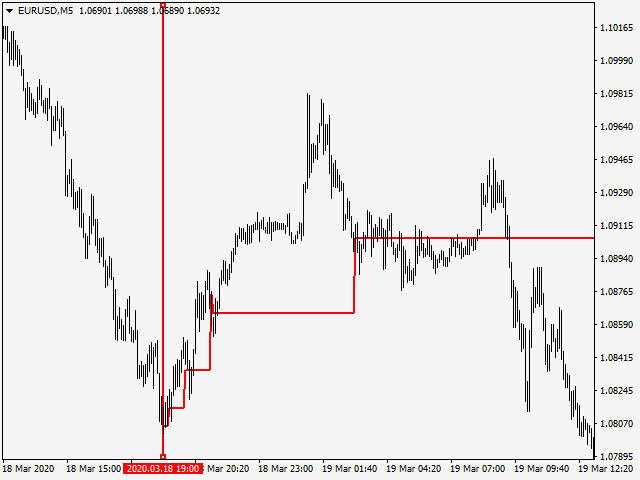
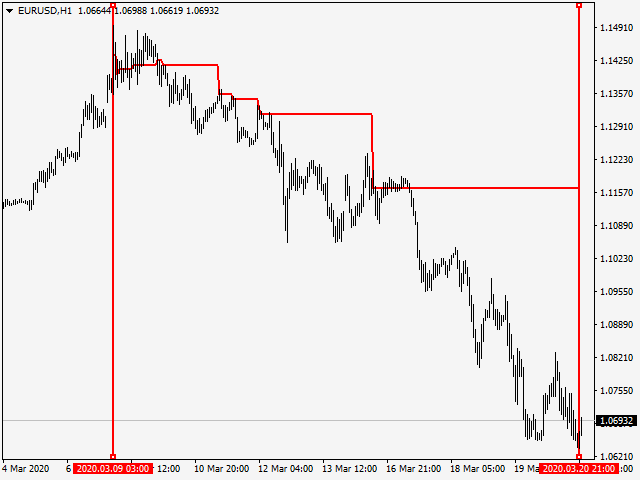
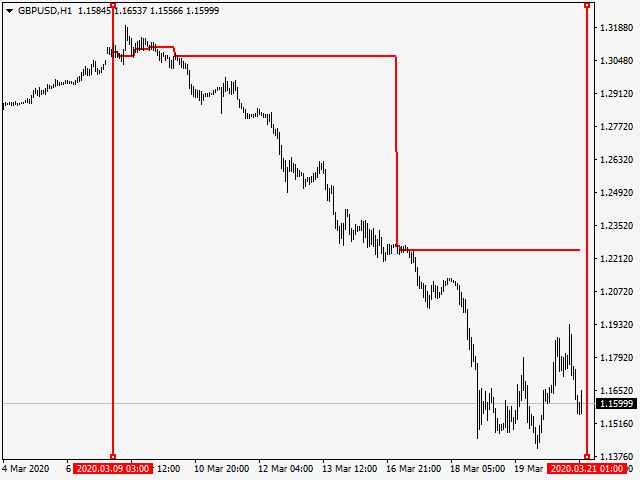
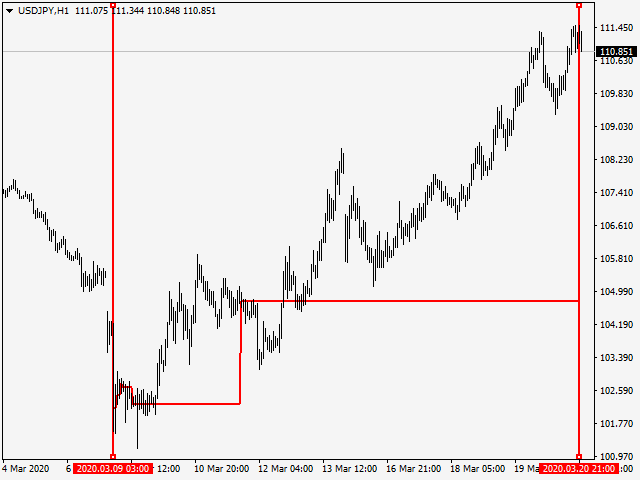
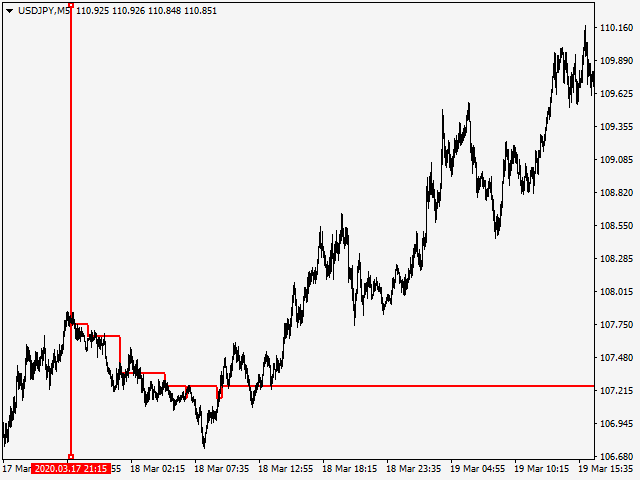
该指标允许您手动选择图表上的区域,以分析最大交易量随时间的变化。
您可以通过使用垂直线并沿图表移动它们来执行此操作。 或者通过在指标设置中设置特定日期。
这是一个非常有用的指标,以更精确地确定价格何时离开修正并恢复趋势运动。
该指标显示3个缓冲区,以便指标可以连接到ea交易。
该指标与水平交易量指标IVolX和其他趋势工具一起,将帮助您显着增加有利可图的交易数量,并将您的交易提升到一个全新的水平!
指标的主要设置:
- 交易量来源-为交易量选择数据(tick或real)
- DPOCOn-启用/禁用指标
- DPOCFrom-计算开始日期
- DPOCTo-结算结束日期
该指标显示3个缓冲区,以便指标可以连接到ea交易。
该指标与水平交易量指标IVolX和其他趋势工具一起,将帮助您显着增加有利可图的交易数量,并将您的交易提升到一个全新的水平!