Variable Moving Average VMA
- 指标
-
Chidera Anakpe
 Over a decade ago, I discovered forex trading. I was instantly fascinated by it, while trading and learning new techniques, hours seemed like minutes and days seemed like hours. I soon discovered the greatest risk to a trader is not the strategy but managing emotions. Emotional trading was behind
 - 版本: 1.1
- 更新: 4 十二月 2019
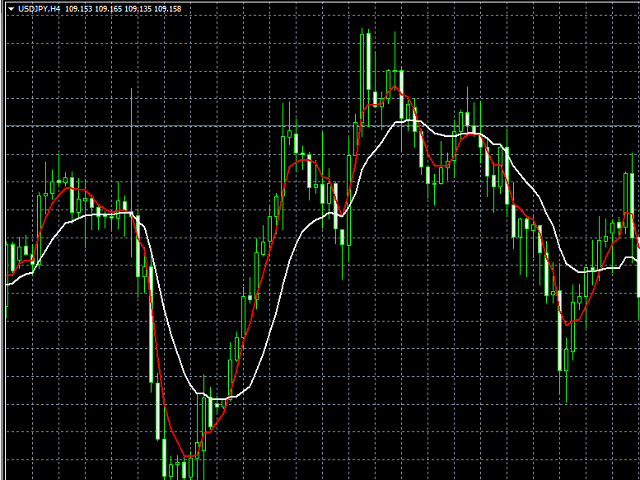
The VMA is an exponential moving average that adjusts its smoothing constant on the basis of market volatility. Its sensitivity grows as long as
the volatility of the data increases. Based on the Chande's Momentum Oscillator, the VMA can automatically adjust its smoothing period as
market conditions change, helping you to detect trend reversals and retracements much quicker and more reliable when compared to
traditional moving averages.
Très bon indicateur.