

Features:
- Price Kumo Breakout
- Tenkan-Kijun Cross
- Chikou/CLoud and Chikou/Price
- Support/Resistance (SR-SS or SR-NRTR)
- Stochastic OB/OS and back
- Awesome Oscillator
- Higher Timeframe Ichimoku Trend Align
Ichimoku Strategies Guide:
This post contains the extra Metatrader 4 indicators for mql5.com Market product:
Ichimoku Scanner Dashboard
available here:
https://www.mql5.com/en/market/product/41711
Try demo:
- Abiroid_Scanner_Ichimoku_demo.ex4
Demo works for 3 pairs. And contains all functionality of the actual scanner. So you can try it before buying
NRTR For Chart:
- NRTR_Rosh_Abiroid.ex4
Please note:
I won’t be able to add new settings. It already has 72 settings
Some people are using it with their EAs. And iCustom function can only take Max 64 settings.
So, I cannot let it grow any further.I’ll definitely be maintaining the code and solving issues. Don’t worry
Please check all settings in demo strategy tester before buying.
Product Description:
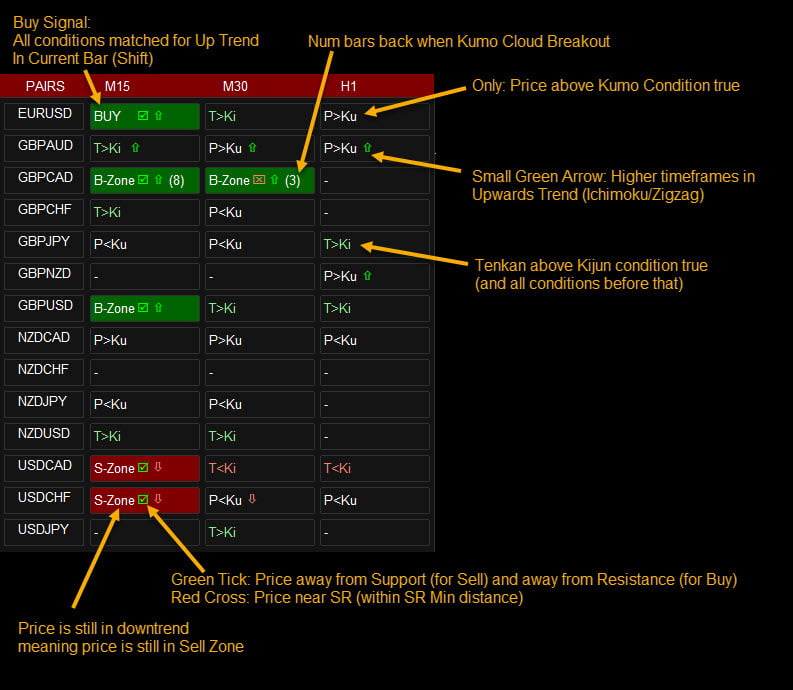
Dashboard uses Ichimoku Strategy to find best trades.
Use this template: specify “Ichimoku” in Property: “Use Template For New Window”
Tutorial:
Default strategy:
Checks:
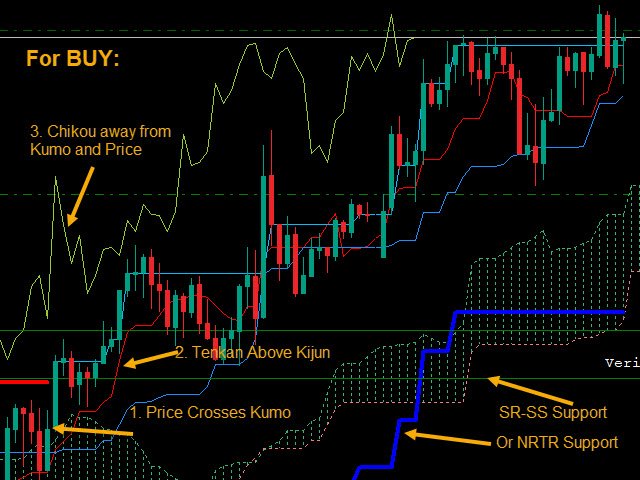
For BUY:
* If “Check Price Kumo Breakout” true and price above at least min distance from Kumo
* If “Check Tenkan Kijun Cross” true and Tenkan at least min distance above Kijun
Check all Tenkan/Kijun Filters in Filter 1 and Filter 2
* If “Check Chikou Cloud Distance” true and Chikou at least min distance away from Kumo
* If “Check Support/Resistance”: SR-SS uses SS_SupportResistance_v07.53.ex4 and price at least min distance away from Resistance
SR-NRTR uses NRTR_Rosh_v2eAlert_mtf.ex4 and price above blue Support
* If “Use Stochastic” true and price within safe Stochastic Overbought/Oversold
* If “Only when Overbought/Sold and back” true then also check if price was Oversold and back in previous bar.
* If “Use Awesome Oscillator” true then check Awesome is above and Green.
If all above conditions are met, you will get a BUY Signal. For SELL vice-versa
And while trend is good, it shows B-Zone/S-Zone.
Min Distance Calculation:
All Min Distance calculation is in points. Find the Min Distance using the crosshairs tool:
Read more:
https://www.mql5.com/en/blogs/post/747462
So suppose you are using timeframes M15,M30,H1
And you keep “Min Price-Cloud Distance” values 40,80,160
Then it will check on M15 that price is at least 40 points above Kumo for Buy and 40 points below Kumo for Sell.
And for M30, it will check 80 points above/below and for H1 160 points above/below.
Same way you can set other Min Distances as 40,80,160 or whatever values you like based on the Min distance you prefer on that timeframe.
S/R Calculation:
It uses: “SS_SR_AbiroidBuffers” indicator to calculate SR Lines. Available as extras in link above.
Ichimoku Dash keeps show_zone_turncoat to false in “ SS_SR_AbiroidBuffers”:
About Turncoat zones: If Support was brokern it will show as turned resistance-zone. Same way if a Resistance is broken it will show as Support.
And Turncoat Zones are not very reliable, and there will be too many of them, so we keep them off.
* If “Check Support/Resistance” true
For BUY Check price distance from Resistance. And for SELL check price distance from Support.
Using the “Min Distance From S/R” values. If Min Distance values are blank, then it will check if price is inside SR Zone or not.
If Min Distance is specified, then it will check if price is at least Min Distance away from center of SR Zone or not.
If safe to trade, show a Green Tick in the BUY/SELL buttons. Else show a Red Cross.
So, if your timeframes are M5,M15,M30 and the “Min Distance From S/R” values are 10,20,30.
Then for BUY for M5, check if price is at least 10 points away from Resistance.
(e.g. for EURUSD if resistance is at 1.10050, then price should be at least below 1.10040).
* If “Only Alerts When Safe S/R” true get Alerts for only Safe trades.
Ignore alerts for other trades where price too close to Resistance (for BUY) or Support (for SELL)
(Note: Only alerts ignored. BUY/SELL buttons will still light up with green/red ticks)
For NRTR: For Buy price should be above blue support and For Sell price should be below red resistance. Min distances are not relevant here.
Higher Timeframe Alignment Check:
Force Align Check True: looks at higher timeframes to see if Trend is aligned with current timeframe’s trend or not.
Choices:
1. Ichimoku
If using Ichimoku, it will check if HTF timeframes also have price above Kumo for Buy and below Kumo for Sell.
E.g. if current TF is M30 and has a BUY Signal (price above Kumo and all other checks satisfied)
And “Number of higher TF Check for Trend Align” is 2, then it will check if H1 and H4 both also have price above Kumo (not necessarily Min Distance away).
HTF Alignment check only checks if price above Kumo for BUY and below for SELL on HTF. And won’t look for other checks (TK, Chikou, etc) on HTF. Because otherwise signals will be too limited.
So, it helps you trade only when higher timeframes are also in the same direction trend.
2. Zigzag
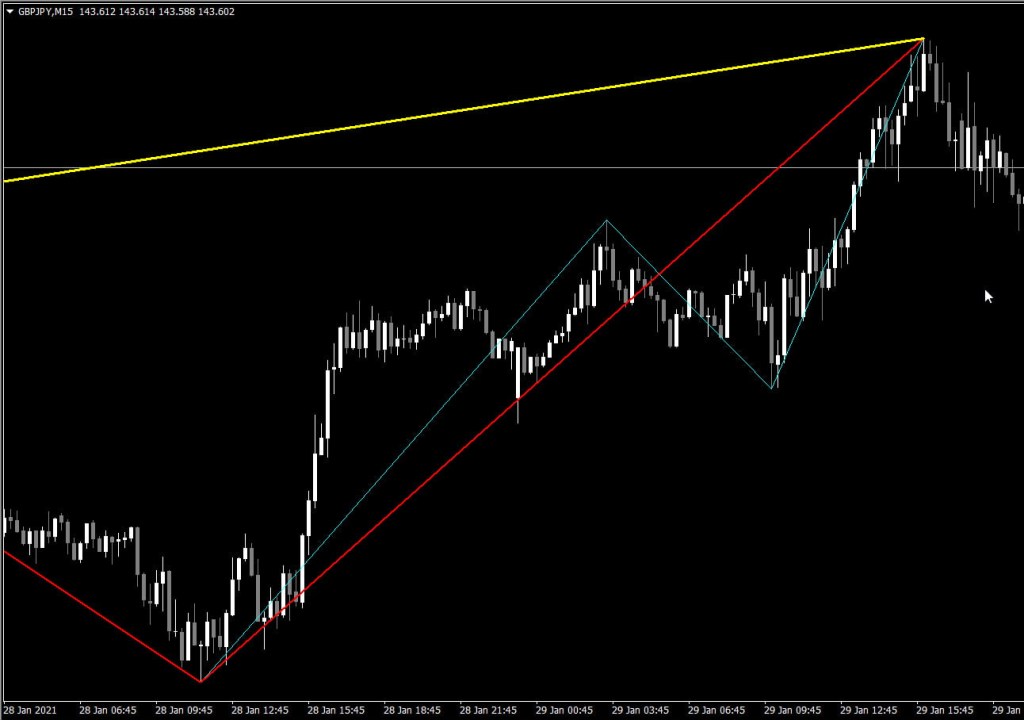
If using Zigzag, it will check all HTF timeframes for Zigzag trend. Use this multiTF zigzag tool to see zigzag for multiple timeframes:
ZigZag_MTF.ex4
E.g:
Blue line is M30, Red line is H1 and Yellow line is H4. And all lines create a zigzag point at the top high. Indicating price will now reverse downwards.
So they signify a down trend and if Ichimoku on M15 (current TF) also indicates Down trend, then you will get a SELL signal.
Zigzag check is very useful for short scalping in smaller timeframes. You could keep looking for Kumo breakouts and always trade in direction of trend according to higher timeframes.
And keep all other checks like Chikou, TK Checks, stochastic, etc false. To get quicker signals.
Settings:
Comma-separated lists:
– Own Pairs List or Select pairs list from drop-down like “Forex Core 7”, “Forex Core 14”, etc.
– Time frames. Possible values: M1,M5,M15,M30,H1,H4,D1,W1,MN1
– Min Distances: 30,40,50
(Converted to points. Eg for H1 EURJPY: if kumo is at 116.800. And this value is 50. It will check if price is at least above 116.850)
– Settings for showing alerts: Popup, email, sound alerts, etc.
– x_axis, y_axis: to position Scanner Dashboard
– fontSize: resize whole panel and fonts. Use fontSize between 5 and 8.
– ColumnsNum: No of Dashboard Columns
– OnButtonClick Open New Window: On clicking any button open that Pair-TimeFrame in a new window with your template:
– Use Template for New Window: Template name without “.tpl”. Eg: Create a file Template1.tpl in templates folder and here specify: “Template1”.
(only works if previous property set to true). Does not work if on button click is set to open in current window.
– Shift: Bar for which all conditions are checked. Candle Shift 0 means current bar (still forming). Candle Shift 1 means last closed bar. And so on…
– Refresh After Ticks (if shift 0): For shift 0 (current candle), wait for this number of ticks before refreshing everytime.
If using higher timeframes use a much higher number like 300 or 500.
– Use Heiken Ashi Price: If true Use Heiken-Ashi bar close price instead of actual bar close.
– Use Stochastic: If true use stochastic indicator to find good BUY/SELL.
If “Only when Overbought/Sold and back” true: Good BUY if Stochastic went Oversold below 80 and back. Good SELL if went OverBought and back.
– Check Price Kumo Breakout: If true check when price breaks Kumo cloud. Upwards means Up trend and Downwards break means downtrend has started
Show Kumo Breakout Past Bars (x): Will show how many bars back the Kumo cloud break happened. When Buy/Sell or B-Zone/S-Zone signal is On.
Keep this to 0 to turn this check off.
– Min Price-Cloud Distance: Minimum distance between price and Kumo Cloud.
– Max Tenkan Price Distance (comma separated): Maximum Distance in points between Tenkan and Price. If 0 then no check done.
– Tenkan and Kijun Filters with respect to Cloud:
– Strong Signal: Above/Below: Above for BUY and Below for SELL.
– Medium Signal: Above/Below Above or Inside for BUY and Below or Inside for SELL.
– Weak Signal: Anywhere
– With Price: Price Above/Below Tenkan Line or Kijun Line
– Check Tenkan Kijun Cross: true/false
– Min Tenkan Kijun Distance: If above true then check this Min distance between Tenkan and Kijun.
– Check Chikou Span: true/false
– Min Chikou Distance: If above true then check this Min distance between Chikou and Kumo or Chikou and Price.
– Alert On TK Cross: true: Alert when T & K cross and also show if cross happens above,below or inside Kumo.
For BUY TK Cross Strength:
TK Cross Up: Above Kumo ( Strong)
TK Cross Up: Inside Kumo ( Medium)
TK Cross Up: Below Kumo ( Weak)
Filter On: True means only show Alerts for Medium and Strong TK Cross. Ignore weak signals.


")

![[XAUUSD]: Weekly Liquidity Activation Points (timings), June 22-26, 2026](https://c.mql5.com/6/1013/splash-preview-771790.png "[XAUUSD]: Weekly Liquidity Activation Points (timings), June 22-26, 2026")