Ranging Market Detector
- 指标
-
Innovicient Limited
 我是一名策略设计师和交易员。 凭借我们团队开发的一些优秀的工作工具,我们的客户能够以良好的可预测性交易任何工具。
 - 版本: 2.12
- 更新: 4 十二月 2024
- 激活: 20
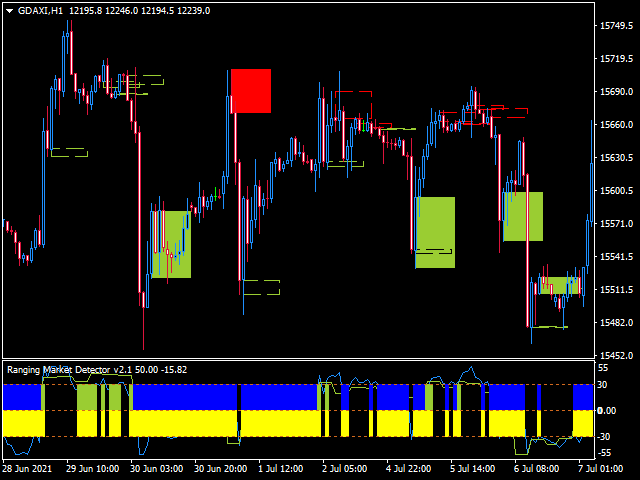
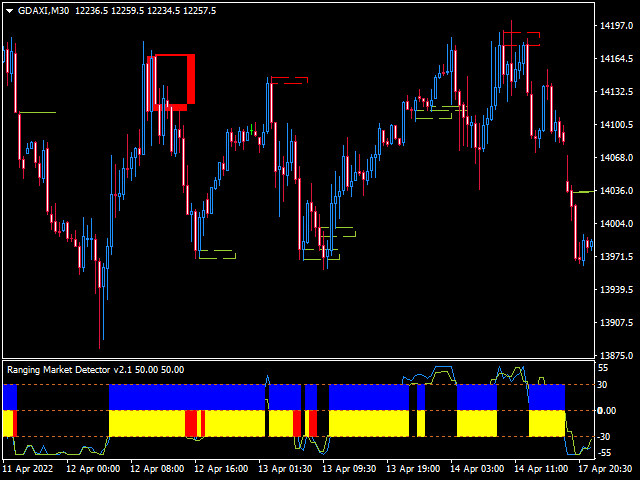
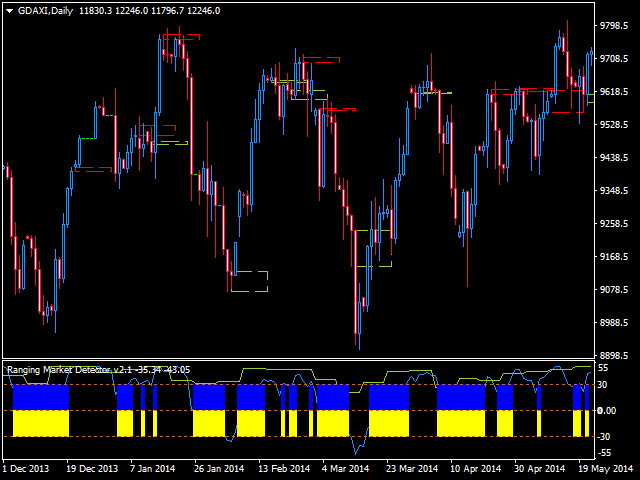
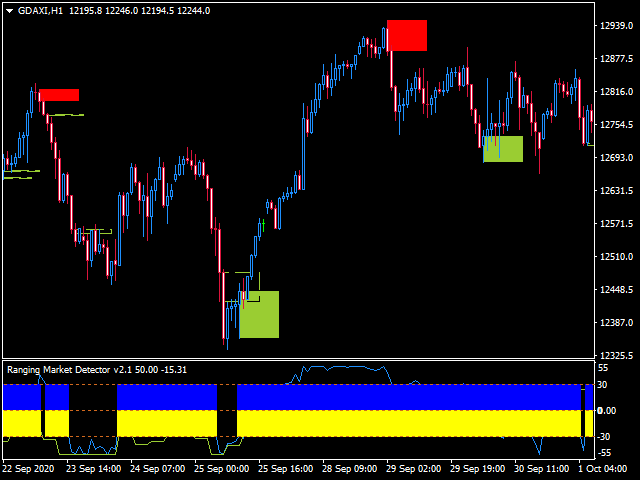
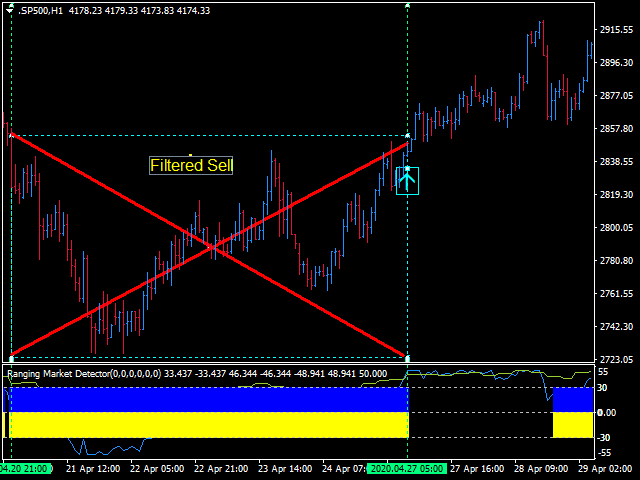
Ranging Market Detector scans the market for momentum and price to check whether the price is range-bound and the direction to which it will breakout.
- It works with all the all assets and visually shows you the instances when the market is either ranging or trending.
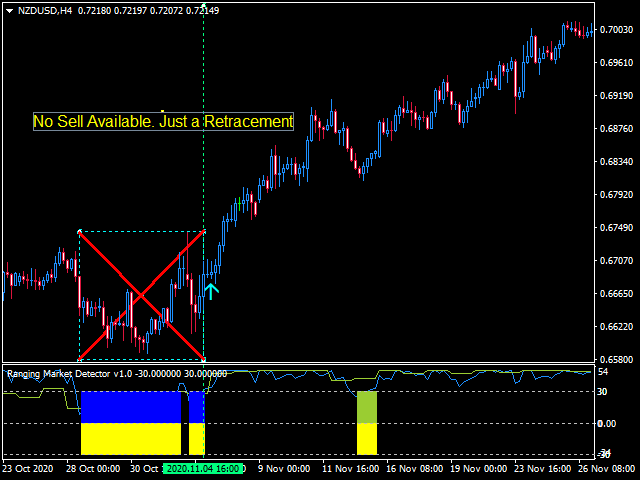
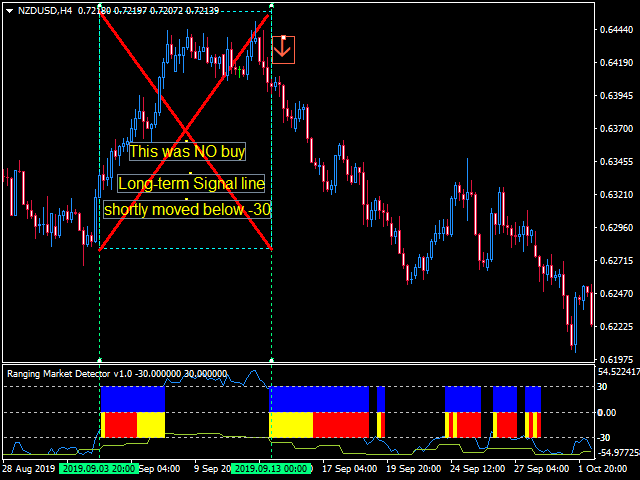
- Informs when the price has finished a retracement, an opportune time to re-enter the trend early. This will help you in position management.
- It works very well for Scalping, Day trading, and Swing trading. Helpful in all timeframes
- Great tool for every trader.
Ranging Market Detector can now draw Edges of a ranging market. You can now trade the Ranging Market comfortably knowing where it is fenced. It has the Top and Bottom Ranges [continuous boxes] and End of Mini Ranging [dotted boxes].
Settings:
The Ranging Market Detector does not require special settings. All the values have been optimized by our team through a vigorous testing environment to suit all instruments. All you need is to install and load the Ranging Market Detector to your chart.
Manual:
We have taken time to avail the comprehensive but simple user manual with images: https://www.mql5.com/en/blogs/post/744109
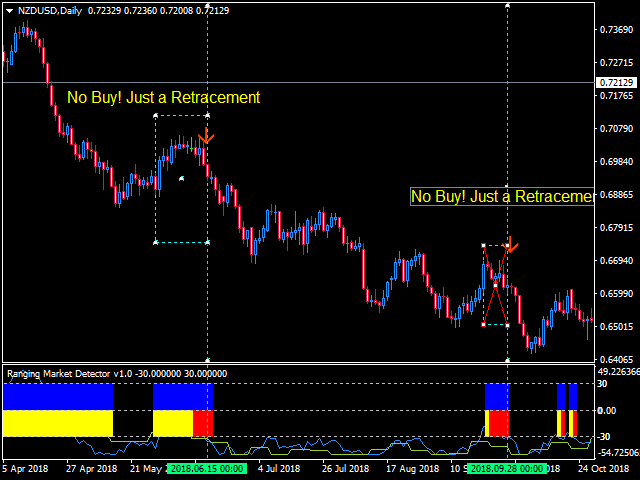
this is a must have trading indicator tool if you need to start making consistent profit, been trading for over three years and i would say i wish i had this early .this indicator monitors the market based on selected pair and timeframe and informs you that the ranging market pair is about to finish and even tells you the direction it would move which a plus over other traders in the market i wish i could say money back guaranteed other powerful functions of this indicator is that it tells you what to expect after a retracement ie either a power move to the top or bottom 10 star rating for this indicator i would have to say since i found this ranging indicator it s an eye opener probably the last indicator to purchase because it does the job grab more pips