Splash MT5
- 指标
- 版本: 1.7
- 更新: 6 八月 2025
- 激活: 5

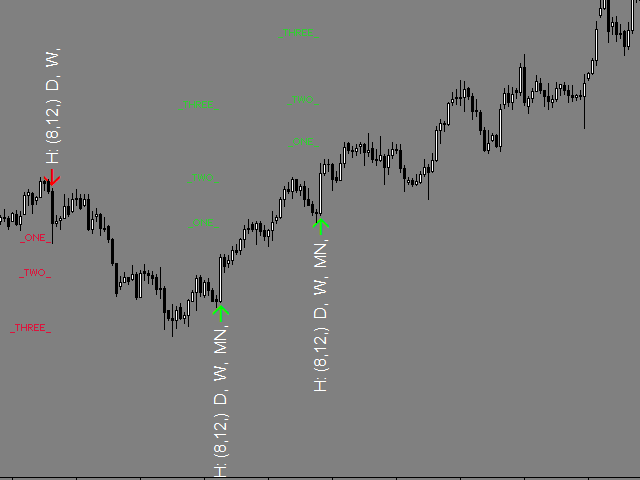
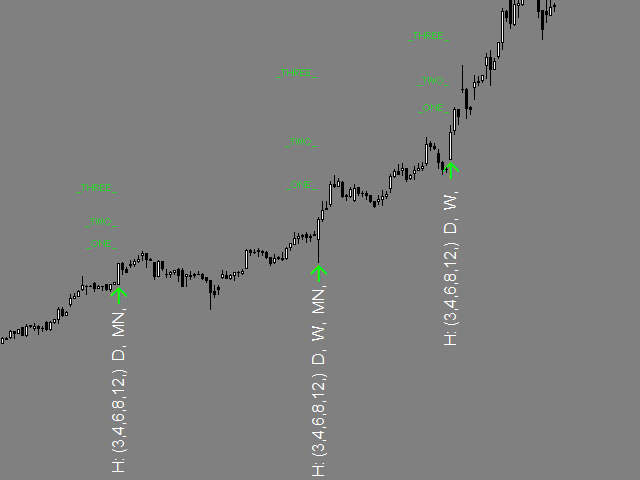
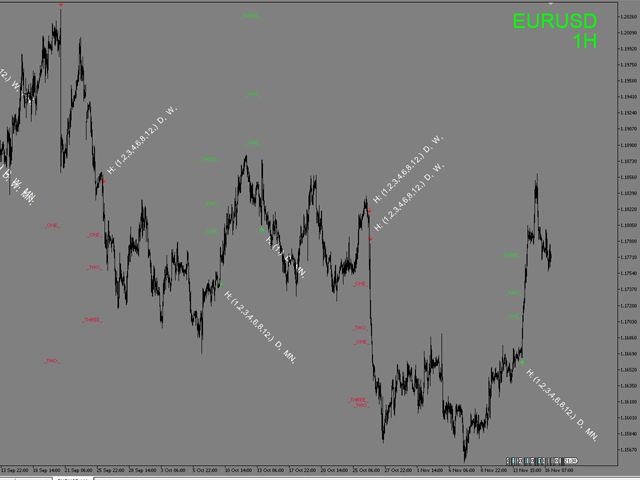
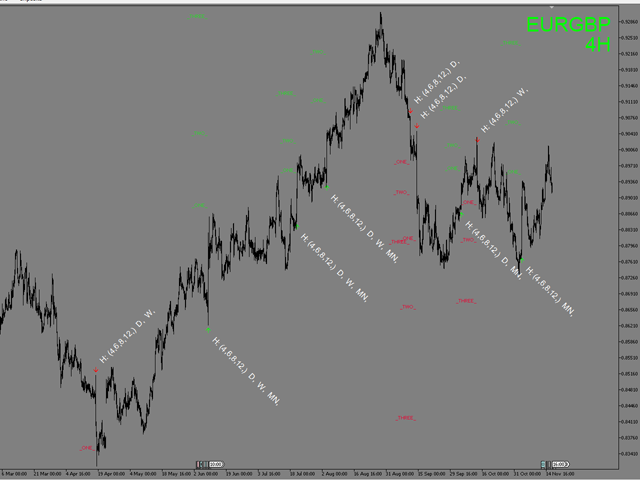
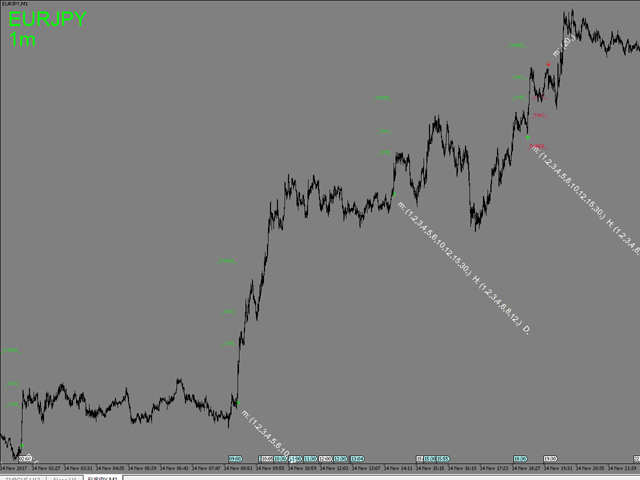
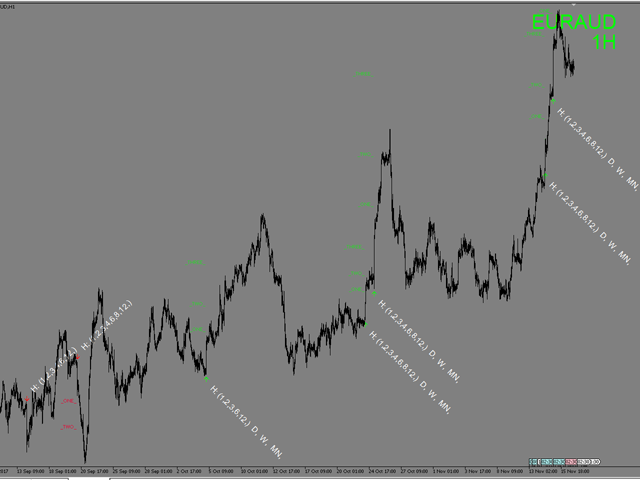
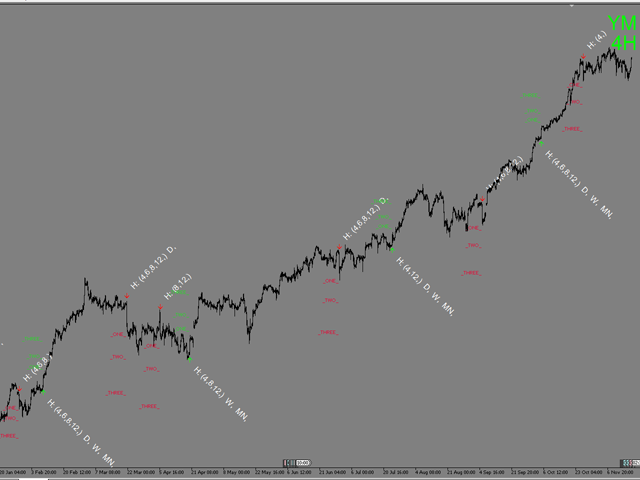
The indicator identifies the most suitable moment for entering the market in terms of market volatility, when the market has the strength to move (the signal is indicated by an arrow under the candle).
For each of the signals, the presence of trends on the current and higher timeframes is determined, so that the signal is in the direction of the majority of positions opened on the market (denoted near the signal by abbreviations of timeframes with a trend present).
The signal appears after the candle is closed.
To set the Take Profit level or to exit at the market price, the indicator determines 3 targets ("ONE", "TWO", "THREE" labels on the chart). By default. these are the Fibonacci levels: 1.618, 2.618, 4.236; custom values can be specified in the setting.
Stop Loss can be set near the arrow or at your discretion (remember that the tighter the stop loss, the more often it triggers).
- Splash can be used as a standalone trading system, as well as in conjunction with other methods, indicators, systems.
- The indicator can be used on any timeframe, on the stock, commodity and currency markets;
- It can be used for long-term, medium-term and short-term trading.
Settings
- History_Size - the amount of history for calculation.
- Period_Candle - calculation period for signal search.
- Mult_RS - volatility ratio.
- Type_Arrows - type of arrows.
- Target - display the targets.
- Target_ONE - the first target value.
- Target_TWO - the second target value.
- Target_THREE - the third target value.
- Target_Up - color of up target labels.
- Target_Down - color of down target labels.
- Trend - display the trend labels.
- MA_Period - period of the moving average for determining trends.
- MA_type - type of the moving average for determining trends.
- MA_price - price type used in calculation of the moving average.
- Trend_Text_Up - color of the trend labels for up signals.
- Trend_Text_Down - color of the trend labels for down signals.
- Trend_Text_FONTSIZE - font size of the trend labels.
- VHT - display the trend labels vertically / horizontally / diagonally.
- Send_Mail - email notification.
- Send_Notification - notification to mobile terminal.
- Send_Alert - standard terminal alert.