Navigator Trend
- 指标
- 版本: 1.5
- 激活: 10

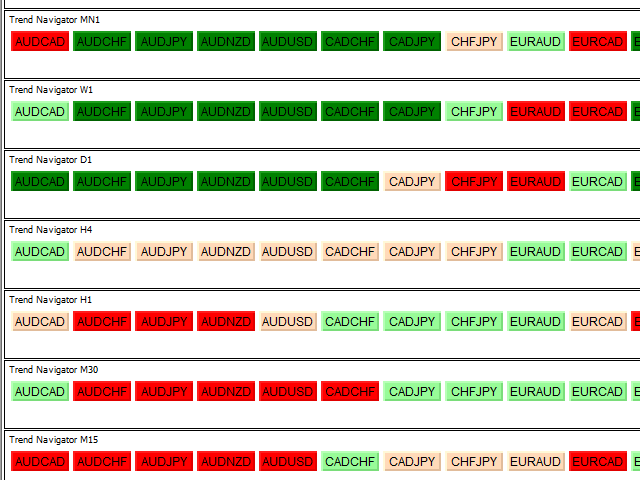
The Navigator Trend is an interesting indicator very easy to use.
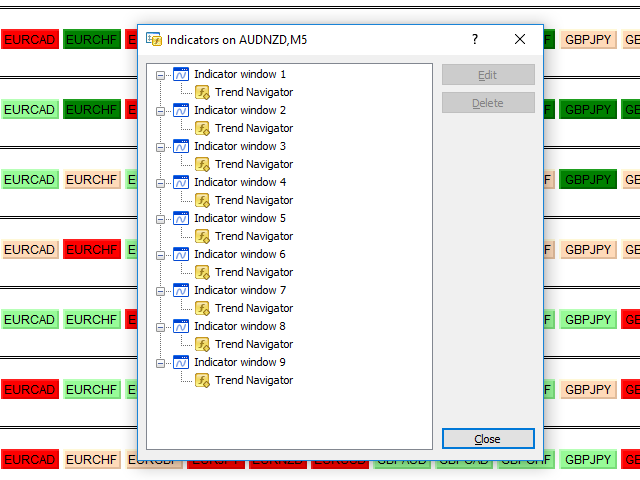
Apply this indicator on the chart to navigate very quickly through all the symbols and timeframes listed in inputs.
In addition it includes a trend condition that will alert you with a color about the direction and the market trend.
Use it in confluent way to get very good operating ideas.
You can customize both the graphic colors and the list of symbols to display.
A quick and easy tool that it will help to analyse the charts.
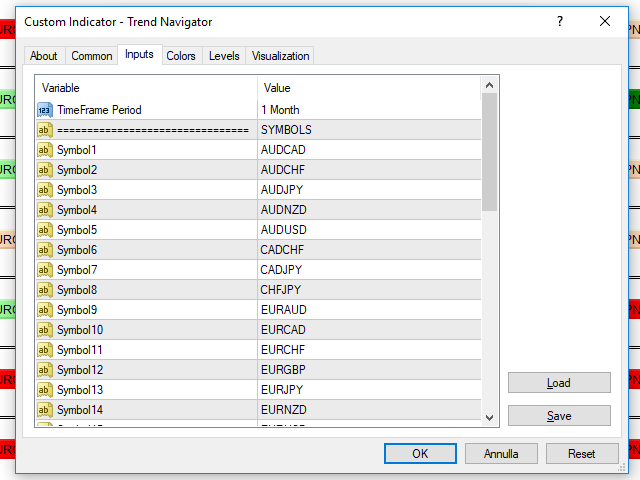
Input Values
- TimeFrame Period (timeframe to analyse)
- 32 symbols
- Forex_Suffix_Symbols (add Forex Suffix to NOT show it on button Symbols)
- COLORS AND SIZE SETTINGS
- Weak Long Trend
- Weak Short Trend
- Strong Long Trend
- Strong Short Trend
- BUTTON_WIDTH
- Button_Font_Size
- Button_Text_Color