Virtual equity indicator for multiple symbols

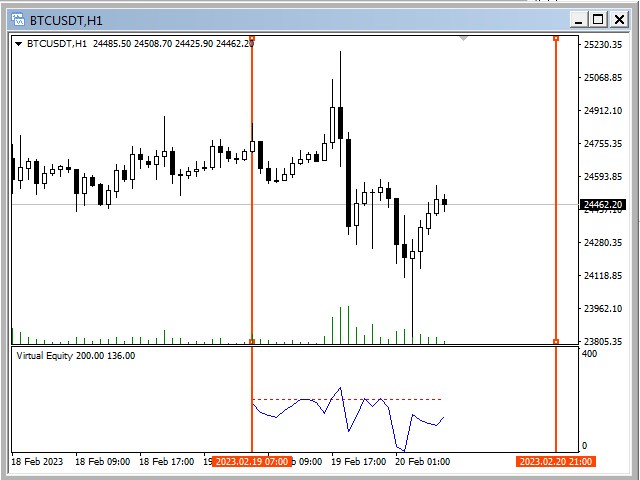
 Индикатор виртуального эквити, представляемый здесь, может работать по нескольким
символам одновременно. Для каждого символа задается направление (Buy/Sell) и размер позиции.
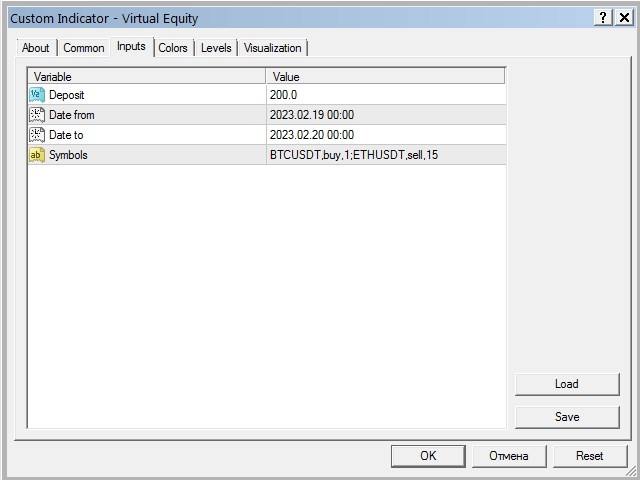
В настройках также указывается размер предполагаемого депозита, дата открытия и закрытия
позиции. 
 На графике при этом устанавливаются вертикальные линии, обозначающие указываемые в настройках даты. 
После установки индикатора на график, можно изменять время открытия и закрытия позиции,
передвигая эти линии. 
 Дату закрытия можно указывать из будущего, таким образом индикатор будет работать в реальном времени.

 Индикатор будет удобно использовать для подбора символов для парной (портфельной) торговли.
Число символов не ограничено.
У хорошо коррелирующих пар, к примеру, можно подбором лота каждого символа добиться минимального
изменения эквити в трендовых (размашистых) движениях и, при этом, во флете наблюдать достаточно
большие стабильные изменения, которые можно использовать в торговле.
 Это своего рода арбитраж внутри биржи, но разных инструментах.
Используя индикатор, можно отрабатывать свои портфельные стратегии.

Настройки по символам следующие: через запятую - символ, направление, размер лота.
                                                          затем точка с запятой (;) и следующий символ и т.д.

Дата забивается вручную или выбирается из выпадающего календаря.

Индикатор также тестировался на бирже Bybit, там есть поддержка терминала МТ4.
推荐产品
Price Magnets
Ivan Simonika
Price Magnet — Price Density and Attraction Levels Indicator Price Magnet is a professional analytical tool designed to identify key support and resistance levels based on statistical Price Density. The indicator analyzes a specified historical period and detects price levels where the market spent the most time. These zones act as “magnets,” attracting price action or forming a structural base for potential reversals. Unlike traditional Volume Profile tools, Price Magnet focuses on price-time d
Auto Fibo Pro m
DMITRII GRIDASOV
“Auto FIBO Pro” Crypto_Forex 指标 - 是交易中的绝佳辅助工具! - 指标自动计算并放置在图表斐波那契水平和局部趋势线(红色)上。 - 斐波那契水平指示价格可能反转的关键区域。 - 最重要的水平是 23.6%、38.2%、50% 和 61.8%。 - 您可以将其用于反转剥头皮或区域网格交易。 - 还有很多机会可以使用 Auto FIBO Pro 指标来改进您当前的系统。 - 它具有信息价差掉期显示 - 它显示所连接的外汇对的当前价差和掉期。 - 显示屏还显示账户余额、净值和保证金。 - 可以将信息价差掉期显示定位在图表的任何角落 . 点击这里查看高质量的交易机器人和指标! 这是仅在此 MQL5 网站上提供的原创产品。 ...............................................
Trend PA
Mikhail Nazarenko
5 (3)
The Trend PA indicator uses   Price Action   and its own filtering algorithm to determine the trend. This approach helps to accurately determine entry points and the current trend on any timeframe. The indicator uses its own algorithm for analyzing price changes and Price Action. Which gives you the advantage of recognizing, without delay, a new nascent trend with fewer false positives. Trend filtering conditions can be selected in the settings individually for your trading style. The indicator
Rainbow Price Visualizer
Vincent Jose Proenca
Rainbow Price Visualizer v1.21 See where the market really breathes. Turns your MT4 chart into an ultra-precise heatmap that highlights price zones favored by big players. Why it matters 300 price levels at 0.2‑pip resolution — microscopic detail. 8 visual themes (Rainbow, Fire, Ocean…) for instant readibility. Smart opacity: low noise fades, real zones pop. Lightweight rendering with automatic cleanup. Fully customizable: saturation, opacity, resolution, history depth. Bands project into the f
Basic Theme Builder
Mehran Sepah Mansoor
5 (1)
基本主题构建器:简化您的图表自定义 通过   基本主题构建器   指标,彻底改变您的交易体验。这款多功能工具旨在简化您在MetaTrader 4 平台上自定义图表外观的过程。该指标提供了一个用户友好的面板,您可以轻松切换不同的主题和配色方案,提升交易环境的视觉吸引力和功能性。   Free MT5 version 基本主题构建器   指标是那些希望轻松个性化MetaTrader 4图表的交易者的终极工具。通过其简单的面板界面和各种主题预设,您可以迅速调整图表的外观,以匹配您的交易风格或心情。无论您偏爱经典外观还是现代美学,基本主题构建器提供了一系列选项,以增强您的视觉体验并提高专注度。立即优化您的交易设置,体验这款实用且易于使用的指标。 主要特点: 轻松管理主题:   使用便捷的面板界面,单击即可快速更改图表主题。 预定义预设:   从几种预配置的主题和配色方案中进行选择,包括经典、深色、浅色等,以适应您的交易偏好。 可自定义选项:   调整颜色和样式,按您的喜好定制图表外观。 用户友好界面:   享受简单直观的设计,无需复杂设置或配置。 提升交易专注度:   通过视觉吸引力强且无
FREE
Indicator of the Margin Call, Stop Out and Plus 100 (one hundred percent of profit to the deposit) levels. It has been designed to better visualize and maintain money management when trading financial instruments. The levels drawn by the indicator have different colors. They visualize the price range, at which a broker generates a notification (Margin Call) and force closes the deals (Stop Out) due to the shortage of funds on the account, in case the price goes against the positions opened by a
Quantum Falcon Signal Free is a smart visual trading indicator for MetaTrader 4 designed for Forex and Gold traders. The indicator combines: • Trend analysis • RSI momentum confirmation • MACD momentum filtering • ATR volatility filtering • Higher timeframe confirmation • Smart exit signal detection Main Features: • Smart Buy and Sell signals • Exit Buy / Exit Sell alerts • Real-time dashboard on chart • Professional candle arrows • Multi-timeframe trend confirmation • ATR market volatility filt
FREE
Trend Ray
Andriy Sydoruk
The indicator shows the potential trend direction by cyclical-wave dependence. Thus, all the rays of the intersection will be optimal rays, in the direction of which the price is expected to move, taking into account the indicator period. Rays can be used as a direction for potential market movement. But we must not forget that the approach must be comprehensive, the indicator signals require additional information to enter the market.
平均方向指数(ADX) 多货币扫描仪 MT4 是一种先进的交易指标,旨在同时分析多个货币对。它为希望通过提供基于平均方向指数的实时信号来增强决策过程的交易者带来了好处,从而实现高效的市场趋势分析。 该工具通过简化趋势强度和方向移动的识别来优化交易体验,使其成为采用 ADX 基础策略的交易者的重要资产。借助实时警报和用户友好的仪表板,交易者可以快速评估市场状况并做出明智的交易选择。 MQL产品安装指南 | 在 MT4/MT5 上更新已购买的MQL产品 | 常见故障排除指南 | 指标设置 / 指南 主要特点 缓冲区集成:将指标值暴露为可访问的缓冲区,允许 Expert Advisor 使用信号数据进行自动交易。 可视化箭头信号:在信号蜡烛上直接在图表上显示清晰的买入/卖出箭头,便于快速视觉分析。 快速且可回测:基于 MetaTrader 的本地 OnCalculate() 引擎构建,确保快速计算并与历史回测兼容。 弹出警报:在信号事件期间触发 MetaTrader 警报弹出窗口,确保交易者不会错过潜在的交易设置。 推送通知:向移动设备发送即时推送通知,使交易者能够在移动中监控信号。 电子邮
VR Cub
Vladimir Pastushak
VR Cub 这是获得高质量切入点的指标。该指标的开发是为了促进数学计算并简化对仓位入场点的搜索。多年来,该指标所针对的交易策略已被证明其有效性。交易策略的简单性是其巨大的优势,即使是新手交易者也能成功进行交易。 VR Cub 计算开仓点以及获利和止损目标水平,这显着提高了效率和易用性。查看使用以下策略进行交易的屏幕截图,了解简单的交易规则。 设置、设置文件、演示版本、说明、问题解决,可以从以下位置获取 [博客] 您可以在以下位置阅读或撰写评论 [关联] 版本为 [MetaTrader 5] 计算入场点的规则 开仓 要计算入场点,您需要将 VR Cub 工具从最后一个高点拉伸到最后一个低点。 如果第一个点在时间上早于第二个点,交易者等待柱线收于中线上方。 如果第一个点在时间上晚于第二个点,交易者等待柱线收于中线下方。 根据上述条件,严格在 柱线收盘 后建仓。 换句话说,如果我们在小时图上进行交易,那么从最高点到最低点的时间距离必须超过24小时,最高点和最低点之间的点数必须大于或等于平均价格变动每天。 维持和改变市场地位 可以有多个未平仓头寸;每个头寸都可以单独修改。 VR Cub
The indicator detects and displays 3 Drives harmonic pattern (see the screenshot). The pattern is plotted by the extreme values of the ZigZag indicator (included in the resources, no need to install). After detecting the pattern, the indicator notifies of that by a pop-up window, a mobile notification and an email. The indicator highlights the process of the pattern formation and not just the complete pattern. In the former case, it is displayed in the contour triangles. After the pattern is com
该指标显示全球交易所的交易时间。帮助您了解当前哪些市场最活跃 查看我的  #1 Pro  Utility : 66+ 功能,包括此工具  |   联系我  如有任何问题 帮助选择当前波动最大的交易品种; 对日内交易者特别有用; 1) 在 1H 及以下时间框架 上使用时:线条将对应图表上实际的K线位置,移动图表时,交易时段的线条 会随图表一起移动 。 2) 在 4H 及以上时间框架 上使用时:将显示交易时段的 静态图表 ,垂直线 会在一天中移动 ,指示当前哪些市场活跃。(由于比例尺的原因)。 安装指标后,建议关闭网格 (CTRL+G) 并关闭对象描述 (F8>通用>显示对象描述)。 输入设置: 重要:   为使指标正常工作,需在初始设置中设置   经纪商时间与格林尼治标准时间的时差: 经纪商时间可在“市场报价”窗口顶部查看 (视图 > 市场报价 [或 CTRL+M])。 例如,如果经纪商时间现在是 16:30:00,而格林尼治标准时间是 14:30:00,参数值应为 [2] (相差2小时)。 如果时差为负,请勿忘记在数字前添加负号 (如果经纪商时间现在是 13:20:00,而格林尼
The indicator detects and displays М. Gartley's Butterfly pattern. The pattern is plotted by the extreme values of the ZigZag indicator (included in the resources, no need to install). After detecting the pattern, the indicator notifies of that by the pop-up window, a mobile notification and an email. The pattern and wave parameters are displayed on the screenshots. The default parameters are used for demonstration purposes only in order to increase the amount of detected patterns. Parameters z
FreqoMeterForecast
Stanislav Korotky
The main idea of this indicator is rates analysis and prediction by Fourier transform. Indicator decomposes exchange rates into main harmonics and calculates their product in future. You may use the indicator as a standalone product, but for better prediction accuracy there is another related indicator - FreqoMaster - which uses FreqoMeterForecast as a backend engine and combines several instances of FreqoMeterForecast for different frequency bands. Parameters: iPeriod - number of bars in the ma
Magic Balance
Daniil Evstratenko
The indicator shows which trading pairs, strategies, robots and signals that you use are profitable and which are not. The statistic of trades and balance graph are displayed in the account currency and pips - to switch simply click on the graph. button "$"(top left) - minimize/expand and move the indicator panel button ">"(bottom right) - stretching and resetting to the original size Statistic of trades 1 line - account balance, current profit and lot of open trades; 2 line - the number of all
Double HMA lines MTF
Pavel Zamoshnikov
5 (2)
This is a multi-timeframe version of the popular Hull Moving Average (HMA). The Double HMA MTF Light indicator combines two timeframes on a single chart. The HMA of the higher timeframe defines the trend, and the HMA of the current timeframe defines short-term price movements. The indicator is freely distributed and hasn't audio signals or messages. Its main function is the visualization of price movements. If you need advanced functionality of the HMA multi-timeframe indicator (information ab
FREE
The indicator detects and displays Shark harmonic pattern (see the screenshot). The pattern is plotted by the extreme values of the ZigZag indicator (included in the resources, no need to install). After detecting the pattern, the indicator notifies of that by a pop-up window, a mobile notification and an email. The indicator highlights the process of the pattern formation and not just the complete pattern. In the former case, it is displayed in the contour triangles. After the pattern is comple
News Scalping Executor Pro is an utility which helps to trade high impact and huge volatility   news . This utility helps to create two opposite orders with risk management and profit protection. It moves automatically stop loss level to avoid losses as much as possible by using many different algorithms. It helps to avoid trading the news if spread suddenly becomes very huge. It can lock profit by moving stop loss or partially closing of orders. To be profitable with this type of trading you
Smart FVG indicator MT4
Ahmad Kazbar
4.8 (5)
Smart FVG 指标 MT4 – MetaTrader 4 高级公平价值缺口检测 Smart FVG 指标为 MetaTrader 4 提供专业的公平价值缺口(Fair Value Gap,FVG)检测、监控和告警功能,所有信息都直接显示在图表上。它将基于 ATR 的过滤与结构感知逻辑相结合,帮助你去除噪音、适应流动性,并只保留最关键的不平衡区域,从而做出更加精确的交易决策。 主要优势 精准的 FVG 检测:识别真正的市场低效,而不仅仅是简单的 K 线价格跳空。 基于 ATR 的自适应精度:根据不同市场与周期自动过滤低质量信号。 实时有效性跟踪:当价格填补或突破缺口时,相关区域会被自动延伸、调整或删除。 高度可视化与自定义:可根据任何模板自定义颜色、线型和填充样式。 实用告警功能:对新出现、被填补或被突破的 FVG 提供实时通知。 性能优化:轻量化设计,适合多品种、多周期同时扫描。 工作原理 将指标加载到任意 MT4 品种与时间周期图表上。 算法会扫描历史与实时 K 线,标出当前有效的 FVG 区域。 ATR 逻辑会根据当前波动率和流动性动态调整检测条件。 当价格完全回补缺口
FREE
Nirvana prop controler MT4
Aiireza Arjmandi Nezhad
面向专业交易者与评估账户(Prop)的风险管理与限制监控指标 本工具仅在图表上展示风险管理与限制相关的精确信息,帮助你更专注地做出决策。该指标不执行开仓/平仓/修改操作,也不会与智能交易系统(EA)产生干扰。 功能 监控日内与总回撤 基于余额(Balance)或净值(Equity)计算并显示日内/总回撤(可配置)。 显示距离预设限制的剩余百分比。 清晰专业的图表面板 摘要表:余额、净值、当前盈亏、日内/总回撤、预警阈值。 简洁易读的界面,便于专注决策。 基于风险的仓位大小 根据百分比/固定金额风险和所选止损距离计算大致手数。 在图表上显示风险回报比(R:R)以及入场、止损(SL)、止盈(TP)水平。 警报与通知 接近日内/总回撤阈值时触发警报(阈值百分比可设置)。 价格触及 SL/TP 或其他自定义事件时发送通知。 支持向桌面和移动端推送通知。 兼容性与非干预 指标仅用于信息展示,不执行或管理订单。 可同时用于多个图表与品种。 即使在不允许 EA 的环境中也可使用。 使用方法 将指标加载到所需品种与时间周期上。 设置日内/总限制、计算基准(Balance/Equity)以及时区或每日
History Pattern Search
Yevhenii Levchenko
该指标建立当前报价,可以与历史报价进行比较,并在此基础上进行价格走势预测。指示器有一个文本字段,用于快速导航到所需日期。 选项: 符号 - 选择指标将显示的符号; SymbolPeriod - 选择指标从中获取数据的时段; IndicatorColor - 指示器颜色; HorisontalShift - 由指标绘制的报价移动指定的柱数; Inverse - true 反转引号,false - 原始视图; ChartVerticalShiftStep - 图表垂直移动(键盘上的向上/向下箭头); 接下来是文本字段的设置,您可以在其中输入日期,您可以通过按“回车”立即跳转到该日期。 接下来是文本字段的设置,您可以在其中输入日期,您可以通过按“回车”立即跳转到该日期。
Candle Pattern Finder Candle Pattern Finder is a powerful MT4 indicator designed to help traders easily detect key candlestick patterns in real-time. Whether you're trading trends, reversals, or consolidations, this tool highlights important price action signals directly on the chart — helping you make faster and more confident trading decisions. Detects popular candlestick patterns: Bullish/Bearish Engulfing Hammer & Inverted Hammer Shooting Star & Hanging Man Three White Soldiers Three Black
FREE
TrendMaster Alert Pro
Andrei Telegin
5 (1)
TrendMaster Pro Alert: Your Professional Manual Trading Station Stop chasing the market and start leading it.   TrendMaster Pro Alert   is an interactive trading dashboard designed to simplify complex analysis and execute flawless trades. Key Features of TrendMaster Pro: Multi-Tier Trend Control:   Stay on the right side of the market by monitoring M15, H1, and H4 trends simultaneously. No more trading against the major flow. Advanced Filter Suite:   A powerful blend of ADX (momentum), RSI, and
FREE
The indicator displays the data of the Stochastic oscillator from a higher timeframe on the chart. The main and signal lines are displayed in a separate window. The stepped response is not smoothed. The indicator is useful for practicing "manual" forex trading strategies, which use the data from several screens with different timeframes of a single symbol. The indicator uses the settings that are identical to the standard ones, and a drop-down list for selecting the timeframe. Indicator Paramet
这是一个预测蜡烛收盘价的指标。 该指标主要用于 D1 图表。 该指标适用于传统外汇交易和二元期权交易。 该指标可以用作独立的交易系统,也可以作为您现有交易系统的补充。 该指标分析当前蜡烛,计算蜡烛本身内部的某些强度因素,以及前一根蜡烛的参数。 因此,该指标预测市场走势的进一步方向和当前蜡烛的收盘价。 由于这种方法,该指标既适用于短期盘中交易,也适用于中长期交易。 该指标允许您设置指标在分析市场情况期间将产生的潜在信号的数量。 在指标设置中有一个特殊的参数。 此外,该指标可以通过图表上的消息、电子邮件以及推送通知的形式通知新信号。感谢您的关注!交易愉快! 购买后一定要写信给我! 我会给你我的交易指标的建议! 还可以获得奖金!
TrendMaster Ultra | Structure-Based Trading Without Guesswork Tired of indicators that repaint after the fact? Sick of counter-trend oscillator signals firing in the middle of a powerful move, and endless stop-losses triggered by market noise? TrendMaster Ultra is not just another arrow indicator; it is an intelligent filter of market reality for MetaTrader 4. The system combines strict Price Action logic (Smart Money Concepts) with adaptive technical analysis. This tool takes over the most co

FREE
PZ Penta O MT4
PZ TRADING SLU
2.33 (3)
The Penta-O is a 6-point retracement harmonacci pattern which usually precedes big market movements. Penta-O patterns can expand and repaint quite a bit. To make things easier this indicator implements a twist: it waits for a donchian breakout in the right direction before signaling the trade. The end result is an otherwise repainting indicator with a very reliable trading signal. The donchian breakout period is entered as an input. [ Installation Guide | Update Guide | Troubleshooting | FAQ | A
FREE
This indicator is one of the useful tools for traders who trade on currency pairs and based on the strength of each currency they can make a correct decision or confirmation in the positions.  It has been calculated for all the minor currency pairs supported by the broker and displays the values of the major currencies. These currencies are displayed horizontally or vertically according to the trader's config when executing the indicator. One of the trading strategies that can be used is to cho
FREE
New Bar Alarm Free
Tomoyuki Nakazima
This indicator alerts you when/before new 1 or 5 minute bar candle formed. In other words,this indicator alerts you every 1/5 minutes. This indicator is especially useful for traders who trade when new bars formed. *This indicator don't work propery in strategy tester.Use this in live trading to check functionality. There is more powerful Pro version .In Pro version,you can choose more timeframe and so on. Input Parameters Alert_Or_Sound =Sound ----- Choose alert or sound or both to notify y
FREE
VSA Histogram
Richard Bystricky
VSA - P (Volume Spread Analysis) Period-Based Histogram is a tool that visually represents market volume dynamics using Volume Spread Analysis principles, with a focus on highlighting key volume changes over specific time periods. The histogram captures changes in volume and price spread relationships in real-time, enabling traders to detect early signals of accumulation, distribution, and shifts in buying or selling pressure. Indicator is non repainting and working with real-time on tick data.
该产品的买家也购买
Trend SniperX MT4
Sarvarbek Abduvoxobov
5 (3)
Trend Sniper X 是一款用于 MetaTrader 5 的多周期趋势追踪指标,旨在帮助交易者清晰、精准地识别趋势方向及潜在的反转点。 适用于 MT5: https://www.mql5.com/en/market/product/181101 价格信息: 当前价格为促销价,随着后续更新和新功能的推出,价格可能会发生变动。 Code2Profit 频道 通过多周期分析掌控市场! 如何使用 Trend Sniper X 最大化胜率:关键规则与交易时段技巧 技术规格 交易平台 MetaTrader 5 指标类型 多周期趋势指标 运行时间周期 任意图表周期,支持独立选择更高周期(M1–MN1) 主要交易品种 外汇、黄金 (XAUUSD) 及其他 CFD 差价合约 推荐账户 任何账户类型 可视化呈现 彩色趋势 K 线(买入/卖出/弱势/转变)+ 买入/卖出信号箭头 附加模块 市场交易时段框(悉尼、东京、伦敦、纽约) 核心功能 多周期趋势分析: 将更高周期的趋势方向直接投影到当前图表上,提供清晰的宏观视角。 弱势/不确定 K 线检测: 高亮显示趋势状况不明确的 K 线,帮助交易者远离震
SR Liquidity
Oleg Rodin
5 (2)
SR Liquidity 是一款旨在揭示市场流动性高度集中且价格反应最剧烈的隐蔽区域的交易指标。这些特殊的流动性区域充当着强有力的支撑位与阻力位,为您清晰呈现市场最可能发生反转的位置。 SR Liquidity 指标并非简单地绘制常规的支撑/阻力线,而是通过分析实际的价格行为,识别买卖压力积聚的区域。这些区域实际上是推动市场真实波动的流动性池。通过在图表上直观呈现这些区域,该指标能助您在价格反应发生前预判走势——这意味着它实际上能够预测价格方向可能发生的变化。它将原始的价格行为转化为清晰且具实操价值的市场蓝图,标示出那些可能成为市场转折点的关键价位。 该指标适用于任何交易品种和时间周期——包括外汇、指数、金属、加密货币等。支持任意时间周期。 购买后请联系我,以获取交易指南及免费赠送的优质附加指标!
Miraculous Indicator Binary & Forex v3 StrategySafe Miraculous Indicator Binary & Forex v3 StrategySafe 是一款专业交易指标,适合希望获得清晰信号、强大确认工具以及结构化交易方式的 Binary 和 Forex 交易者。 v3 版本加入了 MIR Dashboard、Miraculous Confirmation Dashboard、GANN Law、Square of 9 水平线、GANN 角度以及更强的 Forex 分析模式。 核心功能 同时支持 Binary 和 Forex 交易模式。 MIR Dashboard 可快速读取市场状态。 Miraculous Confirmation Dashboard 用于确认交易机会。 GANN Law drawing lines 用于 Forex 市场结构分析。 Square of 9 线条、方向和关键价格水平。 1x1 GANN Angle 用于判断趋势压力。 Entry Information TP 帮助寻找合理止盈区域。 Strateg
M1 Sniper
Oleg Rodin
4.97 (30)
M1 SNIPER 是一款易于使用的交易指标系统。它是一个专为 M1 时间框架设计的箭头指标。该指标可以作为独立的系统在 M1 时间框架下进行剥头皮交易,也可以作为您现有交易系统的一部分使用。虽然该交易系统专为 M1 时间框架交易而设计,但它也可以用于其他时间框架。我最初设计此方法是为了交易 XAUUSD 和 BTCUSD。但我发现这种方法在其他市场交易中也同样有用。 指标信号既可以顺势交易,也可以逆势交易。我教授一种特殊的交易技巧,帮助您利用指标信号进行双向交易。该方法基于使用特殊的动态支撑位和阻力位区域。 购买后,您可以立即下载 M1 SNIPER 箭头指标。此外,我还为所有 M1 SNIPER 工具用户免费提供下方屏幕截图所示的 Apollo Dynamic SR 指标!这两个指标的组合可以帮助您更轻松、更准确地利用 M1 时间框架进行交易。 购买后请联系我,免费获取交易提示和奖励指标! 祝您交易成功!
DayTrader PRO MT4
Davit Beridze
4.6 (10)
DayTrader PRO MT5:  https://www.mql5.com/en/market/product/186222 DayTrader PRO 是一款先进的交易指标,它结合了约翰·埃勒斯 (John Ehlers) 的 Laguerre 滤波器与强大的自动优化引擎。该指标不依赖固定的参数,而是根据最新的市场状况自动搜寻最佳设置,帮助您在无需手动调整的情况下适应不断变化的市场波动。 该指标可生成清晰的买入 (BUY) 和卖出 (SELL) 信号,并提供根据当前市场波动率计算得出的自适应止损 (Stop Loss) 和止盈 (Take Profit) 水平。内置的趋势、效率系数 (Efficiency Ratio)、波动率和蜡烛图过滤功能,有助于剔除低质量的交易设置,从而提高信号的准确性。 实时性能面板会显示当前已优化的设置、利润因子 (Profit Factor)、胜率 (Win Rate)、回撤 (Drawdown) 以及其他交易统计数据。DayTrader PRO 还支持弹出窗口、推送、邮件和声音提醒,确保您不会错过任何交易机会。 主要功能 全自动参数优化 自适应买入
Scalper Inside PRO
Alexey Minkov
4.74 (69)
Scalper Inside PRO 帮你分析日内趋势,在入场前就把交易规划好。核心是三套专属策略,让你更精准地读懂市场。信号一出现,指标就自动判断行情方向并计算关键价位,你能提前看到潜在入场点、预期的止损以及多个止盈位。详尽的绩效统计会展示不同品种和策略在历史上的表现,帮你根据当前行情挑选合适的资产。它既可以作为独立的剥头皮工具,也可以融入你的系统,或者作为你自己 EA 的基础。运行于 MetaTrader 4 平台。 指标会直接在图表上标出入场、三个止盈位 - TP1、TP2、TP3 以及一个可选止损。你甚至可以接入自己的箭头指标,检验它们的统计数据和盈利能力。 购买后请直接联系我,即可获得指标的专属附赠 add-ons、更多关于实盘运用的说明,以及把它正确接入你自己交易系统和 EA 的帮助。 指标主要功能 内置三套专属交易策略,可即时切换。 箭头信号出现后即时计算价位:入场以及 TP1、TP2、TP3 多级目标立刻显示,方便你提前规划交易。开启手动或自动计算后,会显示止损位。 三套策略均内置优化模块:自动把参数适配到当前品种和周期,帮你快速筛选资产(仅在实时状态下可用)。 HTF
Smart Trend Trading System
Issam Kassas
4.8 (10)
本产品已针对 2026 年市场进行更新,并针对最新 MT5 版本进行了优化。 价格更新通知: Smart Trend Trading System 目前价格为 $99 。 接下来的 30 次购买 后,价格将上涨至 $199 。 特别优惠: 购买 Smart Trend Trading System 后,请发送私信给我,即可免费领取 Smart Universal EA ,并将您的 Smart Trend 信号转换为自动交易。 Smart Trend Trading System 是一套完整的交易系统,具备不重绘、不回绘、不延迟的特点,专为希望获得更清晰信号、更准确趋势方向以及更有组织交易方式的交易者打造。 Online course , manual and [download presets] . 它将 10 多种交易工具 整合到一个系统中,包括趋势检测、反转区域、Smart Cloud、移动止损逻辑、支撑与阻力、K线着色、提醒以及多周期分析。 该系统旨在帮助您应对不同的市场环境: 趋势市场: 识别主要趋势,发现回调,跟随动能,并通过止损指导和移动止损选项寻找更清晰的入场机会。
Entry Points Pro
Yury Orlov
4.59 (174)
这是一款 MT4 的趋势指标,可提供准确的入场交易信号,且无重绘或延迟。 它可应用在任何金融资产:外汇、加密货币、贵金属、股票、指数。 最好的结果出现在 M15+ 的时间帧内。 指标的 MT5 版本 重要! 购买后请联系我,以便获取详细指南和奖励。 视频 (6:22) - 一个信号赢取的利润等于指标价格的三倍。 视频 (4:44) - 它如何在测试器中工作,我的提示和技巧。 视频 (1:44) - 有关它如何处理加密货币和指数的几句话。 大多数交易者在 Entry Points Pro 指标的帮助下,在第一个交易周内就改善了他们的交易结果。 Entry Points Pro 指标的益处 入场信号无重绘或延迟 如果信号出现,并得到确认(如果信号所在烛条已收盘),则它不会再消失;不像是重绘指标,它会导致重大的财产损失,因为它们可以在显示信号后再将其删除。 无差错开仓 指标算法可令您找到入场交易(买入或卖出资产)的理想时机,从而提高每位交易者的成功率。 Entry Points Pro 可操作任何资产 它允许您在 MT4 平台上交易任何经纪商提供的加密货币、股票、金属、指数、商品
Gann Made Easy
Oleg Rodin
4.84 (172)
Gann Made Easy 是一个专业且易于使用的外汇交易系统,它基于使用先生理论的最佳交易原则。 W.D.江恩。该指标提供准确的买入和卖出信号,包括止损和获利水平。您甚至可以使用推送通知在旅途中进行交易。 购买后请联系我,即可免费获得交易指导和超棒的额外指标! 您可能已经多次听说过江恩交易方法。通常 Gann 的理论不仅对于新手交易者而且对于那些已经有一定交易经验的人来说都是非常复杂的东西。这是因为江恩的交易方法在理论上并不那么容易应用。我花了几年时间来完善这些知识,并将最好的原则应用到我的外汇指标中。 该指标非常易于应用。您所需要的只是将其附加到您的图表并遵循简单的交易建议。该指标不断进行市场分析工作并寻找交易机会。当它检测到一个好的入口点时,它会为您提供一个箭头信号。该指标还显示止损和获利水平。 换句话说,当您像先生一样进行交易时,该指标会为您提供最佳江恩建议。江恩亲自告诉你此时此刻该做什么。但最好的部分是您不需要了解任何有关江恩交易原则的知识,因为该指标会为您完成整个市场分析工作。
成交量突破震荡指标是一种以震荡指标的形式将价格变动与成交量趋势相匹配的指标。 我想将成交量分析整合到我的策略中,但大多数成交量指标都令我失望, 例如 OBV、资金流量指数、A/D,还有成交量加权 Macd 和许多其他指标。 因此,我为自己编写了这个指标,我对它的实用性感到满意,因此我决定将其发布到市场上。 主要特点: 它突出显示了价格在成交量增加(突破)支持下朝某个方向移动的阶段。 它突出显示了成交量增加停止并因此市场收缩的阶段。 它突出显示了价格和成交量均未移动的阶段,尤其是在时间范围(<=15 分钟)的日内交易中,因此市场已为未来的运行做好准备。 当其他 EA 交易程序发出的虚假信号不受交易量增加的支持时,可过滤掉这些信号。 它使趋势和范围阶段可视化变得非常容易 输入参数: 计算设置: 计算类型:快速、正常、慢速,用于监控短期、中期和长期,保持在同一时间范围内。 计算周期:计算周期 交易量设置: 交易量类型:TickVolume(主要用于外汇)和RealVolume(用于股票市场) 信号设置: 信号周期:信号线周期 突破水平:突破信号的阈值水平 警报设置 警报类型:收盘
TPA True Price Action indicator reveals the true price action of the market makers through 100% non-repainting signals (except early signals mode) strictly at the close of a candle! TPA shows entries and re-entries, every time the bulls are definitely stronger than the bears and vice versa. Not to confuse with red/green candles. The shift of power gets confirmed at the earliest stage and is ONE exit strategy of several. There are available now two free parts of the TPA User Guide for our custom
Trend Catcher ind
Ramil Minniakhmetov
5 (11)
趨勢捕捉指標 趨勢捕捉指標結合了作者獨有的客製化自適應趨勢分析指標,用於分析市場價格趨勢。它透過過濾掉短期噪音,並專注於潛在的動能強度、波動性擴張和價格結構行為,來識別真實的市場方向。此外,它還結合了平滑和趨勢過濾等客製化指標,例如移動平均線、相對強弱指標 (RSI) 和波動率過濾器。 您可以在這裡查看實際運行情況以及我的其他產品: https://www.mql5.com/en/users/mechanic/seller 請注意,我不會在 Telegram 上出售 EA 或任何設置,那是騙局。所有設定都可以在我的部落格上免費取得。 重要提示!購買後請立即聯繫我,以獲取使用說明和額外獎勵! 請注意,我不會在 Telegram 上出售 EA 或任何設置,那是騙局。所有設定都可以在我的部落格上免費取得。
Quantum Naked SMC Prime is a streamlined Smart Money Concepts indicator designed for traders who prefer a clean chart, structured market analysis and clear visual trade setups without unnecessary complexity. The indicator combines market structure, liquidity behavior, institutional zones and confirmation logic into a compact analytical framework. Instead of flooding the chart with technical indicators, Quantum Naked SMC Prime focuses on the core elements of price action and Smart Money Concepts.
Advanced Currency IMPULSE with ALERT
Bernhard Schweigert
4.9 (491)
目前40%的折扣!! 对任何新手或专家交易者来说都是最好的解决方案! 这个指标是一个独特的、高质量的、负担得起的交易工具,因为我们已经纳入了一些专有的功能和一个秘密的公式。只需一张图表,它就能给出所有28种货币对的警报。想象一下,你的交易将如何改善,因为你能够准确地确定新趋势或剥头皮机会的触发点 建立在新的基础算法上,它使识别和确认潜在交易变得更加容易。这是因为它以图形方式显示了一种货币的强势或弱势是否正在加速,并测量了这种加速的速度--把它想象成你汽车中的速度表。当你加速时,事情显然会发生得更快,这在外汇市场上也是一样的,即如果你配对的货币正在向相反的方向加速,你就会发现一个潜在的有利可图的交易。 货币动量的垂直线和箭头将指导你的交易! 动态的市场斐波那契23水平被用作警报触发器,将适应市场活动。如果冲动触及黄色触发线,您将在MetaTrader或您的电子邮件或推送警报中收到警报。然后你就知道作为一个交易员应该做什么。货币对和方向已经给出。只要点击警报按钮,就可以切换到该货币对或打开一个新的图表,以便进一步分析。警报级别可以通过用户输入来改变,可以选择3个敏感度级别。 尽
Price Breakout pattern Scanner is the automatic scanner for traders and investors. It can detect following patterns automatically from your chart. Head and Shoulder - Common tradable pattern. Reverse Head and Shoulder - This pattern is the reverse formation of the Head and Shoulder. Double Top - When the price hits resistance level twice and decline toward the support level, the trader can anticipate sudden bearish breakout through the support level. Double Bottom - The double bottom pattern is
Quantum Breakout Indicator PRO
Bogdan Ion Puscasu
4.96 (26)
介绍     Quantum Breakout PRO   ,突破性的 MQL5 指标,正在改变您交易突破区域的方式!   Quantum Breakout PRO 由拥有超过 13 年交易经验的经验丰富的交易者团队开发,旨在通过其创新和动态的突破区域策略将您的交易之旅推向新的高度。 量子突破指标将为您提供带有 5 个利润目标区域的突破区域的信号箭头,以及基于突破框的止损建议。 它既适合新手交易者,也适合专业交易者。 量子 EA 通道:       点击这里 MT5版本:   点击这里 重要的!购买后请私信我领取安装手册。 建议: 时间范围:M15 货币对:GBPJPY、EURJPY、USDJPY、NZDUSD、XAUUSD 账户类型:ECN、Raw 或 Razor,点差极低 经纪商时间:GMT +3 经纪商:IC Markets、Pepperstone with Raw 和 Razor 的点差最低 规格: 不重漆! 最多 5 个建议利润目标区域 建议止损水平 可定制的盒子。您可以设置自己的 Box Time Start 和 Box Time End。 接触 如果您
目前八折优惠! 对任何新手或专家交易者来说都是最好的解决方案! 这个仪表板软件适用于28种货币对。它基于我们的两个主要指标(高级货币强度28和高级货币冲动)。它对整个外汇市场提供了一个伟大的概述。它显示高级货币强度值,货币运动速度和28个外汇对在所有(9)时间段的信号。想象一下,当你可以使用图表上的单一指标观察整个市场,以确定趋势和或剥头皮的机会时,你的交易将得到改善 我们已经在这个指标中建立了一些功能,使你更容易识别强势和弱势货币,同时识别和确认潜在的交易。该指标以图形方式显示货币的强势或弱势是增加还是减少,以及它在所有时间段的表现。 增加的新功能是动态市场斐波那契水平,它适应当前的市场条件变化,这是一个已经在我们的高级货币强度28和高级货币冲动指标中使用的成熟的加分项。 在交易时,总是将弱势货币和强势货币配对,这个新指标将帮助你做到这一点。 用户手册:点击这里  https://www.mql5.com/en/blogs/post/708783 特点  显示每个时间段的ACS28和GAP-speed(冲动)的货币强度值。 列:颜色代码以7种颜色显示货币强度:强势
True Direction Oscillator
Muhammad Elbermawi
4.85 (364)
或 (TDO),它是一种使用“ 纯动量 ”原理衡量价格变化率的指数。 当证券价格从 10 上涨到 15 时,价格变化率为 150%,但当它从 15 回落到 10 时,价格变化率仅为 33.3%。这就是为什么像“价格变化率”(ROC) 或“动量”这样的技术分析指标给出的上升价格走势读数高于下降价格走势读数的原因。 TDO 解决了这个问题,以帮助交易者正确读取动量。 重要信息 TDO 用户手册: https://www.mql5.com/en/blogs/post/717970 TDO 常见问题: https://www.mql5.com/en/blogs/post/722015 TDO 视频库: https://www.mql5.com/en/blogs/post/722018 TDO Expert Advisor 示例: https://www.mql5.com/en/blogs/post/731141 TDO 特性 TDO 以百分比计算纯动量,因此它用于比较来自不同市场的不同证券。 (例如:将 EURUSD 与 Gold & Dow Jones Industrial 进行比较)
Introducing the POWER TRADE Indicator Created by a small group of experienced traders with years of profitable experience in the financial markets, the Power Trade Indicator is a plug-and-play trading tool designed to help traders spot high-quality setups with ease and confidence. What It Does: It provides powerful entry signals, profit-taking zones, and rebound areas — giving you a complete view of where price action is most likely to move next. The indicator reacts in real time, al
Dark Support Resistance  is an Indicator for intraday trading. This Indicator is programmed to identify  Support and Resistance Lines , providing a high level of accuracy and reliability. Key benefits Easily visible lines Only the most important levels will be displayed Automated adjustment for each timeframe and instrument Easy to use even for beginners Never repaints, never backpaints, Not Lag 100% compatible with Expert Advisor development All types of alerts available: Pop-up, Email, Push
Top Bottom Tracker MT4
Rodrigo Arana Garcia
Top Bottom Tracker 是一款基于复杂算法的指标,可分析市场趋势并检测趋势的高点和低点 / MT5 版本。 价格将逐步上升,直至达到 500 美元。下一个价格 --> $99 功能特点 无重绘 新数据到来时 该指标不会改变其数值 交易货币对 所有外汇货币对 时间框架 所有时间框架 参数 ==== 指标配置 ==== 配置参数 // 40(值越高,发出的信号越少但越准确) 上水平值 // 80(上水平线的值) 下水平线值 // 20(下水平线值) 指标计算条数 // 3000(您希望指标计算多少条。数值 0 将计算所有条形图的指标) ==== 警报配置 ==== 弹出警报 // true (在终端上发出警报) 电子邮件报警 // true (通过电子邮件报警) 警报时间间隔 // 10 (警报时间间隔,以分钟为单位) 警告 我只在 MQL5.com 上销售我的产品。如果有人联系您向您推销我的产品,那么他们就是骗子,只想要您的钱。 此外,如果您从外部网站购买我的产品,我向您保证,这些产品都是假冒版本,与正版产品效果不同。
PZ Trend Trading
PZ TRADING SLU
4.8 (5)
许多盈利交易者不仅知道如何识别市场趋势,而且也能把握趋势建立后的交易机会。 Pz 趋势交易 指标设计用来在趋势行情中尽可能的赚取利润。 已建立的趋势提供了一揽子交易机会,但大多数趋势交易指标完全忽视了它们,让交易者在趋势行情时完全不知道该如何做!一般趋势指标只通知有关的趋势变化,但根本不足以得到卓越的回报. Pz 趋势交易 指标比一般趋势指标显示多达 20 倍的交易 , 因为它注重所谓的市场时机。它不仅显示当前的市场趋势,也有回调,内柱线的突破和调整。它令您在趋势回调之后介入,安全的柱线内突破金字塔加仓,以及发现潜在的反转,和已知的调整。 趋势改变 一个趋势改变在市场方向变化时发生。趋势变化在图表上用带数字的彩色圆圈显示。蓝色 (1) 信号为上涨开始, 而红色 (1) 信号为下跌开始。趋势变化并非评估当前价格动作的结果, 它意味着交易设置是不定时地。如果您正确使用本指标, 在趋势变化时, 您将将已经入场 (参看下面的调整)。 回调 但凡趋势在运动中,行情上下抖动,盈利者收割利润,且其它参与者入场。趋势回调代表好的买入机会,通常是由主力获利离场导致。如果行情在回调后回归上行, 指标将
适用于 MT4 的 Crypto_Forex 指标“上吊线和倒锤线 Pro”,无需重绘,无延迟。 - “上吊线和倒锤线 Pro”指标是一款非常强大的价格行为交易指标。 - 指标可检测图表上的看涨倒锤线和看跌上吊线形态: - 看涨倒锤线 - 图表上显示蓝色箭头信号(见图)。 - 看跌上吊线 - 图表上显示红色箭头信号(见图)。 - 提供 PC 和移动端提醒。 - “上吊线和倒锤线 Pro”指标非常适合与支撑/阻力位和挂单结合使用。 - 指标具有信息显示功能 - 显示与其关联的外汇对的当前点差和隔夜利息。 - 信息显示还显示账户余额、净值和保证金。 - 信息显示可放置在图表的任意位置 . Click here to see high quality Trading Robots and Indicators! 本产品为独家产品,仅在本 MQL5 网站上提供。
Fibonacci Alert MT4 Pro
Idris Dsapi Douanla
斐波那契警报专业版 - MetaTrader 5 交易指标 斐波那契警报专业版是一款适用于 MetaTrader 5 和 4 的高级指标,能够自动监控图表上的斐波那契水平并实时发送警报。专为在技术分析中使用斐波那契回调的交易者提供专业解决方案。 高级版 FIBO ALERTS PRO 指标提供两个版本,兼容 MetaTrader 4 和 MetaTrader 5,适用于所有外汇经纪商和自营交易公司。 提供完整的用户手册,支持多国语言。 购买后,请发送私信以获取个性化跟进服务并收到详细手册。我们的支持团队将亲自指导您完成工具的设置与优化使用。 联系我们:vopiser77@gmail.com --- 核心功能 1. 多重斐波那契监控 · 同时监控最多 5 个不同的斐波那契对象 · 每个斐波那契对象可自定义名称 · 按斐波那契对象单独配置水平 2. 智能警报系统 · 终端警报:MetaTrader 5 或 4 内部通知 · 推送通知:移动设备警报(通过 MT5/MT4 应用) · 邮件警报:电子邮件通知 · 可自定义冷却时间:避免重复警报(默认 30 分钟) 3.
Prop Firm Sniper
Mohamed Hassan
4.33 (6)
Prop Firm Sniper MT4  is a professional market structure indicator that automatically identifies high-probability BUY and SELL opportunities using BOS and CHoCH analysis. Recommended Timeframes: For backtesting, use the indicator on   M5 or M15   for Gold (XAUUSD), and   M15 or H1   for more volatile Forex pairs such as   GBPUSD, USDJPY, EURGBP , and similar markets. CONTACT ME AFTER PURCHASE TO CLAIM YOUR FREE BONUSES! Prop Firm Sniper  is a professional market structure indicator designed t
Prophet
Andriy Sydoruk
Prophet is a trend indicator. Shows the direction of turning points. Can be used with an optimal risk-to-profit ratio. The arrows indicate favorable moments and directions for entering the market. Uses one parameter for setting (adjust from 1 to 3). The probability of a successful trend is very high. In the course of work, the take-profit is much larger than the stop-loss! Works on all currency pairs and on all timeframes.
Atomic Analyst
Issam Kassas
5 (13)
本产品已针对 2026 年市场进行更新,并针对最新 MT5 版本进行了优化。 价格更新通知: Atomic Analyst 目前价格为 $99 。 接下来的 30 次购买 后,价格将上涨至 $199 。 特别优惠: 购买 Atomic Analyst 后,请发送私信给我,即可免费领取 Smart Universal EA ,并将您的 Atomic Analyst 信号转换为自动交易。 Atomic Analyst 是一款不重绘、不回绘、不延迟的 Price Action 交易指标,专为手动交易、清晰信号和 EA 自动化而设计。 User manual: settings, inputs and strategy.      &   User Manual PDF . 它分析价格行为、强度、动能、多周期方向和高级过滤器,帮助交易者减少噪音,避免弱势交易机会,并做出更有结构的交易决策。 该指标将复杂的市场计算转换为简单的视觉信号、彩色K线、趋势读数、止损水平和多个止盈区域,使交易者能够快速理解并应用于真实市场环境。 主要交易用途: 剥头皮和日内交易: 专为快速决策、清晰箭头、提醒、K线
Mean Reversion Supply Demand Indicator Mean Reversion Supply Demand is the indicator to detect the important supply demand zone in your chart. The concept of supply demand trading relies on the quantity mismatching between buying and selling volumes in the financial market. Typically, supply demand zone serves to predict the turning point. The wave pattern, for any supply demand zone to work as an successful trade, looks like the price must touch the base zone, move away and then return to zone
Legacy of Gann
Pavel Zamoshnikov
4.83 (12)
The indicator very accurately determines the levels of the possible end of the trend and profit fixing. The method of determining levels is based on the ideas of W.D.Gann, using an algorithm developed by his follower Kirill Borovsky. Extremely high reliability of reaching levels (according to K. Borovsky  - 80-90%) Indispensable for any trading strategy – every trader needs to determine the exit point from the market! Precisely determines targets on any timeframes and any instruments (forex, met
Introduction This indicator detects volume spread patterns for buy and sell opportunity. The patterns include demand and supply patterns. You might use each pattern for trading. However, these patterns are best used to detect the demand zone (=accumulation area) and supply zone (=distribution area). Demand pattern indicates generally potential buying opportunity. Supply pattern indicates generally potential selling opportunity. These are the underlying patterns rather than direct price action. T
作者的更多信息
The indicator displays the moment the price reaches an extreme level, including an invisible one (due to screen size limitations). Even small peaks and bottoms are considered extreme points. The level is shown as a trend line extending for a distance from the current candle (bar) to the left. The level has two values: distance (in bars) for the extreme point in a straight line to the left and distance (in bars) from the current candle (bar) to the extreme point (see the screenshots). The indicat
Индикатор показывает расстояние от ближайшего свободного High/Low  текущей (здесь и далее, текущей - в рамках расчетов индикатора) до исследуемой    (опять же - в рамках расчетов индикатора) свечи слева на графике на том же ценовом уровне.        Свободным в данном случае будет являться расстояние больше, чем одна свеча (бар) от текущей          свечи до исследуемой на том же ценовом уровне. Расстояние будет отмечаться пунктирной линией            от High/Low текущей свечи до исследуемой.  М
TickDelta
Andrey Gladyshev
The TickDelta indicator shows the difference in the number of oscillations of the best prices per unit of time. In this case, the unit of time is the specified timeframe (M1, M2, M5, M15, etc.). This value indirectly shows the market "sentiment". Due to the "tick-wise" nature, the indicator is more appropriate for use in scalping strategies. When applied in conjunction with real volumes and monitoring of various instrument charts, it is possible to identify certain reversal setups. In some cases
Индикатор работает только с реальными биржевыми тиковыми данными. Для вычислений используются тики BID ASK и данные с ленты сделок . Индикатор проверялся на бирже CME на инструментах с узким и стабильным спредом ( S&P500, NASDAQ, CLE и др.), пояснения на скринах.   Исполнение индикатора в виде кластера в правой части графика. Каждому ценовому уровню графика выбранного участка между линиями (или отдельной свечи) соответствует полоска кластера, окрашенная в удобный для пользователя цвет (по умол
Индикатор показывает настроение слабой стороны и может использоваться как для внутридневной торговли, так и для скальпинга. Всё будет зависеть от контекста графика.   Этот индикатор строит ценовой график в виде блоков (вертикальных прямоугольников, занимающих три ценовых уровня каждый), чем-то напоминающих ренко бары. Принцип построения основан на определённом изменении уровней BID и ASK (пояснения на скрине). При установке индикатора основной график становится невидимым и на белом поле происх
Fast trade detector
Andrey Gladyshev
Fast Trade Detector (FTD) -  Самый правдивый индикатор, который показывает истинное настроение Большого Игрока.  На бирже есть Игрок, у которого есть всё для того, чтобы быть в первых рядах в книге торговых  приказов (биржевом стакане). Эти сделки как индикатор рыночного настроения сильного игрока. Вы поймёте, что всё не совсем так, как представляли раньше. Вам откроются алгоритмы и стратегии  крупного участника рынка.  Исполнение индикатора в виде гистограммы в подвале графика. Гистограмма п
筛选:
无评论
回复评论