Box Chart
- 指标
- 版本: 1.3
- 更新: 7 十一月 2018
- 激活: 10

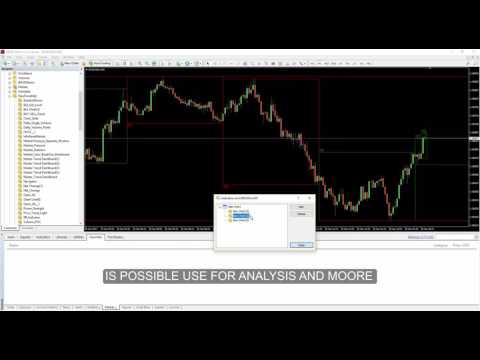
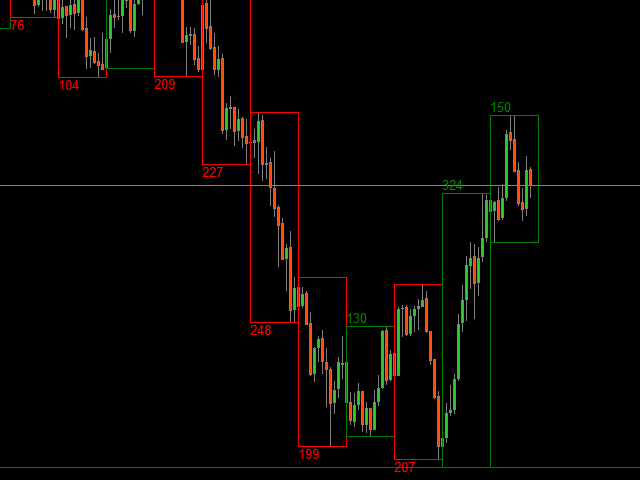
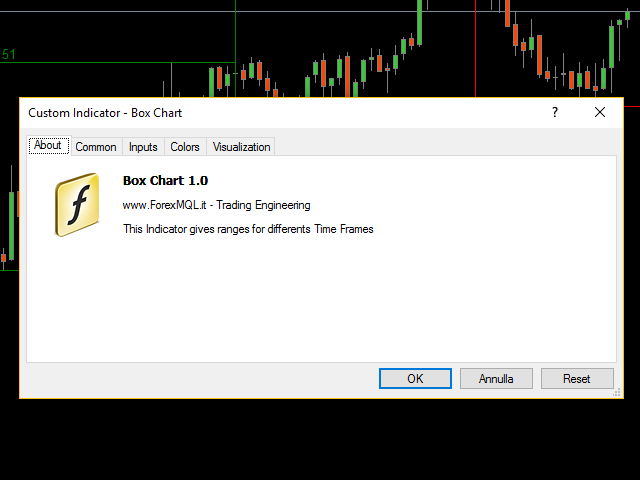
The indicator Box Chart is a very useful analysis tool that allows you to know the value of the range in points.
The range is written in a label and also it is draw in a rectangle.
This indicator works on multi timeframe and you can upload more indicators on same chart to analyze more time frames ranges.
The analysis of the range is done following W. G. Gann school.
The observation of the range on little time frame returns some good information of trend or reversal.
Box Chart is a simple indicator, easy to use and very functional.
All rectangles are customizable in input.
Input Values
- Limit Hystory 0=disabled
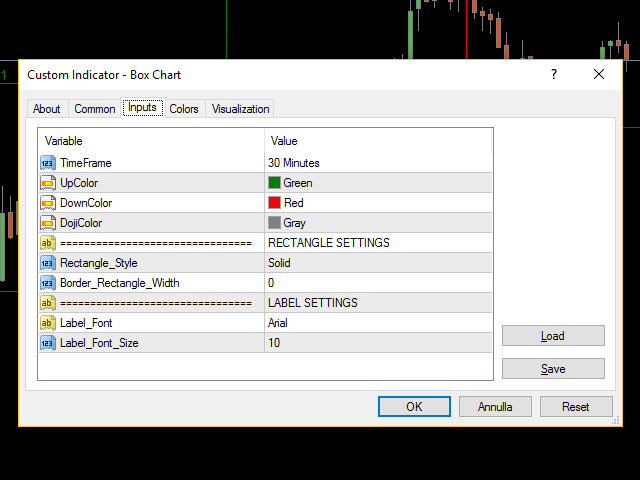
- TimeFrame: TimeFrame reference of the rectangles designed)
- UpColor: rectangle color when the candle closes long
- DownColor: rectangle color when the candle closes short
- DojiColor: rectangle color when the candle closes doji
- RECTANGLE SETTINGS
- Rectangle_Style: the style of rectangles
- Border_Rectangle_Width: the width of rectangles lines
- LABEL SETTINGS
- Label_Font: Font of the range labels
- Label_Font_Size: Font Size of the range labels
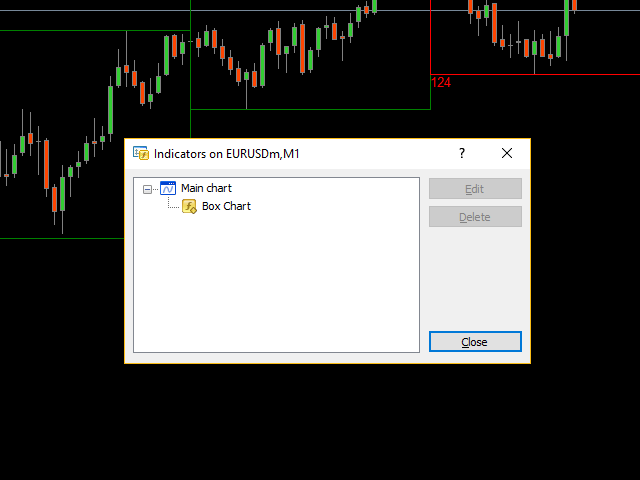

The indicator works perfectly.
Thank you very much and greetings.