Time Range Separator
- 指标
- 版本: 2.1
- 更新: 23 十一月 2018

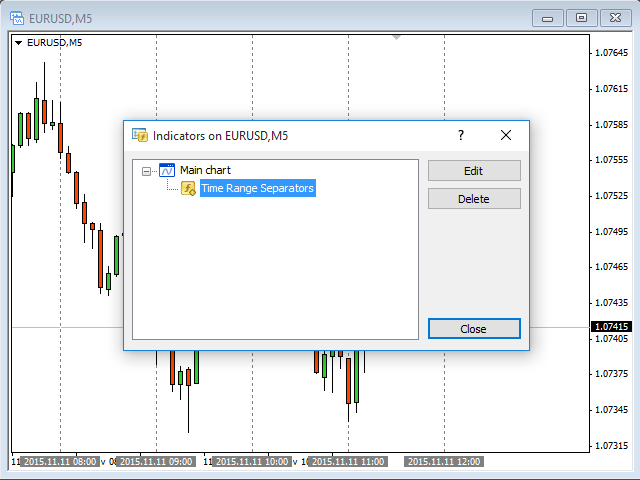
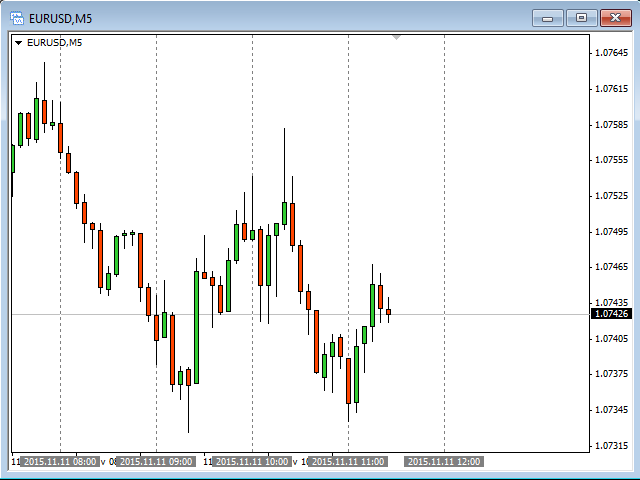
Time Range Separator is a useful tool to display a separator period on your platform.
You could go in the properties of the indicator, select the desired range and that's ALL.
We believe it is a useful and necessary that we wish to share with you for free all our followers.
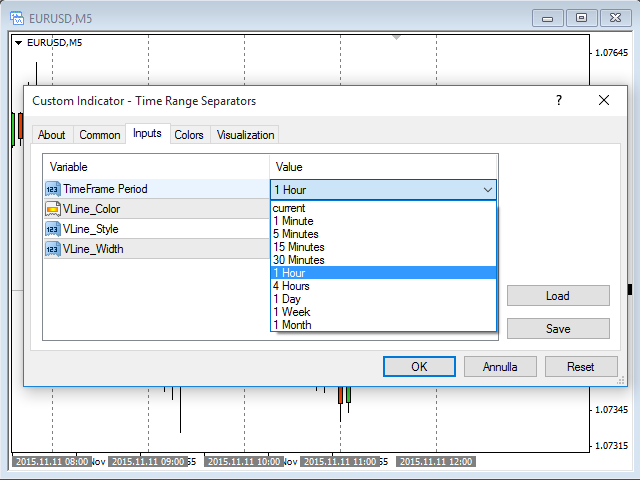
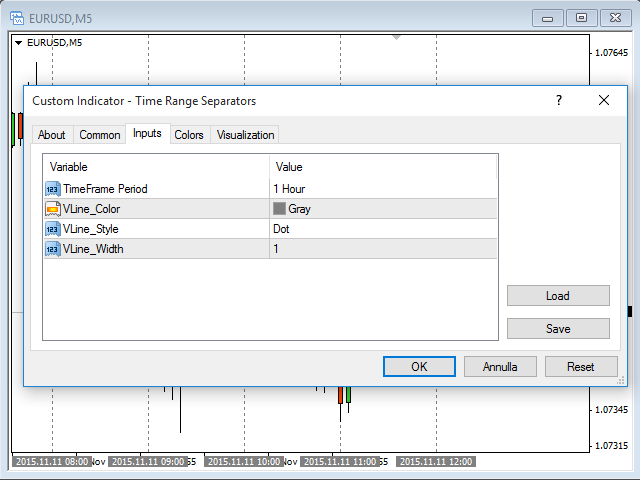
Input Values:
- TimeFrame Period Separator
- GMT_Hour (ex. +1 or -1) to move the lines at Period Time +/- tot hours in input
- Hide_dates to show or hide the datetime on vertical lines
- VLine_Color = Vertical Color Line
- VLine_Style = Vertical Color Style
- VLine_Width = Vertical Line Width
Good trading to all and see you soon.
Same indicator for MT5: https://www.mql5.com/en/market/product/38899


Buena utilidad. Gracias por compartir