• 概述
  • 评论
  • 评论 (8)
  • 新特性

Bid Ask Level

Bid Ask Level is a very simple indicator but, at the same time, very powerful.

Using the logic of the minimum and maximum of the previous periods is able to intercept the important levels of demand and supply.

The indicator permits setting the numbers of history candles to read very important levels in the past and show them in the current chart.

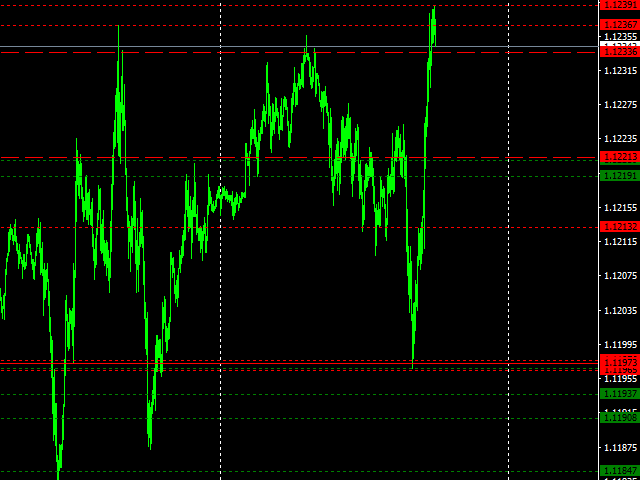
You can see these power levels with horizontal lines designed on the chart.

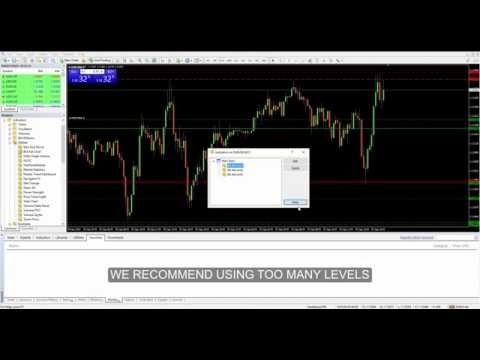
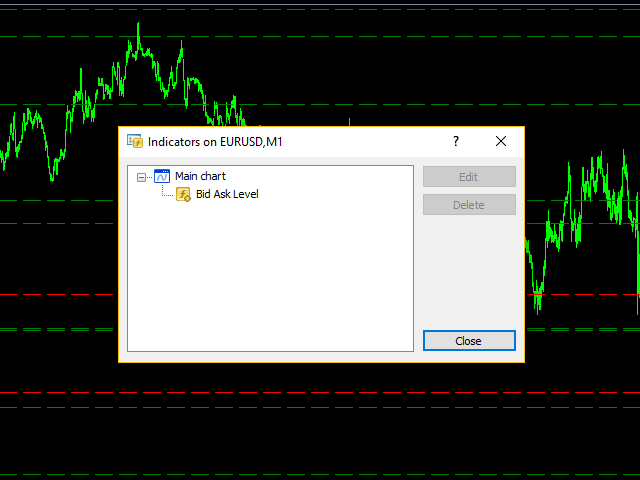
The indicator also permits uploading many different levels (of different timeframes) on the same chart, it is very simple: you can duplicate the indicator on the current chart.

Level Bid Ask is very useful to identify the true levels of support and resistance.
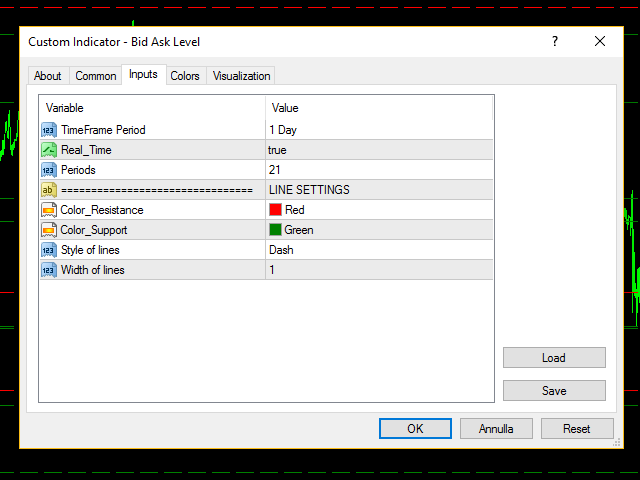

Inputs

  • TimeFrame Period = period where the indicator search levels
  • Real_Time (true/false) shows the level on the current candle (0) or begin from the last closed candle (1)
  • Periods = number of candles
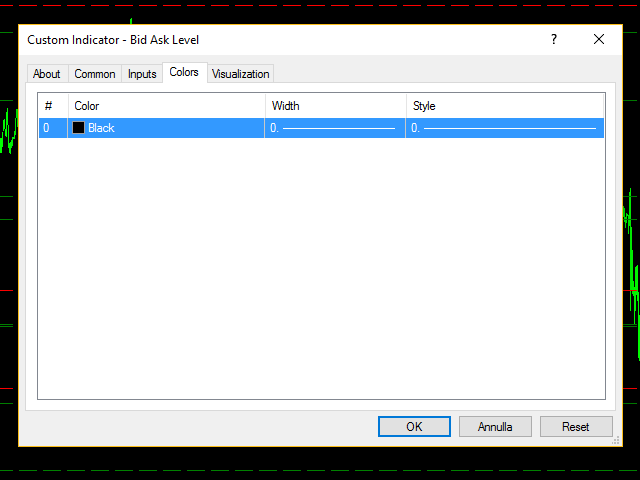
  • LINE SETTINGS
    • Color_Resistance (lines color)
    • Color_Support (lines color)
    • Style of lines
    • Width of lines
推荐产品
Dear Trader It is my pleasure to introduce to you my tool called the " Forex Sniper Indicator" . The major aim of this tool is to help serious traders and investors in all type of Financial Markets to catch price next movement right at the moment the price direction is about to change. This tool can be used to snipe the price direction in both down trend, uptrend and ranging markets. This tool can be used as the stand alone tool though it may be combined with other tools as well. My goal is to h
這個獨特的自動趨勢線繪製指示器可在所有時間範圍內運行,可幫助您輕鬆交易短期趨勢反轉以及短期趨勢突破,表明市場上的資產更雄厚。 它獨特地使您可以儘早進入沉重的揮桿動作。 輸入包括: -Max Candles回顧趨勢線 -線型和顏色 -到外帶和帶週期的最大距離 -當確認蠟燭或價格收盤時,自動重新繪製趨勢線偏離樞軸的選項較低,較低或較高的高位(雙底低位和高支撐位)和最大蠟燭數以進行重新繪製。 -4個換行選項: 1)價格跌破線時刪除 2)不要刪除 3)燭線超出界限時刪除 4)在趨勢關閉時刪除 This unique auto trend line drawing indicator works on all time frames which can help you to easily trade short term trend reversals as well as  as well as short term trend breakouts indicating the stronger asset in the market. It uniquely a
为您介绍MQL4的Donchian通道指标,这是一个强大的技术分析工具,旨在提升您的交易成功率。该指标由四条线组成,代表了在指定时期内价格运动的上限和下限。 通过Donchian通道指标,您可以轻松识别市场潜在的突破和反转。上线显示指定时期内的最高点,而下线代表最低点。这两条线之间的空间形成一个通道,为您提供了有关资产交易价格范围的有价值见解。 但这还不是全部 - 我们进一步改进了这个令人难以置信的指标。我们的修改允许您按照一定百分比(表示为'shadowTop'和'shadowBottom')减小通道宽度。通过缩小通道,您可以更敏锐地感知价格波动,并准确定位入场和出场点。 无论您是经验丰富的交易者还是初学者,带有减小通道宽度的Donchian通道指标都是您交易工具箱中必备的工具。它能够让您基于市场波动和价格行为做出明智的决策。 不要错过将您的交易推向新高度的机会。体验带有减小通道宽度的Donchian通道指标的强大功能,释放您的交易潜力吧。
This system never paints.   This system created by using Envolpes bands and reverse bar count.   This indicator is only working in M5 period.   This system is for long term and profitable.   Signals are shown as arrows. as an optional limit orders.   You can set a voice alarm or email notification.   You can fins our other products from link : https://www.mql5.com/en/users/drbastem/seller   Also, you can ask all your questins from email : haskayafx@gmail.com or mobile : +90 530 867 5076 or @Meh
My Point MT4
Claudia Ramona Angerer
4 (1)
Diagnosis of major and minor pivot Trend detection with many signals Can be used in all symbols Can be used in all time frames Settings: Back Show: The number of candles it displays If you need any adjustments, or have any questions or suggestions, message me How to trade: Blue: sell signal Red: buy signal Blue and red at the same time: no signal Exit signal: Opposite signal
WhaleFinder MT4
Kazuya Yamaoka
Considering the main theories of Forex (Dow Theory, support lines, chart patterns, and Fibonacci retracements), It tells you the price range where whales (large investors) are likely to appear. You can trade at the price points that professionals also aim for. You no longer have to warry about where to aim next. We are live-streaming the actual operation of the system. Please check for yourself if it is usable. Please check it out for yourself. https://www.youtube.com/@ganesha_forex We do no
Trend Lines
Rohlan Samino
This indicator is suitable for seeing trends and determining the time to open a position. It is equipped with a Stop Loss position. Easy to use. Just watch the arrows provided. Indicator parameters Shift - the number of bars used for the indicator shift to Right." Step Point per Period - the number of pips for down or Up trend lines" Time Frame - Calculate @ this Time Frame." Max_Bar - the number of bars used for calcuulate indicators (if '0' then All bars to calcuulate)." Alert_On - On or Off
Chart patterns scanner
Jan Flodin
4.67 (6)
这个多时间框架和多品种指标识别双顶/底,头     &     肩膀、三角旗/三角形和旗形图案。也可以仅在颈线/三角形/旗杆突破发生时设置警报(颈线突破 = 顶部/底部和头肩的确认信号)。 该指标也可用于单一图表模式。请在产品的     博客 。     结合您自己的规则和技术,该指标将允许您创建(或增强)您自己的强大系统。 特征 可以同时监控您的市场报价窗口中可见的所有交易品种。将该指标仅应用于一张图表,并立即监控整个市场。 可以监控从 M1 到 MN 的每个时间范围,并在模式被识别或颈线突破(顶部/底部和头肩)时向您发送实时警报。 支持所有 Metatrader 原生警报类型。 可以使用 RSI 作为趋势过滤器来正确识别潜在的逆转。 该指示器包括一个交互式面板。当单击一个项目时,将打开一个带有相关代码和时间范围的新图表。 该指标将信号写入一个文本文件,智能交易系统 (EA) 可以使用该文件进行自动交易。比如 这个产品 。您可以在     博客 。 输入参数 输入参数的描述和解释可以在 这里 找到。 重要的 请注意,由于具有多功能性,既不会在安装指标的图表上绘制买卖建议,也不会绘
Contact me for instruction, any questions and a trial version! Introduction A flag can be used as an entry pattern for the continuation of an established trend. The formation usually occurs after a strong trending move. The pattern usually forms at the midpoint of a full swing and shows the start of moving. Bullish flags can form after an uptrend, bearish flags can form after a downtrend. Flag Pattern Scanner Indicator It is usually difficult for a trader to recognize classic patterns on a ch
Forex Trend Detector
Lachezar Krastev
5 (7)
SHOCK DEAL! --> BUY Forex Trend Detector  with -$260 OFF and GET a BONUS EA: Trend Matrix EA (or EA by your choice)! <-- SHOCK DEAL! NOTE: Forex Trend Detector PROMO price: $267 (The next price $497) - The offer ends soon! Click here to read more about Trend Matrix EA and the SHOCK DEAL promotion! For Settings, Instructions and LIVE Results Click Here! Forex Trend Detector is an automated trading strategy which is developed to follow the money… or "follow the market impulse" resulting in reliab
Tactical Trends
Guillermo Pineda
IF YOU PURCHASED THE INDICATOR -> Send me a message for bonus  settings parameters that WORKS ! and TACTICAL TREND EA for free ! The TACTICAL TREND INDICATOR is the greatest trend indicator on the market; it works on all time frames and assets and was created after 6 years of experience in the FX and other markets. Many trend indicators on the internet are incomplete, do not help, and are difficult to trade, but the   TACTICAL TREND   Indicator is different; it shows the signal to buy or sell,
Signal Eskiya
Vitalii Zakharuk
Signal Eskiya, in addition to channel lines, reflects entry signals in the form of arrows. Trading strategies using the channel indicator belong to the classic methods of technical analysis, are easy to execute, and therefore available even to beginners. Price ranges work equally well on any trading assets and timeframes, they can be used both independently and with additional confirmation from oscillators and market volumes. American traders say: “Trend is your friend”, which means “Trend is
Th3 BarPlay Signals Mt4
Nnamdi Kennedy Ifeorah
这是一种基于价格行为的策略,称为 3Bar_Play,它基于 3Bar 烛台形态。在弹出买入/卖出信号箭头之前,添加了额外的指标用于过滤和确认。它可以在上升趋势、下降趋势或横向市场中交易。 添加的指标包括: 随机 - 动量 Fisher - 趋势 ATR - 波动率也明确定义了信号箭头底部的止损位置(使用 ATR 止损方法)。 具有良好风险管理的风险回报比可以从 1:1 到 1:4 不等。 买入 - 当买入信号在 2 个看跌柱和 1 个看涨柱后弹出时。 卖出 - 当卖出信号在 2 个看涨柱和 1 个看跌柱后弹出时。 附加功能 用于在图表上打开/关闭信号但不发出警报的切换按钮。 设置面板上的可调参数(下载时的首选设置)。 启用电子邮件/推送通知,在您离开屏幕时提醒您注意信号。 一个非常简单易用的指标,适用于所有市场。灌输纪律并帮助交易者专注于流程。 适合在止损和获利安置中苦苦挣扎的新手/交易者。专业交易员也不例外。 24 小时支持。 注意事项 如果指标未能出现在您的图表屏幕上,您需要联系我并安装自定义鱼指标。
ReSu mt4
Daniel Opoku
The Wamek Support and Resistant (WSR) Indicator is a remarkable tool that stands out in the world of technical analysis. It sets itself apart by cleverly combining price action and leading indicators to delineate support and resistance levels with a high degree of accuracy. Its unique feature is its adaptability; users can fine-tune the indicator by adjusting input parameters, enabling them to create customized support and resistance levels that suit their trading strategies. Notably, one of WSR
这个多时间框架和多符号供需区仪表板指示器在价格达到供需区时发送警报。也可以使用它来提醒常规的双顶/双底而不是区域。它可以用于从 M1 到 MN 的所有时间范围。可以使用 RSI、背离(MACD、RSI 或 Awesome)和蜡烛图过滤器(pin bar、吞没、镊子和晨星/夜星)来仅过滤掉最强的设置。结合您自己的规则和技术,该指标将允许您创建(或增强)您自己的强大系统。 在产品博客 的末尾,您将能够下载示例智能交易系统 (EA) 的源代码,该示例使用 iCustom() 函数从指标获取交易信号。尽管 EA 功能齐全,但主要目的是使用代码并将其粘贴到您自己开发的 EA 中或将您自己的额外进入/退出逻辑添加到此 EA 中。鉴于我的时间有限,我将无法提供任何编程支持。我很抱歉。 特征 这 足以放置一个指标图表上,你会出现在仪表板的任何新的信号接收警报。支持所有 Metatrader 原生警报类型。 可以选择要在仪表板中显示的时间范围。 在仪表板内持续执行发散等级排序。可以禁用此排序,以便更轻松地找到特定符号。然后,交易品种将按照它们在交易品种参数中输入的相同顺序显示,或者按照它们在市场报
This system created by using  Stochastic oscillator and moving average.  Entrance value and take profit values can be seen by system.  This is system for Long term and profitable. this system can be used for 15 minutes time frame. This system is not  repaints.         This system is for Long term and profitable.  Signals are shown as arrows. as an optional,  you can set a voice alarm or email notification  You can fins our other products from link : https://www.mql5.com/en/users/drbastem/seller
Super volumes
Yerzhan Satov
4 (1)
外汇和二元期权的箭头指示器是基于蜱数量. 与许多交易量指标不同,"超级交易量"指标计算看涨和看跌交易量,并根据其中任何一个交易量的优势给出信号。 如果,比如说,目前在这个范围内有看涨的优势,那么信号将是买入。 或者,如果占主导地位的是看跌量,那么,相应地,信号将是卖出。 在"成交量"变量的指标设置中,您可以增加或减少信号的频率。 值越高,信号越少。 默认情况下,剩下"2"。 在"HistoryBars"变量中,您可以增加历史记录上的信号数量。 默认情况下留下500。 不建议留下超过这个数字。 因为更大的数字将加载终端。 那么,在设置的最后一部分中,您可以选择更改箭头与蜡烛的距离,箭头的厚度,代码和颜色。 信号和箭头根本不画!!! 即使在改变时间框架之后。 严格建议在固定图表上的箭头后使用指标信号进行交易。 信号蜡烛关闭后,它们被彻底固定.
这个多时间框架和多品种指标扫描吞没和镊子形态。 特征 可以同时监控您的市场报价窗口中可见的所有交易品种。将该指标仅应用于一张图表,并立即监控整个市场。 监控从 M1 到 MN 的每个时间范围,并在识别出吞没或镊子形成时向您发送实时警报。支持所有 Metatrader 原生警报类型。 使用 RSI 作为趋势过滤器,以正确识别潜在的逆转。 该指示器包括一个交互式面板。请参阅单独的屏幕截图。 输入参数 输入参数的描述和解释可以在 这里 找到。 重要的 我强烈建议将指标放在干净(空)的图表上,上面没有任何其他可能干扰扫描仪的指标。另请注意,由于具有多功能性,图表上不会绘制买入/卖出建议或线条和箭头。 我强烈建议将指标放在干净(空)的图表上,上面没有任何其他可能干扰扫描仪的指标。另请注意,由于具有多功能性,图表上不会绘制买入/卖出建议或线条和箭头。
The indicator scans for TD Sequential signals in multiple timeframes for the all markets filtered and shows the results on Dashboard. Key Features Dashboard can be used for all markets It can scan for signals on MN1, W1, D1, H4, H1, M30, M15 ,M5, M1 timeframes Parameters UseMarketWatch: Set true to copy all symbols available in market watch MarketWatchCount : Set the number of symbols that you want to copy from the market watch list. CustomSymbols: Enter the custom symbols that you want to be a
This is a simple and efficient indicator based on market logic. The indicator creates a range chosen by a trader. Trader selects only two parameters. The first one is the number of candles that define the frame. The second one is the number of candles needed for confirmation frame. The indicator shows all situations in history and works with the actual movement of the market. The indicator works on all timeframes . You are not limited by use of different timeframes, the indicator is able to adap
The High Low indicator is a very simple indicator that has the task of showing us the minimum and maximum levels of the time frame that we wish to underline. This indicator also has the ability to show you minimum and maximum price levels of institutional periods as a level, such as quarterly, half-yearly and annual. We believe these minimum and maximum levels are the true key market levels and therefore a correct visualization on the graph is able to show the important price levels.
Radar Fibo 123
Carlos Augusto Cedeno Rocha
https://www.mql5.com/es/signals/1654340 使用此工具,它将帮助您自动运行获胜的 SL 形成一个斐波那契雷达斐波那契 123 策略,以最少的彩票入场作为支撑和阻力 对支撑和阻力中的一切都采取积极的态度。 Shǐyòng cǐ gōngjù, tā jiāng bāngzhù nín zìdòng yùnxíng huòshèng de SL xíngchéng yīgè fěi bō nà qì léidá fěi bō nà qì 123 cèlüè, yǐ zuìshǎo de cǎipiào rù chǎng zuòwéi zhīchēng hé zǔlì duì zhīchēng hé zǔlì zhōng de yīqiè dōu cǎiqǔ jījí de tàidù. 他应用自动关闭和自动锁定。您正在寻找每月最低和最高收入的地方。 次月活跃。 Tā yìngyòng zìdòng guānbì hé zìdòng suǒdìng. Nín zhèngzài xúnzhǎo měi yuè zuìdī hé zuìgāo shōur
KT Tether Line MT4
KEENBASE SOFTWARE SOLUTIONS
The KT Tether Line is a trend-following tool consisting of three indicators that work together to generate trading signals. It can correctly identify market trends while signaling trade entries. It was first introduced by Bryan Strain in the Stock & Commodities magazine in 2000 in "How to get with the trend and out at the end." The Concept When a market trend is confirmed, the most challenging part is determining the timing of the entries. This indicator alerts you to potential trend reversal
Up and Down
Vladimir Serebryakov
Up&Down EA交易根据市场上下波动的原理进行交易。因此,当市场向任何方向移动时,都会增加进入巨魔的机会并获得最大的利润。 Up&Down Expert Advisor具有Martingale工具,可以加快输入拖钓的过程,如果需要,可以更改或完全关闭其系数。在 Up&Down 顾问的操作过程中 ,将确定所有交易的总利润,有最高利润目标,最低利润目标是根据用户要求设置的。另外,Up&Down顾问有一个可配置的交易计时器,该顾问在此时间段内将不会交易。有一些按钮可以紧急关闭买卖交易。 图表窗口的右上角显示了当前未平仓交易的数量。 输出 参数 获利–最大获利水平 交易时间-开启不交易顾问的时间 开始交易-非交易时间开始 停止交易-时间结束后不交易 步骤一-达到开仓交易限制的第一步,在买卖数量相等后,激活第二步 第二步-第二步 第三步-第三步 第四步-第四步 尾随标志-拖钓模式 追踪开始-拖钓的开始是最低利润 追踪止损-停止拖钓 ting-Mode模式 很多乘法-ting乘法 批量开始-初始尺寸 小数位-将符号四舍五入 幻数-顾问用来区别其职位的个人数字 睡眠页面-滑动页
Waddah Attar Explosion MT4
Do Thi Phuong Anh
5 (1)
The Waddah Attar Explosion (WAE) indicator is a potent tool in Forex trading, offering buy, sell, exit buy, and exit sell signals. It assesses trends as trend power and momentum as explosion power. Trend Direction: - Green bars indicate a bullish trend. - Red bars indicate a bearish trend. Signal Line: - A line serves as a threshold for momentum. Buy Trade Setup: **Entry:** Go long when a green bar crosses above the threshold. Place a stop loss below the entry candle. **Exit:** Close the
Strong Volume Trend
Muhammed Emin Ugur
The Strong Volume Trend  MT4 indicator is a powerful tool designed to help traders identify and capitalize on significant volume trends in the financial markets. With its advanced algorithm, this indicator accurately detects the strength and direction of volume movements, allowing traders to make informed trading decisions. Features: Volume Strength Analysis: The indicator analyzes the volume data and identifies strong volume trends, helping traders spot potential market reversals, breakouts, or
Indicador FimatheChannels
Diego De Freitas Justo
https://youtu.be/Cz76GayNqtM  Com esse indicador você não precisa ficar fazendo marcações manuais para encontrar seus canais e níveis de negociação. O channels faz isso por você. Veja o vídeo :  Com os canais definidos o trade pode operar seus rompimentos  Analisando seu canal de referencia e zona neutra com base na tendencia e nos rompimentos. Tem uma calibragem nas opções onde você consegue estreitar ou alargar mais o canal. Pode definir as cores automáticas das linhas, seus estilos e tamanhos
This indicator prepared by using 311,1298 days Haskaya Trend Bandse and Calculates the strand ADX.    This system can be used for 5M time frame.     This system is for Long term and profitable.    Signals are shown as arrows. as an optional,    you can set a voice alarm or email notification    You can fins our other products from link : https://www.mql5.com/en/users/drbastem/seller    Also, you can ask all your questins from email : haskayafx@gmail.com or mobile : +90 530 867 5076 or @Meh
OBTE = Order Block Type I OBTI Indicator MT4 is the most accurate and customizable indicator on the market. It was developed to facilitate the analysis of operations based on candlestick patterns and supply-demand zones. These zones are possible movement reversal points. For this indicator is generated by the order block of smart money concept. Input parameters: 1. Multiple timeframes : M1 M5 M15 M30 H1 H4 D1 W1 MN1 2. Default input: H1 H4 D1 W1 MN1 3. Notifications / Send Emails / Notificatio
The indicator monitors the MACD trend in multiple timeframes for a specific market. No more shifting in between charts to check the trend direction while trading. Key Features Indicator can be used for all markets Monitors every timeframe, from M1 to MN Able to move display label on chart by single click Indicator Usage The dashboard appears to the left and upper part of the chart when attached. The shell encapsulating a timeframe goes red on a down trend, green on an up trend. If the defaul
该产品的买家也购买
目前八折优惠! 对任何新手或专家交易者来说都是最好的解决方案! 这个仪表板软件适用于28种货币对。它基于我们的两个主要指标(高级货币强度28和高级货币冲动)。它对整个外汇市场提供了一个伟大的概述。它显示高级货币强度值,货币运动速度和28个外汇对在所有(9)时间段的信号。想象一下,当你可以使用图表上的单一指标观察整个市场,以确定趋势和或剥头皮的机会时,你的交易将得到改善 我们已经在这个指标中建立了一些功能,使你更容易识别强势和弱势货币,同时识别和确认潜在的交易。该指标以图形方式显示货币的强势或弱势是增加还是减少,以及它在所有时间段的表现。 增加的新功能是动态市场斐波那契水平,它适应当前的市场条件变化,这是一个已经在我们的高级货币强度28和高级货币冲动指标中使用的成熟的加分项。 在交易时,总是将弱势货币和强势货币配对,这个新指标将帮助你做到这一点。 用户手册:点击这里  https://www.mql5.com/en/blogs/post/708783 特点  显示每个时间段的ACS28和GAP-speed(冲动)的货币强度值。 列:颜色代码以7种颜色
TrendMaestro
Stefano Frisetti
5 (2)
note: this indicator is for METATRADER4, if you want the version for METATRADER5 this is the link: TRENDMAESTRO recognizes a new TREND in the bud, he never makes mistakes. The certainty of identifying a new TREND is priceless. DESCRIPTION TRENDMAESTRO identifies a new TREND in the bud, this indicator examines the volatility, volumes and momentum to identify the moment in which there is an explosion of one or more of these data and therefore the moment in which prices have strong probability of f
TPSpro RFI Levels
Roman Podpora
5 (13)
Reversal First Impulse levels (RFI) - are the maximum volume levels/areas that turn the market around, so they play a critical role in future trading decisions. The logic behind the movement of any chart is that the price moves from the first impulse level (RFI) to the first impulse level (RFI) of the past trend. The first impulse level (RFI) is the most powerful level during a trend reversal, which forms a reversal zone. The first impulse level from the reversal of the previous movement is also
Quantum Trend Sniper Indicator MT4
Bogdan Ion Puscasu
4.58 (38)
介绍   量子趋势狙击指标 ,突破性的 MQL5 指标,正在改变您识别和交易趋势反转的方式!由拥有超过13年交易经验的资深交易员团队开发,     量子趋势狙击指标   旨在通过其创新的方式以极高的准确度识别趋势反转,将您的交易之旅推向新的高度。 ***购买量子趋势狙击指标,即可免费获得量子突破指标!*** 当量子突破指标识别出趋势反转时,它会向您发出警报和信号箭头,并建议您三个止盈水平。 它既适合新手交易者,也适合专业交易者。 量子 EA 通道:       点击这里 MT5版本:       点击这里 建议: 时间范围:  所有时间范围。为了获得最佳结果,我们建议在 M15、M30 和 H1 时间范围内使用它。 货币对:欧元兑美元、英镑兑美元、澳元兑美元、欧元兑英镑, EURAUD, XAUUSD 账户类型:ECN、Raw 或 Razor,点差极低 经纪时间:任意 经纪商:IC Markets、Pepperstone with Raw 和 Razor 的点差最低 建议止损:50 点 建议止盈水平:20 点、50 点和 1
Advanced Currency Strength28 Indicator
Bernhard Schweigert
4.9 (661)
目前26%的折扣 任何新手或专家交易者的最佳解决方案! 这个指标是一个独特的、高质量的、可负担得起的交易工具,因为我们纳入了一些专有的功能和一个新的公式。只需一个图表,你就可以读出28个外汇对的货币强度!想象一下,你的交易将如何得到改善,因为你的交易是在你的手中进行的。想象一下,你的交易将如何改善,因为你能够准确地确定新趋势或剥头皮机会的触发点? 用户手册:点击这里  https://www.mql5.com/en/blogs/post/697384 这是第一本,原版的! 不要买一个毫无价值的崇拜者的克隆品。 特别的 子窗口中的箭头显示强劲的货币势头GAP将指导你的交易! 当基础货币或报价货币处于超卖/超买区域(外盘斐波那契水平)时,在个人图表的主窗口中出现警告信号。 当货币力量从外围区间回落时,回撤/反转警报。 十字星模式的特别警报 可选择多个时间框架,以快速查看趋势! 货币强度线在所有的时间框架中都非常平稳,当使用较高的时间框架来识别总体趋势,然后使用较短的时间框架来确定精确的入口时,效果非常好。你可以根据自己的意愿选择任何时间框架。每个时间框架都由其自身进
Atomic Analyst
Issam Kassas
5 (2)
First of all Its worth emphasizing here that this Trading Indicator is   Non-Repainting ,   Non-Redrawing   and   Non-Lagging   Indicator, Which makes it ideal from both manual and robot trading.  The Atomic Analyst  is a PA Price Action Indicator that uses Strength and Momentum of the price to find a better edge in the market. Equipped with Advanced filters which help remove noises and false signals, and Increase Trading Potential. Using Multiple layers of complex Indicators, the Atomic Anal
TPSproTREND PrO
Roman Podpora
5 (15)
TPSpro TRENDPRO  - is a trend indicator that automatically analyzes the market and provides information about the trend and each of its changes, as well as giving signals for entering trades without redrawing! The indicator uses each candle, analyzing them separately. referring to different impulses - up or down impulse. Exact entry points into transactions for currencies, crypto, metals, stocks, indices!  - To maximize the potential and learn how to trade using this indicator, read the full des
Quantum Breakout Indicator PRO
Bogdan Ion Puscasu
4.96 (25)
介绍     Quantum Breakout PRO   ,突破性的 MQL5 指标,正在改变您交易突破区域的方式!   Quantum Breakout PRO 由拥有超过 13 年交易经验的经验丰富的交易者团队开发,旨在通过其创新和动态的突破区域策略将您的交易之旅推向新的高度。 量子突破指标将为您提供带有 5 个利润目标区域的突破区域的信号箭头,以及基于突破框的止损建议。 它既适合新手交易者,也适合专业交易者。 量子 EA 通道:       点击这里 MT5版本:   点击这里 重要的!购买后请私信我领取安装手册。 建议: 时间范围:M15 货币对:GBPJPY、EURJPY、USDJPY、NZDUSD、XAUUSD 账户类型:ECN、Raw 或 Razor,点差极低 经纪商时间:GMT +3 经纪商:IC Markets、Pepperstone with Raw 和 Razor 的点差最低 规格: 不重漆! 最多 5 个建议利润目标区域 建议止损水平 可定制的盒子。您可以设置自己的 Box Time Start 和 Box Time E
Gann Swing Structure
Kirill Borovskii
5 (1)
This indicator is based on the mathematics of the great trader W.D. Ganna. With its help, you can easily find strong levels by analyzing swings to find the optimal entry point. The indicator works on all instruments and all timeframes. The indicator is fully manual and has control buttons. All you need to do is press the NEW button, a segment will appear, which you can place on any movement, swing or even 1 candle that you want to analyze. By placing the segment, press the OK button. A grid (th
Weis Wave with Alert
Trade The Volume Waves Single Member P.C.
4.79 (19)
Rental/Lifetime Package Options and Privileges' * For optimum results the yearly or lifetime package is suggested due to live training and Discord  channel trading with the  creator! Rent Monthly Six Months   Yearly/Lifetime Weis Wave with Speed with Alert+Speed Index x x x Manual  x x x Quick Set up Video x x x Blog x x x Lifetime Updates x x x Setup and Training Material x x Free Rectangle Break Alert Tool      x Discord Access Channel "The SI traders" x 2-hour live methodology traini
Advanced Supply Demand
Bernhard Schweigert
4.92 (309)
现在优惠 33%! 任何新手或专业交易者的最佳解决方案! 该指标是一款独特、高质量、且价格合理的交易工具,因为我们已经整合了许多专有功能和新公式。 依据此更新,您将能够显示双重时间帧区域。 您不仅可以显示一个较高的时间帧,还可以同时显示图表时间帧,加上更高的时间帧:显示嵌套时区。 供需双方所有交易者都会喜欢它。 :) 重要信息披露 高级供需的最大潜力,请访问 https://www.mql5.com/zh/blogs/post/720245   想象您的交易如何得以改善,是因为您能够精准定位入场或目标位吗? 构建于新的底层算法,它可以更轻松地识别出买卖双方之间的潜在失衡。 这是因为它以图形方式展示供需最强劲区域,及其过去的表现(显示旧区域)。 这些功能旨在帮助您更轻松地发现最佳入场区域和价位。 现在您可以针对您的交易品种和时间帧来优化和编辑区域强度! 高级供需指标适用于所有产品和时间帧。 它是一个新的公式,非常新的功能是两个区域强度函数可由用户输入进行调整! 这在交易中是一大优势。 当您学习如何使用专有功能,例如带有价格游离最小 X 因子的区域强度时,您能够判断该区域强劲与否。 供
Gann Price Level
Kirill Borovskii
The indicator is designed to work on any trading platform. The program is based on proprietary algorithms and W.D.Ganna's mathematics, allowing you to calculate target levels of price movement based on three points with the highest degree of certainty. It is a great tool for stock trading. The indicator has three buttons: NEW - call up a triangle for calculation. DEL - delete the selected triangle. DELS - completely remove all constructions. The probability of achieving the goals is more than 80
Scalper Inside PRO
Alexey Minkov
4.74 (54)
GET 10% OFF NOW! Last 2 copies at current price! An exclusive indicator that utilizes an innovative algorithm to swiftly and accurately determine the market trend. The indicator automatically calculates opening, closing, and profit levels, providing detailed trading statistics. With these features, you can choose the most appropriate trading instrument for the current market conditions. Additionally, you can easily integrate your own arrow indicators into Scalper Inside Pro to quickly evaluate t
FX Power MT4 NG
Daniel Stein
5 (7)
通过 mql5 和 Telegram 上 的晨间简报获取每日市场更新,包括详细信息和屏幕截图 ! FX Power MT4 NG 是我们长期以来非常受欢迎的货币强度计算器 FX Power 的下一代产品。 这款下一代强度计算器能提供什么?您所喜爱的原版 FX Power 的所有功能 附加功能 黄金/XAU 强度分析 更精确的计算结果 可单独配置的分析周期 可自定义计算限制,以获得更好的性能 为希望查看更多信息的用户提供特殊的多实例设置 无尽的图形设置,可在每个图表中设置您最喜欢的颜色 无数的通知选项,让您再也不会错过任何重要信息 采用 Windows 11 和 macOS 风格的全新圆角设计 神奇的移动指标面板 FX Power 主要功能 所有主要货币的完整强势历史 所有时间框架内的货币强弱历史 所有经纪商和图表的计算结果完全相同 100% 可靠的实时计算 -> 无重绘 可通过下拉列表选择分析时段 通过自定义模式单独配置分析时段 可在一个图表中使用多个实例 可移动 FX Power 显示屏(通过拖放) 适用于高分辨率 QHD、UHD 和 4K 显示器 自动终端配置 针对平板电脑
How to use Pair Trading Station Pair Trading Station is recommended for H1 time frame and you can use it for any currency pairs. To generate buy and sell signal, follow few steps below to apply Pair Trading Station to your MetaTrader terminal. When you load Pair Trading Station on your chart, Pair Trading station will assess available historical data in your MetaTrader platforms for each currency pair. On your chart, the amount of historical data available will be displayed for each currency pai
Currency Strength Exotics
Bernhard Schweigert
4.88 (33)
目前8折优惠! 对任何新手或专家交易者来说都是最好的解决方案! 这个指标是专门用来显示任何符号的货币强度,如异国货币对、商品、指数或期货。它是同类产品中的第一个,任何符号都可以添加到第9行,以显示黄金、白银、石油、DAX、US30、MXN、TRY、CNH等的真实货币强度。这是一个独特的、高质量的、负担得起的交易工具,因为我们已经纳入了一些专有的功能和一个新的公式。想象一下,你的交易将如何改善,因为你能够准确地确定新趋势或剥头皮机会的触发点? 用户手册:点击这里   https://www.mql5.com/en/blogs/post/708876 它适用于所有时间框架。你将很快能够看到TREND! 根据新的基础算法设计,它使识别和确认潜在交易变得更加容易。这是因为它以图形方式显示了8种主要货币和一种符号的强弱。 该指标显示了8种主要货币(澳元加元瑞士法郎欧元英镑日元新西兰美元)的强弱线,再加上一个符号! 该指标显示了符号的真实价值。例如:对于XAUUSD(黄金):价格以美元报价。如果黄金在上涨,你怎么能知道是黄金的强势还是美元的弱势?只有当黄金走强时,我们才会进行
TPA True Price Action indicator reveals the true price action of the market makers through 100% non-repainting signals (except early signals mode) strictly at the close of a candle! TPA shows entries and re-entries, every time the bulls are definitely stronger than the bears and vice versa. Not to confuse with red/green candles. The shift of power gets confirmed at the earliest stage and is ONE exit strategy of several. There are available now two free parts of the TPA User Guide for our custo
GOLD Impulse with Alert
Bernhard Schweigert
4.56 (9)
这个指标是我们2个产品 Advanced Currency IMPULSE with ALERT  +   Currency Strength Exotics 的一个超级组合。 它适用于所有时间框架,并以图形方式显示8种主要货币和一种符号的强势或弱势冲动! 该指标专门用于显示任何符号的货币强度加速,如黄金、异国货币对、商品、指数或期货。这是它的第一个指标,任何符号都可以被添加到第9行,以显示黄金、白银、石油、DAX、US30、MXN、TRY、CNH等的真实货币强度加速(冲动或速度)。 建立在新的基础算法上,它使识别和确认潜在的交易更加容易。这是因为它以图形方式显示了一种货币的强势或弱势是否正在加速,并测量了这种加速的速度--把它想象成你汽车中的速度表。当你加速时,事情显然会发生得更快,这在外汇市场上也是一样的,即如果你配对的货币正在向相反的方向加速,你就会发现一个潜在的有利可图的交易。 动态市场斐波那契28水平被用作警报触发器,将适应市场活动。如果冲动击中黄色触发线,你将收到警报。然后你就知道作为一个交易员应该做什么。货币对和方向已经给出。只需点击警报按钮,就可以
这是一个优秀的技术指标系统,它从小中大各方面分析出阶段性的向上或者向下的交易趋势。 参数里面的Period1是小的时间周期,Period2是中的时间周期,Period3是大的时间周期;small_symbol是1号信号的标识符,middle_symbol是2号信号的标识符,big_symbol是3号信号的标识符;alert是警告按钮的开关,Mail是电子邮件的发送开关,Notification是即时消息的发送开关。 这套指标整合了多种策略,给出各种波段的买卖信号。1号信号是最小的波段信号,可以用来做超短期的投机交易;2号信号的中波段信号,可以用来做1小时的信号交易;3号信号是大趋势信号,可以用来看趋势。 做交易时:先看3号大信号的趋势,再根据2号或者1号提供的信号下订单。
Step into the realm of Forex trading with confidence and precision using XQ, a cutting-edge Forex indicator designed to elevate your trading game to unprecedented heights. Whether you're a seasoned trader or just stepping into the world of currency exchange,   XQ Forex Indicator   empowers you with the insights and signals needed to make informed trading decisions. The signal conditions are a combination of three indicators, and XQ Forex Indicator only display  medium and long-term trends . The
TakePropips Donchian Trend Pro
Eric John Pajarillaga Aldana
4.81 (16)
TakePropips Donchian Trend Pro   (MT4) 是一款功能强大且有效的工具,可使用 Donchian 通道自动检测趋势方向,并为您提供进场和退场交易信号! 这个多功能指标包括趋势扫描器、交易信号、统计面板、筛选器、交易时段和警报历史仪表板。它旨在为您提供交易信号并节省您分析图表的时间! 您可以在我们的博文中下载用户手册和安装指南:   https   :// www.mql5.com/en/blogs/post/751368 今天立减 50%!价格从 98 美元降到 49 美元! 您可以在 Strategy Tester 上测试该指标(启用可视模式)。如果您喜欢在实时图表上进行测试,也可以给我发消息以获取 7 天试用版。 视频教程也可在说明下方获得更多详细信息。 如果您有任何问题或需要任何帮助,请与我联系。 TakePropips Donchian Trend Pro 指标适用于所有外汇对、金属、商品、指数和加密货币。 主要特点 交易信号 - 检测多个时间范围内所有货币对的买卖机会。它将为您提供警报并在图表上绘制交易信号,最多 3 个止盈价和一个止
All in One Trade
Alexey Minkov
4.48 (27)
GET 10% OFF NOW! The All-in-One Trade Indicator (AOTI) determines daily targets for EURUSD, EURJPY, GBPUSD, USDCHF, EURGBP, EURCAD, EURAUD, AUDJPY, GBPAUD, GBPCAD, GBPCHF, GBPJPY, AUDUSD, and USDJPY. All other modules work with any trading instruments. The indicator includes various features, such as Double Channel trend direction, Price channel, MA Bands, Fibo levels, Climax Bar detection, and others. The AOTI indicator is based on several trading strategies, and created to simplify market anal
Shepherd Harmonic Pattern
Abdullah Alrai
4.68 (59)
这个指标将检测手动和自动方法在图表上绘制的谐波模式。 您可以从此链接查看用户手册: 添加您的评论并联系我们以获得它 有一个免费版本可以在mt4上尝试此产品。 您可以使用它来检测Gartley和Nenstar模式: https://www.mql5.com/en/market/product/30181 您可以从以下链接购买完整的MT4版本: https://www.mql5.com/en/market/product/15212 注意 指标具有控制面板,并将保存每个(图表和时间框架)设置。 您可以将其最小化以在图表上获得更多空间,并且如果您更喜欢使用其他分析工具,则可以按关闭按钮隐藏所有指标数据 当您使用此指标并更改设置,添加诸如移动平均线或布林带之类的指标时,此指标将自动保存您的模板编辑,并且您可以随时加载它们。 如果您使用的是Windows 10,请右键单击MetaTrader图标>兼容性>更改高DPI设置>系统(增强)以获得最佳屏幕设置(应在高清设备中完成)。 指标只是谐波交易理论的解释,用于检测图表上的谐波模式。 如果您想学习它,可以搜索Scott Carney的书,名为“Ha
Gann Time Forecast
Kirill Borovskii
This indicator is based on the work of legendary trader William Gann, specifically using mathematical models and data from past days. It calculates potential time for a reversal based on selected parameters for the current day. The time is displayed in the future, at the opening of the day and does not change thereafter. The indicator also includes alerts when potential reversal time approaches. An algorithm for possible price movement is built into the indicator. When the time comes, an alert i
FX Volume
Daniel Stein
4.6 (35)
通过 mql5 和 Telegram 上 的 " 晨间简报 "获取每日市场更新,包括详细信息和屏幕截图 ! 外汇交易量(FX Volume)是第一个也是唯一一个从经纪商角度真正洞察市场情绪的交易量指标。 直接在您的图表上看到这些信息是真正改变游戏规则和突破性的交易解决方案。 受益于独特的市场数据洞察,如 比率(Ratios )显示货币多头和空头头寸的比率(百分比 比率变化 显示所选时间段内的多头比率及其百分比变化 总交易量 显示货币的总交易量(多头和空头),以手为单位 多头 交易量显示货币所有多头头寸的交易量 空头 交易量显示所有货币空头头寸的交易量 净多头 显示净多头交易量,即所有多头头寸减去所有空头头寸(以手为单位)。 净多头百分比 显示货币净多头交易量的变化 请阅读我们的基本教程 -> "如何使用外汇交易量进行交易 " 获取更多信息,如常见问题、交易技巧和教程视频,请访问我们的 外汇交易量公共信息频道 请 安装并运行 SI Connect 以建立与我们数据中心的持续连接 背景信息 我们都知道,外汇是一个分散的市场。这就是为什么我们必须打破常规思维,开发一个独
PTS Precision Index Oscillator V2
PrecisionTradingSystems
5 (1)
精密指数振荡器(Pi-Osc)由Precision Trading Systems的Roger Medcalf开发 版本2经过精心重新编码,以在您的图表上加载速度非常快,还加入了一些其他技术改进,以提高体验。 Pi-Osc旨在提供准确的交易定时信号,旨在找到极端的耗尽点,这些点是市场被迫去触及,以清理每个人的止损单。 该产品解决了一个古老的问题,即知道极端点在哪里,这使得交易员的生活变得更加简单。 这是一个高度复杂的共识指标,与行业标准的振荡器相比,具有一些强大的区别。 它使用的一些特征包括需求指数、资金流动、RSI、随机指标、模式识别、成交量分析、标准偏差极端点以及不同长度上述各种变化的分歧。 乍一看,对于未经培训的人来说,它似乎与任何其他振荡器没有什么不同,但当与其他振荡器(如RSI或动量等)相对比时,这个指标的真正威力开始显现。 据我所知,没有其他振荡器可以频繁地精确指出顶部和底部,具有相同的定期效率。 精密指数振荡器由许多不同的数学方程组成,用于测量多个时间框架采样中的价格和成交量变动,从而高度准确地预测趋势可能发生转折的位置。 PTS P
Supply and Demand Dashboard PRO
Bernhard Schweigert
4.82 (22)
目前八折优惠! 这个仪表板是一个非常强大的软件,可用于多个符号和多达9个时间段。 它是基于我们的主要指标(最佳评论:高级供应需求)。 Advanced Supply Demand 该仪表板提供了一个伟大的概述。它显示。   筛选后的供需值,包括区域强度评级。 区间内和区间外的点位距离。 它突出了嵌套的区域。 在所有(9个)时间段内,它对所选符号发出4种警报。 它是高度可配置的,以满足您的个人需求! 您的利益! 对每个交易者来说,最重要的问题是。 什么是入市的最佳水平? 在强大的供应/需求区域内或附近进入你的交易,以获得最佳的成功机会和风险/回报。 我的止损的最佳位置是哪里? 把你的止损放在强势供应/需求区的下方/上方是最安全的。 我的最佳盈利目标是什么? 你的退出策略和你的进入策略一样重要,了解更高的时间框架图可以帮助你。对于买入,使用下一个供应区作为目标,对于卖出,使用下一个需求区作为目标。在回撤到供应区或需求区时进场,以确保有足够的利润空间,达到更高的时间框架的供应和需求,将增加你的利润。 为什么我们要过滤强区和
PZ Swing Trading
PZ TRADING SLU
5 (4)
Swing Trading 是第一个旨在检测趋势方向的波动和可能的反转波动的指标。它使用在交易文献中广泛描述的基准摆动交易方法。该指标研究多个价格和时间向量,以追踪总体趋势方向,并检测市场超卖或超买并准备好进行修正的情况。 [ 安装指南 | 更新指南 | 故障排除 | 常见问题 | 所有产品 ] 市场波动的利润不会被窃取 指示器始终显示趋势方向 彩色价格带代表机会基准 彩色虚线表示可能的反转波动 该指标分析其自身的质量和性能 它实现了一个多时间仪表板 可定制的趋势和波动周期 它实现了电子邮件/声音/推送警报 指示器为非重涂或重涂 什么是摇摆交易 摇摆交易是一种尝试在一天到一周内从证券中获得收益的交易方式,尽管某些交易最终可以保持更长的寿命。摇摆交易者使用技术分析来买入弱点和卖出力量,并有耐心等待这些机会的发生,因为在发生一波抛售浪潮之后购买证券而不是陷入抛售更有意义。 机会基准 关于历史数据的大量研究证明,适合于波动交易的市场倾向于在基线价格带上下交易,基线价格带由图表显示,使用平均真实区间计算得出。波动交易者使用基线,该策略是购买常态和卖出躁狂,或做空常态并掩盖沮丧。
Gann Zone Pro
Kirill Borovskii
This indicator identifies and displays zones, as it were areas of strength, where the price will unfold. The indicator can work on any chart, any instrument, at any timeframe. The indicator has two modes. The indicator is equipped with a control panel with buttons for convenience and split into two modes. Manual mode: To work with manual mode, you need to press the NEW button, a segment will appear. This segment is stretched over the movement and the LVL button is pressed. The level is displayed
Cycle Sniper
Elmira Memish
4.41 (34)
NEW YEAR SALE PRICE FOR LIMITED TIME!!! Please contact us after your purchase and we will send you the complimentary indicators to complete the system Cycle Sniper is not a holy grail but when you use it in a system which is explained in the videos, you will feel the difference. If you are not willing to focus on the charts designed with Cycle Sniper and other free tools we provide, we recommend not buying this indicator. We recommend watching the videos about the indiactor and system before pu
作者的更多信息
Time Range Separator  is a useful tool to display a separator period on your platform. You could go in the properties of the indicator, select the desired range and that's ALL. We believe it is a useful and necessary that we wish to share with you for free all our followers. Input Values: TimeFrame = Period Separator Separator_Color = Vertical Color Line Separator_Style = Vertical Color Style Separator_Width = Vertical Line Width Good trading to all and see you soon. Same indicator for MT4 her
FREE
Time Range Separator
Chantal Sala
4.78 (9)
Time Range Separator is a useful tool to display a separator period on your platform. You could go in the properties of the indicator, select the desired range and that's ALL. We believe it is a useful and necessary that we wish to share with you for free all our followers. Input Values: TimeFrame Period Separator GMT_Hour (ex. +1 or -1) to move the lines at Period Time +/- tot hours in input Hide_dates to show or hide the datetime on vertical lines VLine_Color = Vertical Color Line VLine_Styl
FREE
Volume Delta Panel
Chantal Sala
4.54 (13)
Volume DeltaPanel is a very powerful indicator that read the supply on Market. It calculates the Delta from movement of the price and the difference of BUY volumes and SELL volumes. The Volumes are added to price and normalized to symbol points. Its special structure allows you to get all Time Frames values available on the platform MT4. Panel can show 28 instruments simultaneously all customizable according to the offer of the Broker. A good observation of this instrument can suggest great en
BreakEven Line is a very useful and easy to use indicator. In case of multiple positions opened on the same instrument, the indicator shows the breakeven point where it is possible to close the positions. Its graphic simplicity makes it an unobtrusive and customizable tool. You can enable/disable a line on a chart, so you can make the indicator invisible. Inputs Show cumulative BE (line on/off) Breakeven line color (to change the line color) Breakeven line style Breakeven line width Show short B
Swing High Low
Chantal Sala
5 (2)
Swing High Low Pattern Recognition is a great indicator able to fix price levels and analyze the market swings. Swing High Low uses a dynamic approach of analysis that allows you to identify easily the best entry levels. The indicator using the minimum and maximum periods of the previous candles to analyze the impulsive movement and finally it sets the entry levels. The entry levels are: fast, good and best . The best is the last confirm of the swing. For a correct use we advise to wait the comp
This is a utility to copy in Expert Advisor folder. The EA will force the download of your History Center MetaTrader. It will not download new data from your broker but it will aid your MT4 to charge every chart correctly. You can choose the symbols to download. After the launch, the EA will be removed automatically from the chart. After the launch, you can see results under Experts panel on MT4. The log will show you the data charged or not charged. Symbol TF = Number of candles charged. Ex: Su
FREE
Volume Spyke
Chantal Sala
5 (2)
The Volume Spike indicator is a useful tool to identify the directional market's intention. How Does It Work: The Volume Spike indicator identifies the volume peaks and creates a sensitive rectangle equipped with Alert and Warning Pop Up that it suggests the market's direction. This tool has the ability to select the time frame on which to do the analysis of volume and it gives a great visual signal colored into rectangle. The indicator can identify valid market signals but it can also suggest
HLOC
Chantal Sala
5 (3)
High Low Open Close Levels The indicator HLOC is a good ally to correctly identify the appropriate trend of price. The indicator is designed to be minimally invasive and it shows a visual and sound aid in order to take decision on the market. The indicator is equipped with sound alert and window alert in order to have a reminder of the price movements. We suggest you watch the video below to evaluate its operational benefits. Input values: Show Level (true/false) TimeFramePeriod (refer to line
InfoPanelMarket
Chantal Sala
3.5 (4)
Informational indicator which shows: Swap Price under/upper Open for every Time Frame Spread Time to close the current candle Broker Time Net Change: delta in percentage from Open (MN-W1-D1) Tick Value Volumes Info for every trades open: Lots Breakeven Profit Buy-Profit Sell Equity Symbol Positive values are green and negative values are red (modifiable in input). Inputs: View BE line (enable/disable) View all Symbol (shows the list of symbol) Color (for every text) Line Color (for BE line)
This panel is very simple to use and it is a very ally to manage your positions and orders. Also you can modify your risk, writing in fields directly on Panel. One click on buttons and the operation on market is done! Operations possible: BUY/SELL Break Even Split (close 50% all orders) Close All positions Hedging (opens reverse positions to cover) Close only BUY positions Close only SELL positions Close All pending orders Reverse all positions Please watch the video to verify the very simple
Volume POC
Chantal Sala
5 (3)
Volume POC The Volume POC indicator displays important levels. You can use it as an independent trading system. Warning functions at a candle closing allow you to have some information on the market direction. The graphical display is simple and effective. The levels reported are the result of the study of historical market volumes. These levels give excellent entry points and excellent levels of support and resistance. You can use the indicator also on very low timeframes. It is suitable for
Open All
Chantal Sala
The Open All indicator uses a simple market information that is "Open Candle". This tool is able to show all the openings of all time frames in order to extract information of strength and trendy. You can display 28 instruments with relative time frame interior for a total of 252 informations. The display is fully customizable, you can choose either the symbol and enable/disable Time Frames. Using it correctly you could get valuable aid to intercept correlations and turning points in the market.
Net Change
Chantal Sala
The indicator Net Change is a very useful tool able to extrapolate a percentage in order to have a real reference on the performance of the instrument. This indicator is designed to show the main values: you could monitor the Daily, Weekly, Monthly, Quarterly, Semi-annual and Annual percentages. A necessary tool for those who want to really explore the quantitative logic of the market. Input values SYMBOLS SETTINGS Use_Only_Current_Symbol (true/false): Permits to manage only current symbol on
Best And Worst
Chantal Sala
5 (1)
The Best and Worst indicator (similar to Net Change Indicator) has the peculiarity of being a dynamic indicator. It seems a very Stock Exchange Indicator. This means that it is able to draw up a list and put in order the best and worst instruments in descending order. You can choose to show the percentage of any Time Frame: 1M, 5M, 15M, 30M, H1, H4 etc ... This instrument could really give great suggestions on your trading in order to center the right time and to have a total view of the markets
Delta Single Volume
Chantal Sala
3.25 (4)
Volume Delta is a very powerful indicator that reads the supply on the Market. It calculates the Delta from movement of the price and the difference of BUY and SELL Tick volumes. Its special structure allows you to get all timeframe values available on the MT4 platform. A good observation of this instrument can suggest great entry points and possible reversal. We are confident that this tool will help you to improve your trading timing. See also for MT5:  https://www.mql5.com/en/market/product/5
Price Trend Light
Chantal Sala
4 (1)
Price Trend Light indicator is a beautiful indicator that shows purchasing areas and sales areas. This indicator is designed to follow the movement of the price which rounds on the opening price. It also provides information of trend follow on the break of the minimum and maximum. The indicator has a very simple graphic but effective, above the opening price you will have a light green color and under the opening price there is a red light. On every Break Out of the minimum or maximum sets in in
Power Strength
Chantal Sala
5 (1)
The indicator Power Strength creates a virtual display that takes data from all Symbols. It extrapolates all the informations in order to get the strength and / or weakness to take a decision on market. This tool works only on the Forex Market and not processing data on indices, metals ... It is graphically very attractive and its simplified information could give excellent input signals. You can use this indicator to find inputs on daily or short-term operations or scalping. Input Values PANE
Zoom Price
Chantal Sala
Zoom Price It is a very useful tool that is designed to ZOOM the price positioning on one of the 4 corners of the graph. In addition to display function of the price indicator, Zoom Price is equipped with a check on Bullish or Bearish Breakout Signal that change the label color. Zoom Price is a simple tool that can provide useful informations to improve your operational performance. Input Values: myPeriod - TF to consider for Break Out O Signal LABEL SETTINGS Bullish BreakOut Color Bearish Break
The Price Action Dashboard is an innovative tool to help the trader to control a large number of financial instruments. This tool is designed to automatically suggest signals and price conditions. The Dashboard analyzes all major Time Frame suggesting price action conditions with graphic elements. The Dashboard can suggest you the strength of the trend identifying directional movement, it is an indispensable tool for those who want to open position themselves using market trends identifiers. The
Master Trend Dashboard is a new generation indicator, compact, light and efficient. Each element of this Dashboard is designed to return specific signals as: Price Action, Breakout, Net Change (performance of the instrument), algorithmic studies, correlations and statistical calculations. This tool will change your way of trading allowing you to receive important information. See the Graphic Signals to understand every single signal below: Graphic Signals Symbol name and arrow color Green = Cu
Box Chart
Chantal Sala
5 (1)
The indicator Box Chart is a very useful analysis tool that allows you to know the value of the range in points. The range is written in a label and also it is draw in a rectangle. This indicator works on multi timeframe and you can upload more indicators on same chart to analyze more time frames ranges. The analysis of the range is done following W. G. Gann school. The observation of the range on little time frame returns some good information of trend or reversal. Box Chart is a simple indicat
Navigator FX
Chantal Sala
5 (2)
The Navigator is a next-generation panel very easy to use. Apply this indicator on the chart to navigate very quickly through all the symbol and timeframes listed in input. The arrows manage the zoom and time frames. You can customize both the graphic colors and the list of symbols to display. A quick and easy tool that it will help to analyse the charts. Input Values Show_TF_Panel (true/false) it permits to show/hide panel with TF and Arrows 32 symbols COLORS AND SIZE SETTINGS BUTTON_WIDTH B
Market Pressure is a next-generation display. Its simple and intuitive graphics system allows you to receive directions very easy and fast. This indicator can give three different methods of signals: Scalping, Intraday and Multiday. The logic is based on the price action which combined on multiple time frame. It can give very high quality signals. An indispensable tool for those who want to understand the market pressure and the operating trend. The indicator is customizable for both colors for
OCO News Order Manager in an Expert Advisor to Trading News . The usability makes this tool an excellent ally for FAST operations on NEWS Time. We recommend that you try it on demo account to understand what kind of decimals using your broker to set your input values. The EA is usable on every Markets. On news time the spread could be manage from Broker, please make attention. Main functionalities Open STOP PENDINGS ORDER a number of seconds (in input) before News Time Floating of pending orde
Dax Scalping Bracket is a new generation Expert Advisor Panel. This a very professional tool for SCALPING. The usability makes this tool an excellent ally for FAST operations of SCALPING on Index instruments and Forex market. The main feature of this EA is the ability to open multiple operations with a single click. Each position is autonomous and you can set different take profit and stop loss for each position. Special functionalities: STOP MOVE to manage your stop chasing the price BREAK EVEN
Market Pressure Dashboard is a new generation utility. Its main function is to assist you and give you operational ideas optimizing your analytical work. Using this utility you could monitor a lots of financial instruments (max 28 symbols FOREX) in a very simple way. The Market Pressure indicator allows you to customize the internal list of the symbols to be monitored. The opening function and position management with this panel will be much more comfortable and navigation charts very powerful.
Risk Reward indicator is a very useful tool that allows you to observe in real time the performance risk of a trade. Its use is very simple, just drag it into the chart and see the Risk Reward percentage (for ex: 1:2). We have also included the possibility of extending/reducing the lines in order to observe the important price levels. You can change your levels clicking directly on lines and dragging the level to a new position. The levels will be set very fast with only a click. The indicator k
Open Line
Chantal Sala
3 (1)
The Open Line indicator is a simple indicator that tracks the opening levels of more time sessions. This version allows the user to check the opening levels using different time time frames. It is possible to add on the same chart different Open Lines to have more important horizontal levels. The colors and lines are fully customizable also for the label text. A simple indicator but very powerful to give you a proper orientation for your trading. Input Values TimeFrame (to show the open price
Target Geometry
Chantal Sala
4.2 (5)
Target Geometry is a next-generation indicator that uses the geometric nature of the markets to give high statistical probability levels ( Fibonacci ). This indicator creates a very important map that optimizes the entry points and it optimally defines your own money management. The indicator can be used both in static mode or in dynamic mode, you can use it on any financial instrument. The use in multi timeframe mode is a very good ally to have. The target levels are high statistical probabilit
Initial Balance Target Strategy is an indicator based on Fibonacci Levels. Its graphics flexibility allows you to adapt very well to your strategies or Trading System setting it with levels in input. The analysis of the time range allows replication of strategies as London Breakout and Kiss . The indicator is fully customizable, you can change colors, texts and percentages of Target. The simplicity and manageability of this indicator makes it an useful tool for all Intraday Trader . Input Valu
筛选:
无评论
回复评论
版本 1.1 2022.08.30
v1.1
Only Recompiled