MQLTA Currency Strength Matrix
- 指标
- 版本: 1.3
- 更新: 16 二月 2021

Currency Strength Matrix (CSM) is an indicator that will show you the current strength of the major currencies in several timeframes, allowing you to sort the currencies for strength and spot possible trading setups. This indicator is ideal for scalping and in all those events of sudden big moves.
How does it work?
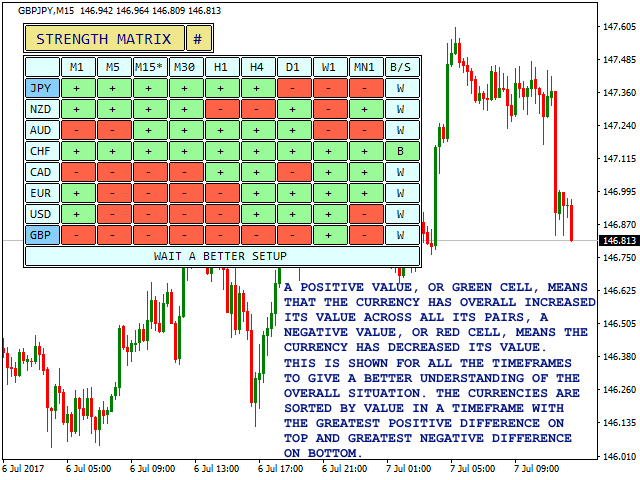
The CSM compares the value of the current moving average with the same moving average in the previous candle for all the 28 pairs and all 9 timeframes, producing a Matrix of Strength of the individual currencies. The currencies are then ordered by strength in your desired timeframe.
For example, if you sort the currencies for timeframe H1 you will see the currencies ordered for strength in the 1 hour timeframe, on top there will be the currencies with the greatest net gain and on the bottom the currencies with the deepest net loss in their moving average value (always considering all the pairs where a currency is involved).
To work correctly the indicator needs all the 28 pairs involving the 8 major currencies EUR, USD, GBP, JPY, AUD, NZD, CAD, CHF.
How To Trade with the CSM?
These are only suggested entry rules, you can adapt your trading to this indicator:
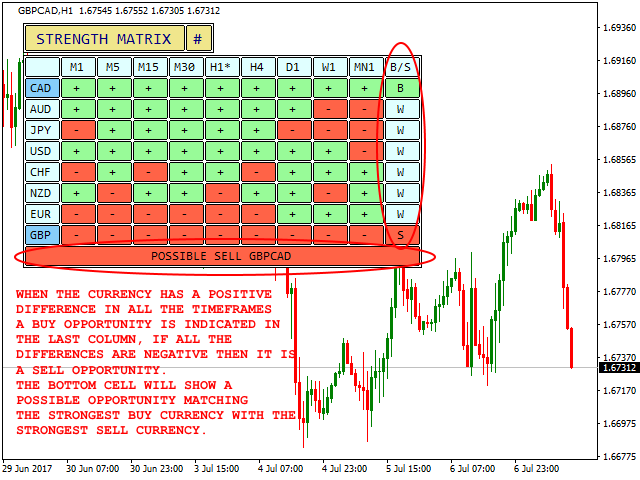
- A currency with all positive differences (green) is strong and a B (for BUY) will appear in the last column, meaning the currency can be bought
- A currency with all negative differences (red) is weak and a S (for SELL) will appear in the last column, meaning the currency can be sold
- Try to trade the strongest against the weakest
BUY STRONG - SELL WEAK. CSM will show you the ideal combination of strongest and weakest and notifications are available.
When to use CSM?
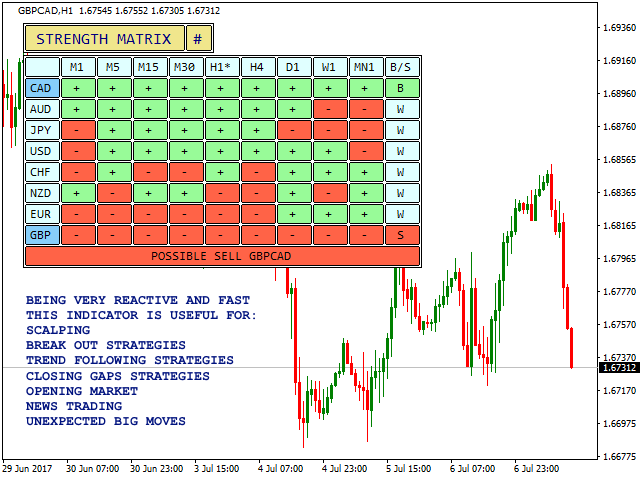
The Currency Strength Matrix is a very fast and reactive indicator, ideal for the following, but not only:
- Scalping
- Trend Continuation
- Break out
- News
- Market Open
- Closing gaps
- Sudden big moves
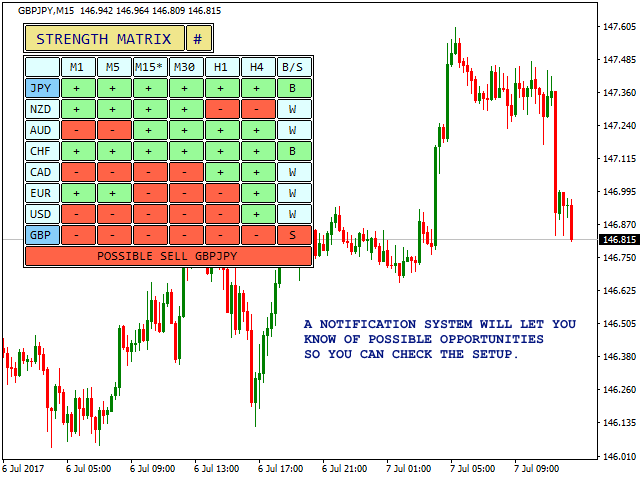
Notifications
Other than showing you the ideal pair to trade, CSM can notify you via alert, email and app.
How to Backtest
CSM runs calculations on 28 pairs and 9 timeframes hence backtesting will not work properly unless you download the historical data for all the pairs and all the timeframes and actually open all the charts scrolling to their left. To work around this limitation you can test the DEMO with limited features https://www.mql5.com/en/market/product/24251 or rent the indicator for only one month at a low price.
Indicator Parameters
- Indicator's Name - Used to draw objects
- MA Period - Period of the moving average to calculate
- MA Method - Type of the moving average to calculate
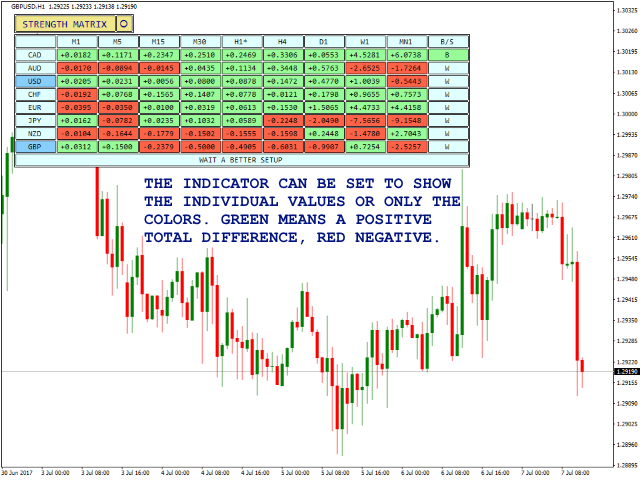
- Show Values or just Colors - to see the net value of difference in the cell or just the color
- Sort strength by - Which period to sort the strength for
- Enable Notification - to totally enable or disable notification
- Send Alert Notification - true to send Alert notification (popup screen in MetaTrader).
- Alert Sound - the file name of the sound to play during the alert.
- Send Notification to Mobile - true to send notification to the mobile app.
- Send Notification via Email - true to send the notification via email.
- Wait time between notifications - minutes of wait before sending another notification
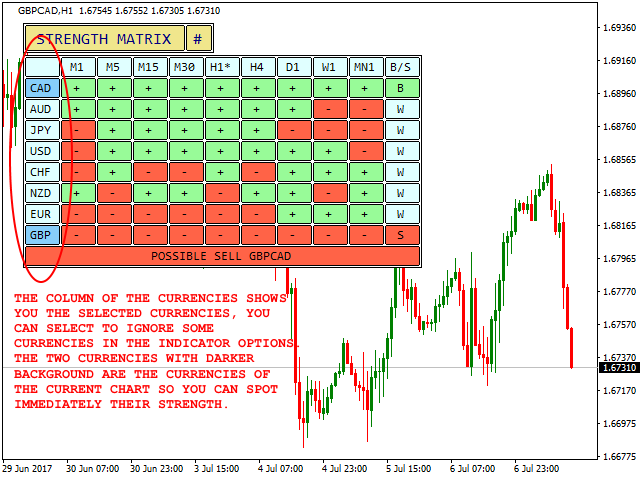
- Currencies to Consider - self explanatory, select false to ignore a currency and not showing it
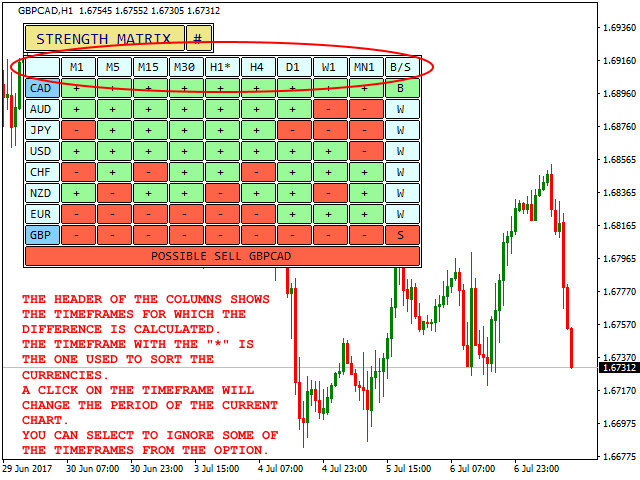
- Timeframes to consider - self explanatory, select false to ignore a timeframe and not showing it
- Pairs Prefix - the prefix of the pair, if any
- Pairs Suffix - the suffix of the pair, if any
- Horizontal offset - starting position of the panel on x axes
- Vertical offset - starting position of the panel on y axes
If you like this tool please take a minute to leave a review.
If you have suggestions to improve it please send me a message and we can discuss it further.
Feel free to visit my profile and "Add to friends" https://www.mql5.com/en/users/mql4autotrading.


An advanced code it seems to me, the rating is self explanatory. I trusted his work from the beginning and especially gained a trust when I used a recommended broker from this Author's website. Currency Strength reading is vital after-all, defining motives.