MQLTA Pattern Detector DEMO
- 指标
- 版本: 1.2
- 更新: 16 二月 2021

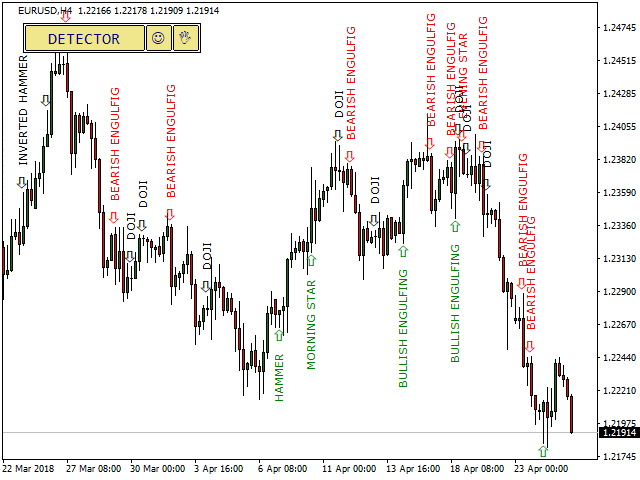
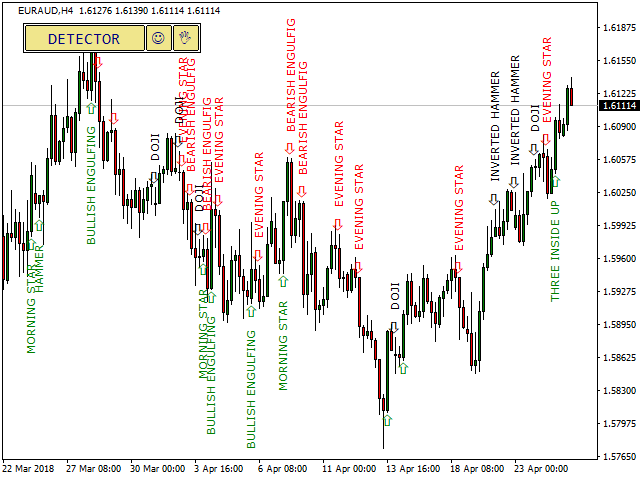
Pattern Detector can detect the most common 1, 2 and 3 candlestick patterns and send notifications when detected.
The DEMO version only works on AUDNZD pair.
Full product can be found https://www.mql5.com/en/market/product/29190
How does it work
Add the indicator to the chart you want to analyze and select which patterns to detect, the indicator will draw the detected patterns. You can also be notified via alert, app and email when a new pattern is detected.
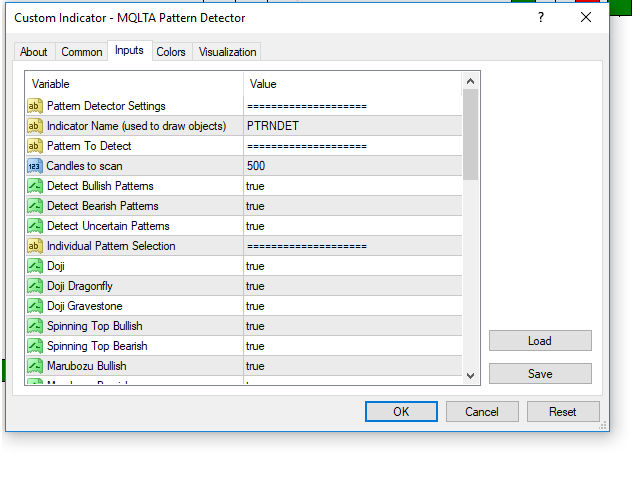
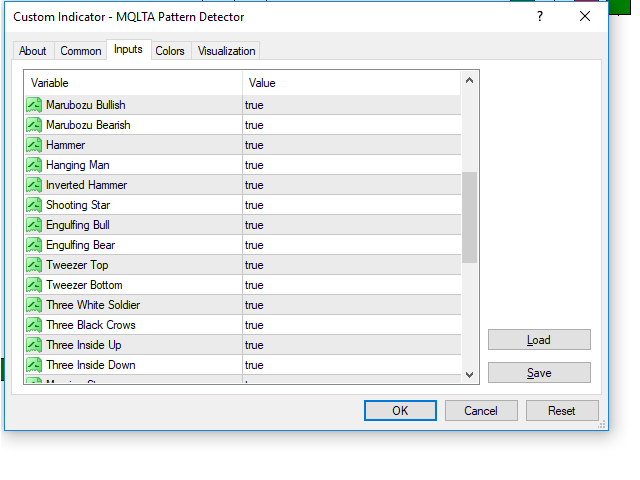
Parameters
- Indicator Name - Used to draw the graphical objects, recommended to leave as is
- Candles to scan - How many candles to analyze in the chart, suggested to stay below 1000
- Detect Bullish Patterns - True or False To choose if detect or ignore bullish patterns
- Detect Bearish Patterns - True or False To choose if detect or ignore bearish patterns
- Detect Uncertain Patterns - True or False To choose if detect or ignore uncertain patterns
- Doji - True or False to choose if detect doji patterns
- Doji Dragonfly - True or False to choose if detect doji dragonfly patterns
- Doji Gravestone - True or False to choose if detect doji gravestone patterns
- Spinning Top Bullish - True or False to choose if detect spinning top bullish patterns
- Spinning Top Bearish- True or False to choose if detect spinning top bearish patterns
- Marubozu Bullish - True or False to choose if detect marubozu bullish patterns
- Marubozy Bearish- True or False to choose if detect marubozu bearish patterns
- Hammer - True or False to choose if detect hammer patterns
- Hanging Man - True or False to choose if detect hanging man patterns
- Inverted Hammer - True or False to choose if detect inverted hammer patterns
- Shooting Star- True or False to choose if detect shooting star patterns
- Engulfing Bull - True or False to choose if detect engulfing bull patterns
- Engulfing Bear- True or False to choose if detect engulfing bear patterns
- Tweezer Top - True or False to choose if detect tweezer top patterns
- Tweezer Bottom - True or False to choose if detect tweezer bottom patterns
- Three White Soldier - True or False to choose if detect three white soldier patterns
- Three Black Crows - True or False to choose if detect three black crows patterns
- Three Inside Up- True or False to choose if detect three inside up patterns
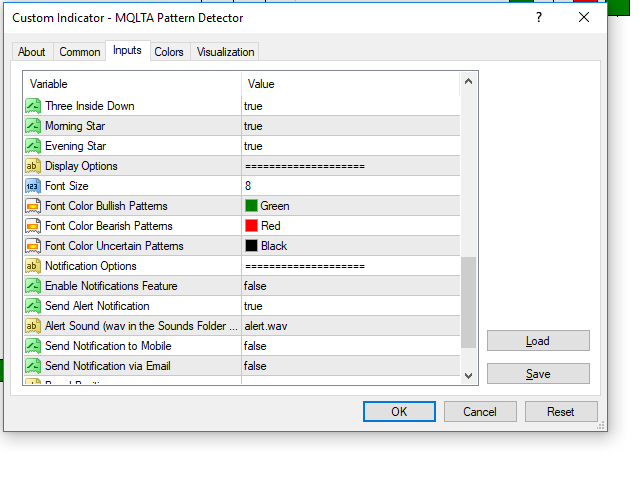
- Three Inside Down - True or False to choose if detect three inside down patterns
- Morning Star- True or False to choose if detect morning star patterns
- Evening Star- True or False to choose if detect evening star patterns
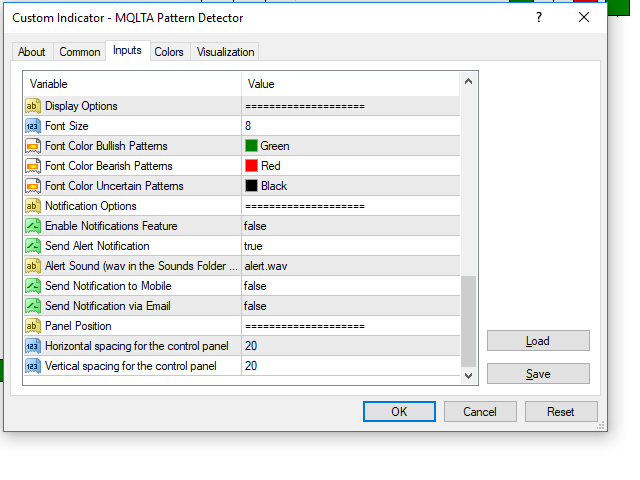
- Font Size - Font Size for the labels, default is 8
- Font Color Bullish Patterns - To select the color for bullish patterns labels and arrows
- Font Color Bearish Patterns - To select the color for bearish patterns labels and arrows
- Font Color Uncertain Patterns - To select the color for uncertain patterns labels and arrows
- Enable Notification Feature - To enable or disable the notification function
- Send Alert Notification - True or False to enable or disable on screen and sound notifications
- Alert Sound - File name of the sound to play with the alert notifications
- Send Notification to Mobile - true or false to enable or disable the mobile app notifications
- Send Notification to Email - true or false to enable or disable the email notifications
- Horizontal Spacing for the control panel - Pixel of space between the panel and the left border of the chart
- Vertical Spacing for the control panel - Pixel of space between the panel and the top border of the chart
Full product can be found https://www.mql5.com/en/market/product/29190
If you like this tool please take a minute to leave a review.
If you have suggestions to improve it please send me a message and we can discuss it further.
Feel free to visit my profile and "Add to friends" https://www.mql5.com/en/users/mql4autotrading.