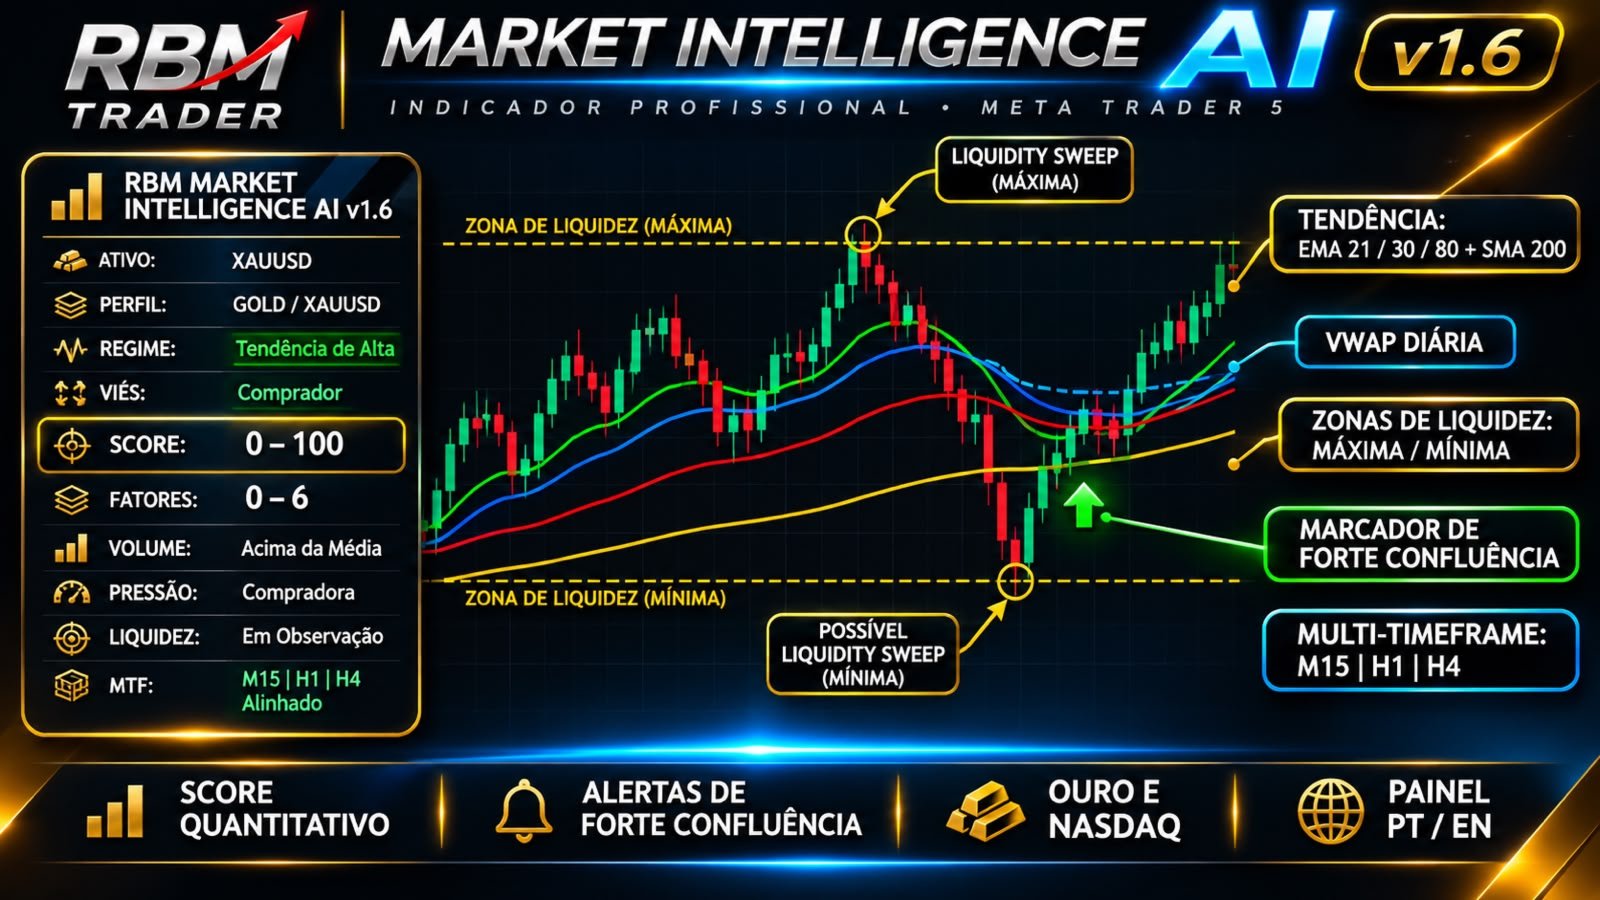
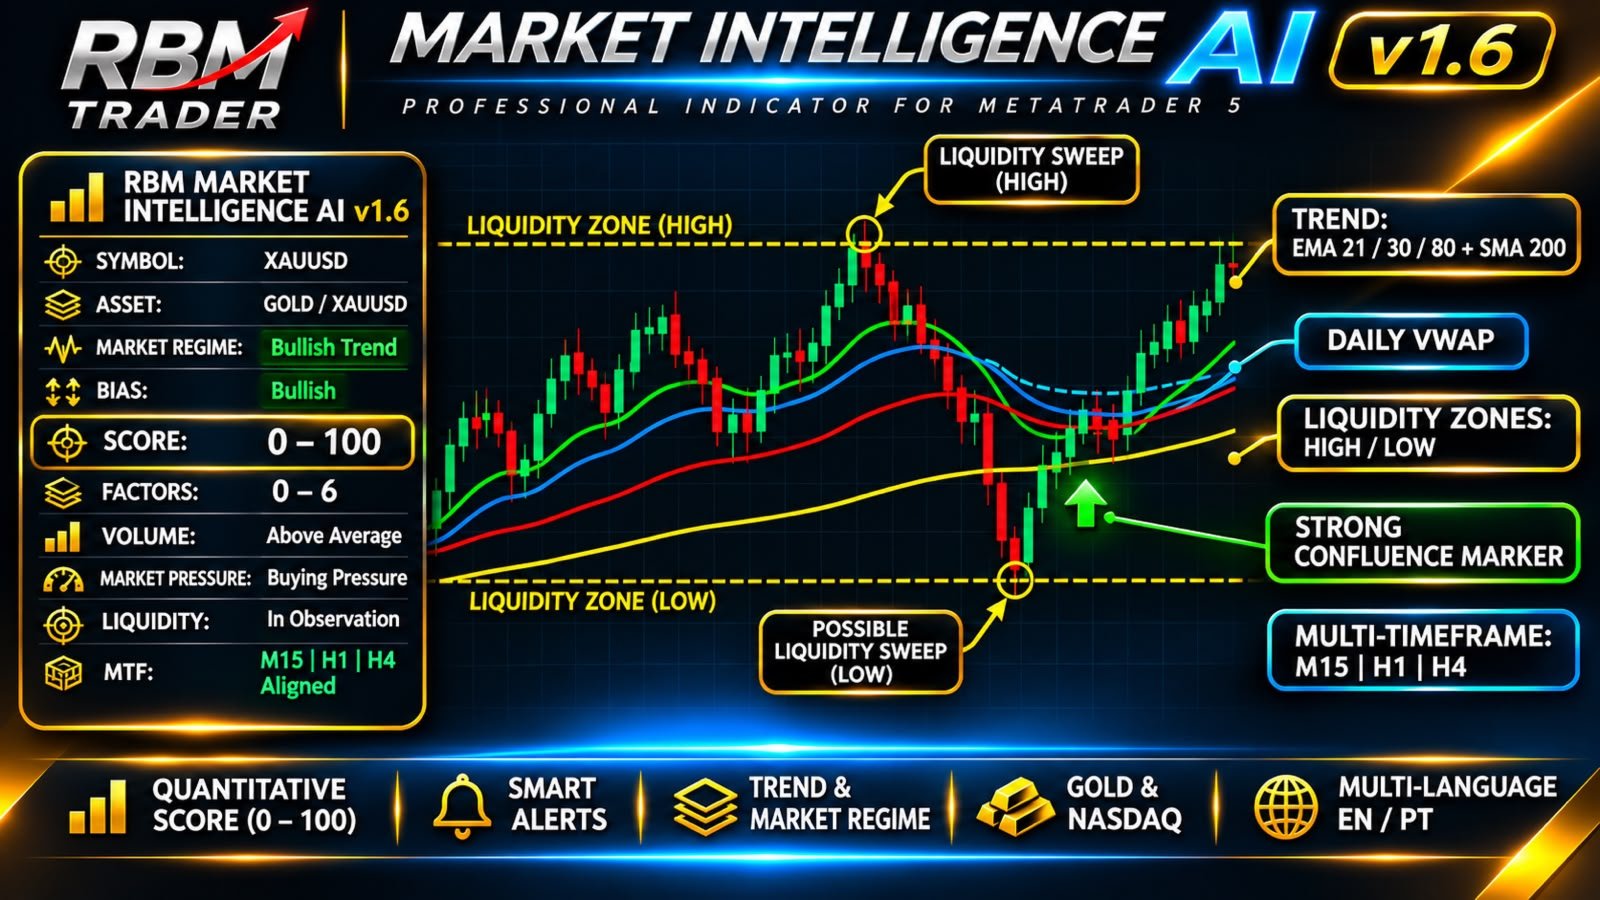
RBM Market Intelligence

RBM MARKET INTELLIGENCE AI 1.6

MARKET INTELLIGENCE | QUANTITATIVE ANALYSIS | PROFESSIONAL CHART VISUALIZATION

Developed by RBM Trader for MetaTrader 5.

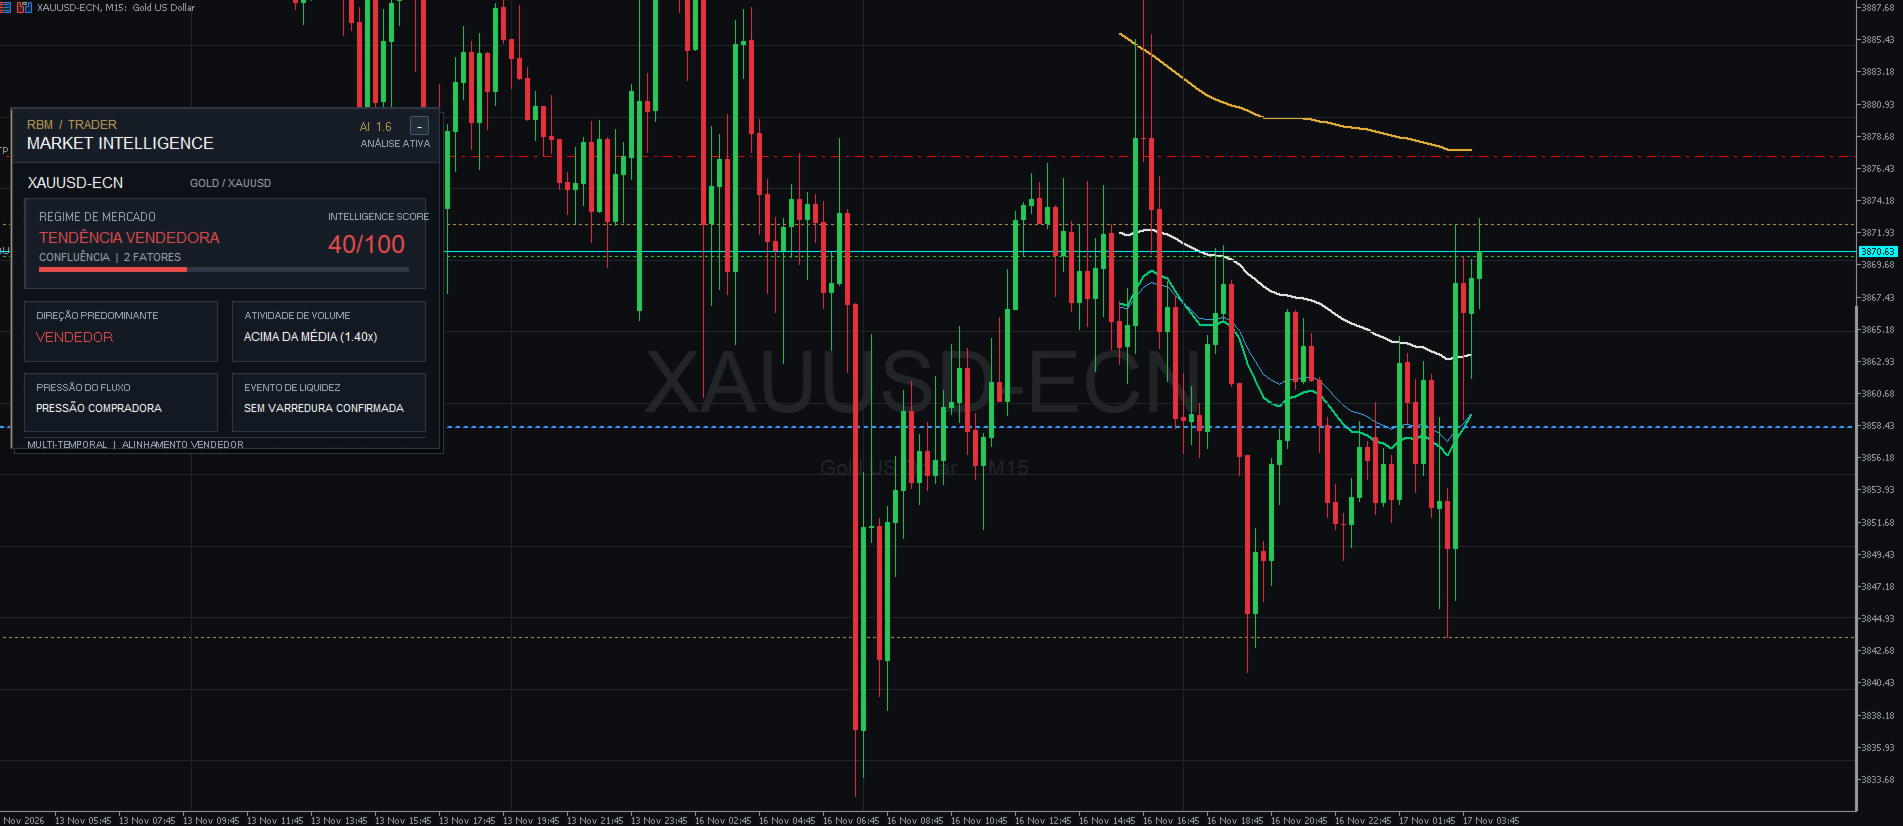
RBM Market Intelligence AI 1.6 is an advanced quantitative market analysis indicator that combines trend analysis, volume activity, market pressure, liquidity detection and multi-timeframe alignment into one integrated analytical environment.

Version 1.6 introduces advanced chart visualization, allowing traders to monitor important technical components directly on the trading chart, alongside the premium intelligence dashboard.

01. MARKET INTELLIGENCE ENGINE

The analytical engine combines six core components:

TREND INTELLIGENCE
Identifies moving average alignment, prevailing direction and trend structure.

VWAP ANALYSIS
Evaluates price positioning relative to the daily VWAP.

VOLUME INTELLIGENCE
Compares current trading activity against historical volume averages.

MARKET PRESSURE
Evaluates potential buying and selling pressure through candle behavior and closing price position.

LIQUIDITY DETECTION
Identifies potential liquidity sweeps, relevant highs and lows, structural breakouts and price returns.

MULTI-TIMEFRAME ANALYSIS
Evaluates directional alignment across M15, H1 and H4.

02. ADVANCED CHART VISUALIZATION

Version 1.6 expands the analytical experience with visual tools directly on the MetaTrader 5 chart.

  • EMA 21
  • EMA 30
  • EMA 80
  • SMA 200
  • Daily VWAP
  • Upper and lower liquidity levels
  • Potential Liquidity Sweep markers
  • Bullish and bearish strong confluence markers

Each visual component can be individually enabled or disabled, allowing traders to customize their chart environment.

03. INTELLIGENCE SCORE | 0–100

The quantitative scoring engine evaluates confluence across six analytical groups:

  • Trend alignment
  • VWAP positioning
  • Volume and market pressure
  • Multi-timeframe alignment
  • Liquidity sweep conditions
  • Candle strength relative to ATR

The dashboard displays bullish and bearish directional bias, neutral conditions, contributing factors and strong confluence classifications.

The Intelligence Score is an internal quantitative confluence rating, not a statistical probability of profitability.

04. MARKET REGIME DETECTION

  • Bullish expansion
  • Bearish expansion
  • Bullish trend
  • Bearish trend
  • Low activity and consolidation
  • Market transition and unclear direction

05. SMART ALERT SYSTEM

Receive notifications when strong confluence conditions are identified.

  • Configurable minimum score
  • Configurable minimum number of factors
  • Bullish and bearish alerts
  • Duplicate alert protection
  • New condition and reversal recognition
  • Configurable sound and visual notifications

Alerts are informational and do not execute trades automatically.

06. AUTOMATIC ASSET RECOGNITION

GOLD | XAUUSD
Automatic recognition of supported Gold symbol variations.

NASDAQ | NAS100 | USTEC | US100
Recognition of supported Nasdaq symbol variations used by brokers.

Other assets are classified as Generic, with strong confluence alerts disabled by default.

07. PREMIUM DASHBOARD

  • Premium RBM Trader interface
  • Intelligence Score display
  • Market regime classification
  • Directional bias
  • Volume and pressure analysis
  • Liquidity status
  • Multi-timeframe alignment
  • Compact hide and restore button
  • Customizable panel positioning
  • Portuguese and English language options

08. TECHNICAL SPECIFICATIONS

Platform MetaTrader 5
Technology MQL5
ATR Period 14
Volume Average 20 periods
Moving Averages EMA 21, 30, 80
Long-Term Average SMA 200
VWAP Daily
Multi-Timeframe M15, H1, H4
Intelligence Score 0–100
Processing Local processing
External API Not required
Languages English and Portuguese

THE RBM TRADER APPROACH

Markets should not be interpreted through isolated indicators or individual signals.

Combining trend, volume, liquidity, price structure and market context provides a broader perspective on prevailing market conditions.

RBM Market Intelligence AI 1.6 brings these analytical elements together in one integrated quantitative environment, designed for traders seeking a more structured approach to market interpretation.

RBM TRADER

MARKET INTELLIGENCE. BUILT FOR PROFESSIONAL TRADERS.

RISK DISCLAIMER

This indicator is an analytical tool. It does not execute trades automatically or guarantee financial results. Volume information depends on broker-provided data. In Forex and CFD markets, tick volume does not represent consolidated global trading volume. All trading decisions and risk management remain the responsibility of the user.
推荐产品
DMC Trend
Deibson Carvalho
5 (1)
Indicator that uses ATR and standard deviation to calculate the current trend. It has the top and bottom line. The top line is shown when it is high, and the bottom line when it is low. The indicator does not draw a trend line or show the trend for the day, or for a certain period. It has the function of indicating the current trend, and may indicate a reversal. use it with caution and at your own risk.
FREE
Marca Dagua
Erison Francisco De Sales
3 (1)
Adiciona marca d'água com nome do ativo em negociação. Pode ser ajustado definindo tamanho da fonte e coloração do texto. Testado com vários ativos do mercado B3 e Forex  Adione ao gráfico e configure de acordo com a necessidade. Caso tenha problemas sinta-se a-vontade para nos avisar e providenciaremos a correção logo que possível. ______________________________
FREE
Scalping Pattern 123
Altieres De Matos
Descrição Geral O Scalping Pattern 123 WDO & WIN é um robô de alta performance desenvolvido especificamente para operar os contratos futuros mais líquidos da B3: Mini Dólar (WDOFUT) e Mini Índice (WINFUT) . Baseado na clássica e respeitada metodologia de reversão de tendência (Setup 1-2-3), o algoritmo automatiza a leitura de fluxo de preço e correções de curto prazo, eliminando o fator emocional das suas operações. Principais Funcionalidades Operação Multiativo: Projetado com parâmetros otimiza
FREE
LM Custom Clean Candle SECONDS Chart builds a chart that does not exist in the terminal: a candle chart on an interval written in seconds. How it works: attach the EA to an M1 chart of the symbol, set InpSeconds to the interval you want (15, 30, 60, 120, 300, up to 3600) and the EA creates a custom symbol, feeds it from the chart prices and shows the candles of that interval. Each chart instance keeps its own value, so the same symbol can be read on two different intervals at the same time on tw
FREE
ZigZag SMC MT5
Kallebe Lins De Oliveira Santos
The ZigZag SMC/SMT Indicator for MT5 is the ideal tool for traders who want to accurately identify tops and bottoms based on the advanced concepts of Smart Money Concepts (SMC) and Smart Money Trap (SMT). Main Benefits: Automatic identification of strategic tops and bottoms. Based on concepts used by institutional traders. Ideal for analyzing liquidity, market structure and manipulation. Simple to use: just add it to the chart and track the critical points. ️ Free Version: This ve
FREE
Cybertrade Auto Fibonacci
Emanuel Andriato
4.9 (10)
Cybertrade Auto Fibonacci retraction and projection  - MT5 Auto Fibonacci is an indicator that automatically plots the Fibonacci retracement and projection based on the number of bars you select in the indicator setting. You can customize nine different levels of retraction and three levels of projection. It works on periods longer than the period visible on the chart. All values ​​are available in the form of buffers to simplify possible automations. This indicator is the same one we use in ou
FREE
在 MetaTrader 5 图表上,以热力图或列表查看 GER40 的 40 只股票,含行业、周期、详情和自定义列表。 JET Market Monitor GER40 PRO 在一个面板中显示构成 DAX 指数的股票。这些股票在德国市场(Xetra)交易,价格以欧元(EUR)计。在热力图中,每个方块代表一只股票:大小对应其在指数中的权重,或在经纪商提供时对应成交额;颜色对应所选周期的涨跌幅。切换到列表,即可在可排序的列中查看所有股票。 本产品仅为指标: 从不开仓、平仓或修改订单 。 热力图 排列方式:权重、成交额(经纪商提供时)、日、周、月或年涨跌幅。 按行业分组(10 个行业,标题栏显示行业的日涨跌幅)或按涨跌分组(上涨和下跌两个区块)。 每个方块背景中的价格走势线:1天、2天、1周、1个月、3个月、6个月、1年或今年。 每个方块显示:代码、公司名称(可选)、成交额和涨跌幅;较小的方块显示的行数较少。 顶部栏:GER40 组合的加权涨跌幅、上涨/下跌/平盘的股票数量以及交易时段状态。 列表模式 列:代码、名称、行业、最新价、涨跌幅、成交额和权重。 点击列标题即可排序;A−/A+
在 MetaTrader 5 图表上,以热力图或列表查看 US30 的 30 只股票,含行业、周期、详情和自定义列表。 JET Market Monitor US30 PRO 在一个面板中显示构成道琼斯工业平均指数(Dow Jones Industrial Average)的股票。在热力图中,每个方块代表一只股票:大小对应其在指数中的权重,或在经纪商提供时对应成交额;颜色对应所选周期的涨跌幅。切换到列表,即可在可排序的列中查看所有股票。 本产品仅为指标: 从不开仓、平仓或修改订单 。 热力图 排列方式:权重、成交额(经纪商提供时)、日、周、月或年涨跌幅。 按行业分组(11 个行业,标题栏显示行业的日涨跌幅)或按涨跌分组(上涨和下跌两个区块)。 每个方块背景中的价格走势线:1天、2天、1周、1个月、3个月、6个月、1年或今年。 每个方块显示:代码、公司名称(可选)、成交额和涨跌幅;较小的方块显示的行数较少。 顶部栏:US30 组合的加权涨跌幅、上涨/下跌/平盘的股票数量以及交易时段状态。 列表模式 列:代码、名称、行业、最新价、涨跌幅、成交额和权重。 点击列标题即可排序;A−/A+ 调整
在 MetaTrader 5 图表上,以热力图或列表查看 JP225 的 225 只成分股,含行业、周期、详情和自定义列表。 JET Market Monitor JP225 PRO 在一个面板中显示构成日经225指数(Nikkei 225)的 225 只股票。这些股票在日本市场(东京证券交易所)交易,价格以日元(JPY)计。在热力图中,每个方块代表一只股票:大小对应其在指数中的权重,或在经纪商提供时对应成交额;颜色对应所选周期的涨跌幅。切换到列表,即可在可排序的列中查看所有股票。 本产品仅为指标: 从不开仓、平仓或修改订单 。 热力图 排列方式:权重、成交额(经纪商提供时)、日、周、月或年涨跌幅。 按行业分组(11 个行业,标题栏显示行业的日涨跌幅)或按涨跌分组(上涨和下跌两个区块)。 每个方块背景中的价格走势线:1天、2天、1周、1个月、3个月、6个月、1年或今年(默认 1 天;仅在足够大的方块中显示)。 每个方块显示:东京代码(例如 7203)、公司名称(默认显示)、成交额和涨跌幅;较小的方块显示的行数较少,最小的方块只显示颜色(鼠标停留即可查看详情)。 顶部栏:JP225 组合
Dual Trend Analyzer
Elidio Xavier Guimaraes
The Dual Trend Analyzer: An MQL5 Tool for Statistical Correlation Analysis The Dual Trend Analyzer is a powerful MQL5 tool developed to analyze and visualize the statistical correlation between two distinct financial symbols (assets). This tool allows you to choose from three of the most widely recognized correlation methods: Pearson, Spearman, or Kendall-Tau . Identify Correlation Patterns with the Dual Trend Analyzer This indicator is designed to unveil the statistical correlation between two
Nexus Order Block Workspace
Sergejs Rozkalns
5 (2)
同一张图,同一个阅读顺序 — 每天如此。 结构、最近的区域、你在区间中的位置以及趋势的方向 — 立刻出现在屏幕上,形式始终一致。 买家赠品 — SMC Nexus Scanner Pro。 基于本指标数据的多品种扫描器:一个面板同时显示多个品种的趋势方向、有效订单块以及 BOS / CHoCH。无需额外付费 — 购买后请在 MQL5 上给我发私信,我会把它发给你。 一个面板下的十五个图层:带 BOS 与 CHoCH 的市场结构、带强度百分比的订单块、公允价值缺口、供给 / 需求、溢价 / 折价、高周期订单块、东京 / 伦敦 / 纽约交易时段,以及通常要再装一个指标才有的环境工具 — 成交量分布、线性回归通道、多周期趋势仪表盘、按最近一次结构破坏自动绘制的斐波那契、带高周期云带的 SmartTrail、WaveTrend 与 RSI Extremes。 正是这个固定顺序,把一套流程与临场发挥区分开来 — 后者是:周一你等着价格进区域,周二价格一碰到你就买,周三你又因为区域看起来太宽而把止损往外挪。 针对这一点,这个工具做两件事:画出停在原地不动的水平位,并固定你核对它们的顺序。你自己的
Perfect indicator to use No Forex or Binary Options You can use it manually or use it automated on the mt2trading platform or similar 90% winrate indicator Common questions Which brokers does this work with? IQOption.com Binary.com Alpari.com Specter.ai Instaforex.com clmforex.com GCOption.com Is it necessary to leave my pc on all day using automated mode? > although our platform must constantly run on your laptop / PC, if you want it to work while you are away, it is not necessary to leave your
Cris Levels
Cristian Juliano Bomm Reuter
5 (1)
Cris Levels é uma ferramenta visual de apoio à decisão para o MetaTrader 5 — não abre, fecha nem gerencia ordens sozinha. Ela organiza no gráfico as regiões de preço que mais importam pra sua análise, combinando módulos independentes num único indicador: • Suporte e Resistência inteligente : identifica automaticamente os topos e fundos mais relevantes, tanto na base diária (últimos N pregões) quanto na estrutura fractal do próprio gráfico. Um nível só é confirmado depois que o movimento oposto r
FREE
FiveStarFX Gold Reversal Edge Professional automated trading solution designed for structured execution and controlled risk management in the Gold market. Built for traders who value discipline, precision, and consistency. Key Features Fully automated trading One trade at a time (controlled exposure) Fixed Stop Loss and Take Profit Smart Break-Even protection Profit lock with buffer Step-based trailing management Spread protection system Works on any broker Trade Management The E
FREE
PinPoint Level
Paulo Roberto Jusviak Dambros
Pinpoint Level 是面向日内交易者和剥头皮交易者的指标。它旨在无需手动设置即可在入场或出场时提供精准性。只需将其拖到图表上,它就会立即映射当前交易日最关键的价格区域。 非常适合外汇、指数和加密货币,它会自动计算前一日振幅,并基于斐波那契投射出精确的支撑与阻力扩展位,同时让图表保持简洁,让你专注于真正重要的事情。 该指标显示买入或卖出区域。在每种走势类型中,指标都会显示价格大多数情况下可能开始或停止运动的区域。 趋势市场:它显示价格可能在哪里停止,直到回到所使用的某条移动平均线。如果你已经抓到了当日最低点或最高点,在这些位置可以进行部分减仓或平仓。 盘整市场:它显示可能的顶部和底部,在这些位置有机会捕捉下跌和上涨走势。 无论如何,都有机会抓到当日最低点或最高点。 主要功能: 零配置:即开即用。 机构级别:自动绘制当日开盘价、前一日最高价和最低价,以及每日枢轴点。 自动斐波那契扩展:投射出精确的支撑位(绿色)和阻力位(红色),分别为 61.8%、100.0%、161.8%、200.0% 和 261.8%。这些水平根据 Alexandre Stormer 的描述计算,其中
FREE
LT Volume
Thiago Duarte
4.73 (15)
LT Volume 是 MetaTrader 5 传统成交量指标的自然进化版本。它旨在提供更智能、更动态的资金流分析,远远超越传统受限的柱状显示,并提供一套强大的功能,以提升您的机构级市场解读能力。 该指标非常适合追踪流动性,并识别市场衰竭点或突破点(breakouts),让您在图表上的视觉交互更加流畅。 主要功能 灵活成交量: 支持读取 Tick 成交量或真实市场成交量(如果您的经纪商提供)。 内置移动平均线: 可完全自定义的移动平均线,直接应用于成交量直方图,用于跟踪方向性资金流。 固定水平线: 设定一个固定的警报水平,指标将绘制一条提醒线。非常适合高频策略以及识别大型市场参与者。 极致优化: LT Volume 的代码轻量且性能极高,即使在实时市场高速波动时,也能保持您的终端流畅运行。 多语言支持: 界面可动态适配 6 种语言:葡萄牙语、英语、西班牙语、俄语、日语和中文。 5 种动态配色方案(Smart Colors) LT Volume 不再只是单一灰色,而是可以根据您选择的 5 种逻辑条件,在实时状态下自动为成交量直方图上色: • K线方向:
FREE
介绍 Multi Divergence MT5,这是一款先进的交易指标,旨在通过检测多个指标之间的背离来增强您的市场分析。该工具非常适合希望通过识别价格趋势中的潜在反转和持续来改善进出场策略的交易者。 使用 Multi Divergence MT5,您可以通过快速解读表明市场动量变化的背离信号,在交易中获得显著优势。无论您是经验丰富的交易者还是刚刚起步,这个指标都提供了有价值的见解,帮助您在实时市场条件下做出明智的决策。 MQL产品安装指南 | 在 MT4/MT5 上更新已购买的MQL产品 | 常见故障排除指南 | 指标设置 / 指南 主要特点 多指标支持:利用多种指标,如 RSI、CCI、MACD 等来测量市场动量。 买卖信号触发:根据背离条件生成清晰信号,帮助交易者识别潜在的市场反转。 非重绘:确保信号保持有效,使交易决策可靠,无需对之前的信号进行二次猜测。 箭头信号:在图表上显示清晰的箭头信号,指示看涨和看跌背离,便于解读。 颜色编码条:为不同指标使用不同颜色,增强视觉清晰度,便于快速分析。 弹出警报:在信号事件上发送即时弹出警报,确保您不会错过关键的交易机会。 推送通知:向您的
ICT Projection
Joao Batista Silva
ICT Projection answers one question: "the last times the chart looked like this, where did price go next?" It searches the history of your chart for bars with the same ICT snapshot as now and draws the path price took after them, in ATR units, as a shaded area to the right of the last candle. It is a statistics tool: it shows what usually happened and how often, and it says so plainly when there is no edge. What it measures - The ICT snapshot of every bar, from 14 features: market structure, r
FREE
Full Description Overview Drawdown Controller Calculator Indicator is an advanced professional risk-management tool for MetaTrader 5 , specially designed for traders who use multiple running trades, pending orders, grid systems, and martingale strategies . This indicator allows you to see the future drawdown in advance — not only for currently running trades, but also for all pending orders combined , assuming they get triggered step by step. Instead of guessing or hoping, you will know ex
FREE
Topos e Fundos Historicos
Valter Cezar Costa
4.5 (8)
TOPOS INDICATOR AND HISTORIC BACKGROUNDS   The Indicator of historical tops and backgrounds is based on the monthly chart where sharks hide so it was developed to facilitate the identification of these regions. The available features are the Incoming Triggers alerts and notifications that are sent to the mobile phone.     Parameters 1-) Tops and Bottoms: You can change the color of the lines and the period in years and the filter range between the top and bottom and the median and consider th
FREE
Colored TRIX
Flavio Javier Jarabeck
4.67 (3)
Developed by Jack Hutson in the 80's, the Triple Exponential Moving Average (a.k.a. TRIX ) is a Momentum technical indicator that shows the percentage of change in a moving average that has been smoothed exponentially 3 times. The smoothing process was put in place in order to filter out price movements that are considered insignificant for the analysis period chosen. We at Minions Labs found hard to follow the smoothness of the original TRIX line, so we colored the TRIX line with BUY and SELL t
FREE
BB out arrows
Smaylle Rafael Coelho Mariano
BB Out Arrows   is a powerful and intuitive indicator designed for MetaTrader 5 (MT5) that enhances trading strategies using Bollinger Bands. This indicator signals potential trading opportunities by displaying arrows when a candle closes outside of the Bollinger Bands, but with an added layer of precision through a wick percentage filter. Key Features: Bollinger Bands Integration:   Utilizes the classic Bollinger Bands to identify market volatility and potential price reversals. Arrows Indicati
FREE
Simple Candle Countdown
Emanuel Cavalcante Amorim Filho
Simple candle countdown - never again miss how much time is left to open a new bar! This indicator doesn't plot any line on the chart - it uses only objects and calculates the time left to open a new bar. You can set custom colors for the panel background and border and for the text color. Simple as that, the indicator is ready to use. If you find any bugs, feel free to contact me. 
FREE
Regression Channel Pro
Hipolito Garcia Gilvan
Regression Channel Pro is an advanced trend-following indicator that automatically draws a dynamic linear regression channel on your chart and generates precise buy and sell signals based on price interaction with the channel boundaries. Unlike most signal indicators, Regression Channel Pro uses a multi-confirmation logic that reduces signal repaint by up to 90%, giving you reliable, actionable entries in real time. HOW IT WORKS The indicator ca
FREE
Caicai Cointegration Quant Tracker Important Notice: This indicator is an integral tool of the automated EA Caicai Long and Short Pair Trading . If you want the full automated solution, visit the EA page! A robust quantitative tool designed to validate Pair Trading operations. This indicator brings advanced mathematical analysis to your charts, ensuring you only trade pairs with a true statistical edge. It calculates essential metrics to validate if two assets are truly cointegrated and suitable
Mako VWAP
Danillo Boni Vitti
MAKO VWAP - 带标准差通道和HUD面板的锚定VWAP 痛点 每位交易者都知道价格围绕"公允"价值波动,但很少有人能清晰地衡量它。普通VWAP只显示按成交量加权的平均价,却无法告诉你价格已经偏离了多远。缺少这个度量,就很难判断一段行情是否仍属正常还是已经过度延伸,交易者往往在高点买入、在低点卖出,或者入场过晚。手动计算通道既费时又繁琐,而且更换品种或周期就得重来。 解决方案 MAKO VWAP是一款指标,它绘制从您所选周期起点锚定的VWAP,并在其周围绘制标准差通道。您可以直接在图表上看到平均价值所在,以及价格偏离它的程度。它不会开仓或平仓:它是一个读盘工具,而不是交易机器人。 图表上的内容 - 锚定VWAP线,按日、周、月或年重新开始(由您选择); - +1、-1、+2、-2、+3和-3倍标准差通道:通道1标示价值区域,通道2提示超买或超卖,通道3提示统计意义上的衰竭; - 上一交易时段收盘VWAP线,可作为参考; - 当价格离开价值区域或进入衰竭区域时,K线自动变色。 HUD面板 现代化且可拖动的面板显示当前价格、偏离度仪表、价格所处区域(Value Area、B
GDXM Multi Symbol Comparisson Window
Gustavo Barros Alexandre D Almeida
4 (1)
GDXM Multi Symbol Comparisson Window The Multi Symbol Correlation Oscillator GDXM is a precision tool engineered for institutional traders and Smart Money Concepts (SMC) practitioners. This version operates in a separate window, transforming the price action of up to 5 assets into a normalized 0–100% efficiency scale. It is the perfect solution for identifying high-probability divergences without cluttering your main price chart. There is a version for the main chart . By isolating asset moveme
FREE
Order Book Heatmap B3 PRO:适用于 MetaTrader 5 中任何交易所期货和股票的可视化订单簿与实时流动性热力图,提供大单、撤单和强烈失衡警报。 显示内容 经纪商发送的所有实时价位(每侧最多 64 档),绘制在图表右侧并与价格刻度对齐。 扩展订单簿:之前出现过、超出实时深度的价位会以淡色保留在订单簿中,显示最后看到的数量。120 分钟后会被清除(可调)。 K线后方的流动性热力图:逐分钟显示大额挂单曾经所在的位置。绿色为买单,红色为卖单,金色为大单。只绘制强价位,图表保持简洁。 大单以金色突出显示,大单未成交即离开订单簿时显示 PULLED 标签。 最优 5 档的买卖失衡条。 订单簿底部的警报日志,显示最近 10 条警报,按方向着色(绿色买入,红色卖出)。 两种布局:Aligned 和 Ladder。Auto 会根据图表缩放自动选择合适的布局。支持浅色和深色背景。 警报 BIG:价格附近出现大单(默认 10 个跳动点)。 PULL:大单未成交即从订单簿中撤出。 IMB:最优价位出现强烈的买卖失衡。 默认使用声音提醒。也可使用弹窗、推送通知和电子邮件。图表上的日
FVG Smart Filter
Samuel Henrique Almeida Ferreira
5 (1)
FVG Smart Money Filter is an advanced Fair Value Gap (FVG) indicator designed to identify institutional imbalances with higher precision. Unlike traditional FVG indicators, this tool combines multiple filters to reduce false signals and improve trade quality. MAIN FEATURES: - Automatic detection of bullish and bearish FVG zones - 50% equilibrium level (midpoint) - Dynamic projection of zones on the chart - Touch counter system - Mitigation by touch or candle close FILTERS INCLUDED: Trend F
FREE
Atlas Fluxo Quant
Thiago Alves Monteiro
AtlasFluxoQuant EA - Versão v1.19 商业描述 AtlasFluxoQuant EA 是一款革命性的 MetaTrader 5 专家顾问(Expert Advisor),由 Atlas Quant开发, 专为追求自主性和精准交易的交易者设计。这款独立版本(v1.19)代表了自动化交易演变的巅峰,结合了先进的技术分析与专业的风险管理,一切都集成在一个无外部依赖的文件中。 独特的自主技术 与市场上大多数 EA 不同, AtlasFluxoQuant可完全独立运行,无需外部指标或额外文件。所有分析能力都集中在一个 MQ5 文件中,确保: 简化安装 :只需将 EA 附加到图表,即可开始交易 增强稳定性 :无外部依赖,避免欺诈风险 优化性能 :高效计算报告,快速响应市场变化 全面兼容性 :适用于任何 MT5 安装,无需额外设置 先进的市场结构识别系统 AtlasFluxoQuant采用自主算法精准识别关键市场结构,以发现高概率交易机会: 结构破位(BOS) :精确识别趋势反转 订单块(OB) :检测机构交易的流动性区域 公平价值缺口(FVG) :寻找价格不均
该产品的买家也购买
Trend Sniper X
Sarvarbek Abduvoxobov
4.87 (46)
Trend Sniper X 是一款适用于 MetaTrader 5 的多周期趋势跟踪指标,可帮助交易者清晰精准地识别趋势方向和潜在的反转点。 适用于 MT4: https://www.mql5.com/en/market/product/193245 价格信息: 当前价格为促销价,随着后续更新和新功能的推出,价格可能会有所变动。 赠品优惠: 购买后联系作者,即可免费获取该指标的 Auto-Trade Assistant EA(自动交易助手 EA)。 Code2Profit 频道 通过多时间框架分析掌控市场! 如何使用 Trend Sniper X 最大化您的胜率:核心规则与交易时段技巧 技术规格 平台 MetaTrader 5 指标类型 多时间周期趋势指标 运行时间周期 任何图表时间周期,可独立选择更高的时间周期 (M1–MN1) 主要交易品种 外汇、黄金 (XAUUSD) 及其他差价合约 (CFD) 推荐账户 任何账户类型 可视化 彩色趋势蜡烛 (买入/卖出/微弱/变化) + 买入/卖出箭头 附加模块 交易时段方框 (悉尼、东京、伦敦、纽约) 主要功能 多时间周期趋势分析: 直接在
全新王者降临 - 指标 + 订单管理提示(TP1 + TP2 + TP3)+ 可选 Telegram 信号发送器 INCLUDED(免费) (完整交易与信号系统) 我们最强的黄金 EA: Gold Slayer 该指标包含先进的交易策略、可自定义订单管理系统,以及结合 Envelope 扩展的均值回归系统,并通过 RSI 等多重智能确认过滤器进行验证,以捕捉高概率反转入场机会,提供 BUY 与 SELL 信号。 你不仅能够学习如何交易,还能学会如何高效管理多个仓位,并利用之前盈利的持仓来覆盖亏损交易。 专为 M5 周期打造并优化,在 BTCUSD 和 XAUUSD 上表现尤为出色,因为这些市场的流动性能够让信号更加干净、可靠。 该指标会自动生成清晰的多头(Long)与空头(Short)信号,同时基于 ATR 自动计算入场位、止损位和止盈位,让风险管理从一开始就融入系统之中。 多 TP 系统设有三个渐进式目标位,你可以在 TP1 锁定部分利润、在 TP2 继续持仓,并在更大的行情中将仓位持有至 TP3,而这正是平均风险回报比真正开始大放异彩的地方。 默认参数开箱即用,已经针对稳定表现进行
Smart Trend Trading System — MetaTrader 5 购买后,请在 MQL5 上给我发消息,即可免费获得 Smart Universal Expert Advisor,以及在线课程、PDF 手册和私人群组访问权限。 STTS 将趋势方向、入场和出场信号、反转区域及重要价格水平集中呈现在图表上。您可以根据系统手动交易,也可以连接单独的兼容 EA,按照您选择的设置自动执行交易。 一套系统,四种交易思路 STTS 将交易方法分为四大类: • 剥头皮交易 — 跟踪短期信号和市场波动。 • 趋势交易 — 评估方向,寻找趋势中的交易机会。 • 反转交易 — 识别潜在的转折区域和方向变化。 • 成交量交易 — 利用成交量相关信息评估市场活跃程度。 入场和出场箭头、趋势信息、支撑与阻力位及反转区域,帮助您直接在图表上分析交易形态。 先从一种方法开始。了解其信号和设置后,再探索其他方法。 从信号到自动化 Smart Universal Expert Advisor 可连接 STTS,让您自动执行受支持的交易信号。 启用自动交易前,请配置指标连接、仓位大小和交易管理设置
Entry Points Pro for MT5
Yury Orlov
4.55 (153)
Entry Points Pro 会在您下单之前,告诉您在哪里入场、止损放在哪里、用多大的手数交易。 价格 现在 199 USD,按此价格出售 8 份,之后为 249 USD。最终价格为 349 USD。 我靠交易市场赚钱,并公开展示,所以我不需要把这个指标卖给所有人。它是为独立思考的交易者准备的工具,而不是一个神奇按钮。 没有突破,就没有交易。灰色箭头表示信号已取消:价格没有突破信号K线,因此没有入场,也没有亏损。 箭头在 K 线收盘时出现,并且不会重绘。只有两项设置:您的本金和每笔交易的风险。 付款前先验证:免费演示版可在 MT5 策略测试器中运行,只需两分钟。购买后,我会亲自帮您完成设置。 2019 年,我向全世界展示了这款指标的能力。我按它的信号手动交易,用的是真实账户,全程公开——账户在 Myfxbook 上接受监控,我还在 Facebook 上详细记录了这次实验。结果:10,000 美元在四个月内变成了 941,411 美元。风险是我有意设得极高的——回撤一度达到 54%,因为在我们这一行,利润和风险总是相伴而行。Myfxbook 的截图就是图库中的第一张图片。 看来
M5 Sniper
MeanFX
5 (4)
让您的交易优势尽在视野之中! M5 Sniper 是 MeanFX 推出的一款全新指标。它将 精准的交易信号 与 自适应 TP/SL 水平 相结合——从而创造出最佳的统计交易机会! 每售出 5 份,价格上涨一次,下一价格为 69$ 购买后请给我发消息,以获取技巧/指南和奖励 EA 它有哪些突出优势? 经过验证的统计表现 ,适用于 Gold XAUUSD( 几乎适用于每一种资产 ,专注于掌握一个时间周期,而不是试图面面俱到却无法获得稳定的结果) 每天每个交易品种 1 至 8 笔交易 ,具有较高的胜率百分比,并让所有统计优势站在我们这一边 图表上 仅显示已确认的 BUY 和 SELL 信号 自适应 TP 和 SL 水平 ,由指标针对每笔交易生成 平均胜率 75%+ 平均 Signal Ratio 最低 1.1+ 警报 和通知也会发送至 手机 **适合 Prop Firm(资金管理公司)**的交易方式 易于理解——适合 所有经验水平 的交易者 创作者提供的个人支持 100% 不重绘、不重新绘制、不滞后 奖励自动化 Expert Advisor(EA) 背后的策略: M5 Sniper 基于
Gann Made Easy MT5
Oleg Rodin
5 (13)
Gann Made Easy   是一个专业且易于使用的外汇交易系统,它基于使用先生理论的最佳交易原则。 W.D.江恩。该指标提供准确的买入和卖出信号,包括止损和获利水平。您甚至可以使用推送通知在旅途中进行交易。 购买后请联系我,即可免费获得交易指导和超棒的额外指标! 您可能已经多次听说过江恩交易方法。通常 Gann 的理论不仅对于新手交易者而且对于那些已经有一定交易经验的人来说都是非常复杂的东西。这是因为江恩的交易方法在理论上并不那么容易应用。我花了几年时间来完善这些知识,并将最好的原则应用到我的外汇指标中。 该指标非常易于应用。您所需要的只是将其附加到您的图表并遵循简单的交易建议。该指标不断进行市场分析工作并寻找交易机会。当它检测到一个好的入口点时,它会为您提供一个箭头信号。该指标还显示止损和获利水平。 换句话说,当您像先生一样进行交易时,该指标会为您提供最佳江恩建议。江恩亲自告诉你此时此刻该做什么。但最好的部分是您不需要了解任何有关江恩交易原则的知识,因为该指标会为您完成整个市场分析工作。
Ultra Indicator
Ihor Otkydach
5 (1)
ULTRA 是一項採用「一站式」運作模式的技術指標——它能獨立分析市場、產生交易訊號、顯示設定停損單的價位,並建議何時平倉以鎖定獲利或將損失降至最低。 換句話說,無論您是否懂得分析市場、判定價位(該將停損設在哪裡),或是對資金管理感到棘手,都無妨。ULTRA 會為您處理所有這些事情! 買家專屬好禮 : 購買 ULTRA 指標後,請透過私訊聯繫我,即可免費獲贈「ULTRA BOT」。這是一款特別設計的工具,能協助您根據該指標發出的訊號來管理已開倉的交易(它會為每筆交易設定停損點,並依照策略規則自動平倉,以爭取最佳交易結果)。 我還會為買家提供各種資產的預設參數,讓該指標能發揮最大效能。請透過私訊聯繫我,免費獲得這些超級好處! ULTRA 策略的運作方式 ULTRA 指標會分析歷史價格數據(涵蓋約過去 4 年),並自動學習辨識波段反轉,以便在實際交易中為您創造最大利潤。 該指標的訊號絕不會重新繪製!!一切都盡可能做到真實且直觀! ULTRA 指標運用特殊的虛擬化演算法,根據歷史數據計算所有訊號的結果,並將其交易成果顯示於儀表板上。這意味著您甚至在開始交易之前,就能預先了解 ULTRA 指標
Zoryk Gold
Reda El Koutbane
4.79 (19)
折扣将在 24 小时后结束——下一价格为 69 美元 ZORYK — MetaTrader 5 专用高级 XAUUSD 黄金信号系统 你一定熟悉这种感觉。 你花了很多时间分析黄金,等待合适的入场机会。终于开仓后,价格却立刻朝相反方向移动。你过早平仓、移动止损,或者只犹豫了几秒钟。随后,市场却在没有你的情况下到达了你原本预期的目标。 问题并不总是方向判断错误。 真正的问题是缺乏确定性。 你不知道准确的入场位置在哪里。 你不知道什么时候交易逻辑已经失效。 你不知道应该先锁定较近的利润,还是继续等待更大的行情。 你也不知道当前信号是否足够强,还是自己只是在强行寻找交易机会。 黄金市场变化非常快。一个没有明确计划的好想法,可能在几秒钟内变成错误的交易决定。 ZORYK 正是为了解决这个问题而开发。 什么是 ZORYK ZORYK 是一套完整的 XAUUSD 黄金信号与交易计划系统,专门为 MetaTrader 5  和 M5 时间周期 开发。 它不是一个只显示 BUY 或 SELL 箭头,然后让你独自决定其余所有内容的简单指标。 每个确认后的信号都可以在图表上显示完整的可视化交易计划,包
SuperScalp Pro
Van Minh Nguyen
4.54 (37)
SuperScalp Pro - Professional Multi-Layer Confluence Scalping System SuperScalp Pro 是一款先进的剥头皮交易指标,在经典 Supertrend 的基础上加入了多种智能确认过滤器。它可以帮助您识别成功概率更高的 Buy/Sell 交易机会,同时显著减少虚假信号。 清晰的 Buy 和 Sell 箭头会直接显示在图表上,并实时自动计算基于 ATR 的 Stop Loss 和 Take Profit 水平。 购买后,请通过 MQL5 给我发送消息,即可免费获取 SuperScalp Pro Auto Trader EA、用户指南以及私人群组的访问权限。 下载推荐的设置文件: [Set File] 完整文档请参阅产品博客: [User Guide] 加入官方频道,获取最新更新: [Official Channel] SuperScalp Pro 如何工作? 只有当多个确认层同时满足条件时,指标才会生成信号(趋势 + 动量 + 成交量 + 波动率 + 高时间周期趋势)。 Multi-Timeframe (MTF)
SMC Intraday Formula
VividMind Digital Solutions
5 (26)
让我们先坦诚一点。 没有任何一个指标可以单独让你实现盈利。如果有人告诉你可以,那他是在向你兜售一个梦想。任何显示完美买卖箭头的指标都可以被做得看起来毫无瑕疵——只需要放大历史中的某一段并截取成功交易的截图。我们不会这样做。 SMC Intraday Formula 是一个工具。 它为你读取市场结构,标记出概率最高的价格区域,并用简单直白的语言准确告诉你当前智能资金的行为轨迹。你仍然需要做决定。你仍然需要执行交易。但现在,你是带着精确性执行,而不是靠希望。 我们已经在黄金(XAUUSD)以及主要外汇货币对的日内剥头皮交易中使用该指标将近三年。这是我们在 M1、M5、M15 和 M30 上的日常主力工具。它之所以有效,是因为它不试图预测未来——它展示的是当前正在形成的高概率交易机会,并解释 为什么 。 它与其他所有指标有什么不同? 大多数交易指标只做一件事。移动平均线交叉。振荡指标触及某个水平。出现一个箭头。你进场交易。你亏损。你责怪指标。重复。 SMC Intraday Formula 将多个机构级概念整合为一个统一的市场解读: - 斐波那契共振引擎 不只是普通的斐波那契水平——该指标
GoldenX Entry MT5
VividMind Digital Solutions
5 (17)
GoldenX Entry 是一款用于 MT5 的指标,包含自适应 Smart Entry Trend 算法、信号评分系统、市场状态识别器以及波动率过滤器。每个信号都包含计算得出的入场位、三个止盈位(TP1、TP2、TP3)以及止损位。它基于多个分析层构建,旨在适应不同市场条件,将多层分析系统与内置优化器及统计跟踪系统相结合。该指标基于风险收益比(RR)指标和历史交易行为提供量化分析。 开始使用非常简单——在所选时间周期上运行优化器,然后在图表上开始使用该指标。 核心功能 GoldenX Entry 将信号引擎与内置交易管理及历史统计跟踪整合在同一图表中: - 内置优化器: 优化器可在图表上单击运行。它通过两阶段搜索流程测试200种参数组合——先进行探索,再进行优化——并在完成后自动应用选定配置。结果会按时间周期缓存,因此当返回已优化的周期时,会立即恢复相同设置。 - 黄金品种自动周期识别: 将指标加载到任何 XAUUSD 图表(M1 到月线)。系统会自动识别当前周期并加载对应预设。共包含9个时间周期配置文件,专为黄金在标准周期上优化设计。切换周期时,参数会自动调整。 - 资金参考面
Gold Trend Coach MT5
Cristhian Alexander Gaibor Cuasquer
4.27 (11)
MetaTrader 5 黄金(XAUUSD)买卖信号,不重绘。每个信号都自带止损和三个止盈。Smart Money Concepts 过滤,实时标出 BOS 和 CHoCH,让你顺着结构交易,而不是逆势硬扛。面板上的实时导师,从入场到 TP3 一步步带着你走。信号直接推送到你的手机和你自己的 Telegram 频道。这就是 Gold Trend Coach。从此不再孤军奋战。 购买即送买家礼包: 1. Telegram Alert Bridge: 信号推送到你自己的 Telegram 频道,附图表截图和每日报告。 2. 使用手册和安装设置指南。 如何领取: 礼包不在下载文件里。购买后通过 MQL5 站内信联系我,当天发给你。 $39 和 $45 的首发份额已售罄。现价 $59,仅限接下来 10 份,之后 $79。 先说实话。 我自己不用的指标,绝不会拿出来卖。我每天都用 Gold Trend Coach 手动交易黄金,周期 M1、M5 和 M15,只在出现顺我方向的 CHoCH 或 BOS 之后才接信号。 你大概已经试过几十个黄金指标。大多数只给你一个箭头,然后把最难的部分丢给你:
Azimuth Pro
Ottaviano De Cicco
5 (7)
Azimuth Pro V2:MT5合成分形结构分析与确认入场 概述 Azimuth Pro 是 Merkava Labs 推出的多层级波段结构指标。四层嵌套波段层级、锚定波段的VWAP、ABC形态识别、三时间框架结构过滤以及收盘确认入场——一个图表,一个从微观波段到宏观周期的完整工作流程。 这不是盲目的信号产品。它是一个以结构为先的工作流程,专为重视位置、背景和时机的交易者打造。 1. V2的变化 合成多时间框架引擎 高时间框架分析从零开始重建,采用与Meridian Pro相同的专有合成架构。更清晰的HTF背景、稳定的实时行为、无经典MTF同步问题。合成引擎还解锁了 固定比率时间框架级联 (x2、x3、x4、x6)——不再在经纪商的固定时间框架之间任意跳转,您可以按图表时间框架的固定倍数分析结构,在每个尺度上保持相同的分形关系。 确认入场箭头 作为稳定且可恢复的执行层而设计的收盘确认箭头。当ABC设置形成且自适应确认逻辑在收盘K线上验证方向时,箭头会写入下一根K线的开盘,并设计为在刷新、切换时间框架、重新加载指标或重启终端等正常图表生命周期事件后仍能一致恢复。 这些不是独立的买
FX Power MT5 NG
Daniel Stein
5 (33)
FX Power:分析货币强度,助您做出更明智的交易决策 概述 FX Power 是一款专业工具,帮助您全面了解主要货币和黄金在任何市场条件下的真实强度。通过识别强势货币用于买入,弱势货币用于卖出, FX Power 简化了交易决策,并帮助您发现高概率的交易机会。不论您是想跟随趋势还是通过极端的 Delta 值预测反转,这款工具都能完美适应您的交易风格。别再盲目交易——用 FX Power 让您的交易更加智慧。 1. 为什么 FX Power 对交易者极具价值 实时货币和黄金强度分析 • FX Power 实时计算并显示主要货币和黄金的相对强度,助您全面了解市场动态。 • 监控领先或落后资产,轻松识别值得交易的货币对。 全面的多时间框架视图 • 跟踪短期、中期和长期时间框架的货币和黄金强度,以便将您的交易策略与市场趋势保持一致。 • 无论是快进快出的短线交易还是更长期的投资策略, FX Power 都能为您提供所需的信息。 Delta 动态分析用于趋势和反转 • 极端 Delta 值常常预示反转机会,而平缓的 Delta 变化则确认趋势延续。 • 使用 Delta 分析,轻
FiboSniper Pro
Van Minh Nguyen
5 (4)
FiboSniper Pro – Multi-Filter Fibonacci System with Auto SL/TP and Control Panel FiboSniper Pro 是一款技术指标,将动态 Fibonacci Envelopes 与多个确认过滤器相结合,以生成经过筛选的 Buy 和 Sell 信号。Fibonacci 水平基于 Moving Average 和 ATR 计算,然后通过 ADX、EMA、RSI、ATR、Volume、Time 和 Candle 结构进行过滤。该指标直接在图表上显示基于 ATR 自动计算的 Stop Loss 和 Take Profit 水平,并提供交互式控制面板,以便快速调整参数。 购买后,请通过 MQL5 给我发送消息,即可免费获取 Auto Trader X,以及有关如何将该指标的交易信号自动化的说明。 用户指南和设置文件: [Click here] 完整文档请参阅产品博客: [Click here] 加入官方频道获取最新更新: [Click here] 专为偏好结构化入场和清晰风险管理的交易者设计,适用于 Gold (XAU
Power Candles MT5
Daniel Stein
4.58 (12)
Power Candles V3 - 自我优化的强度指标 Power Candles V3 把货币与品种的强度直接转化为图表上可执行的交易方案。指标不再仅根据强度给K线着色,而是在后台持续运行实时自动优化,为您正面对的品种给出最佳 Stop Loss、Take Profit 与信号阈值。一键采用,Entry、Stop Loss、Take Profit 线就以精确价格绘制在图表上,提醒消息中直接包含方向。 本工具是 Stein Investments 生态系统的一部分 - 18+ 款工具,加上 Max,您的一对一 AI 交易导师。  随时在线,深入了解每一款指标,在您需要梳理思路的那一刻就在那里。  立即认识他: https://stein.investments 每根收盘K线运行 3,000+ 次交易模拟。9 种强度状态。2 种策略并行测试。一键采用最优配置。 为什么需要这个 大多数强度指标只给您一个数值,然后留下三个问题:相信哪个阈值、用哪个 Stop Loss、走哪个交易方向。Power Candles V3 在每根收盘K线上自动回答这些问题。结果就是一个完整的交易方案 -
M1 Sniper MT5
Oleg Rodin
5 (7)
M1 SNIPER   是一款易于使用的交易指标系统。它是一个专为 M1 时间框架设计的箭头指标。该指标可以作为独立的系统在 M1 时间框架下进行剥头皮交易,也可以作为您现有交易系统的一部分使用。虽然该交易系统专为 M1 时间框架交易而设计,但它也可以用于其他时间框架。我最初设计此方法是为了交易 XAUUSD 和 BTCUSD。但我发现这种方法在其他市场交易中也同样有用。 指标信号既可以顺势交易,也可以逆势交易。我教授一种特殊的交易技巧,帮助您利用指标信号进行双向交易。该方法基于使用特殊的动态支撑位和阻力位区域。 购买后,您可以立即下载 M1 SNIPER 箭头指标。此外,我还为所有 M1 SNIPER 工具用户免费提供下方屏幕截图所示的 Apollo Dynamic SR 指标!这两个指标的组合可以帮助您更轻松、更准确地利用 M1 时间框架进行交易。 购买后请联系我,免费获取交易提示和奖励指标! 祝您交易成功!
Gold Entry Sniper
Tahir Mehmood
5 (23)
Gold Entry Sniper – 专业多周期ATR黄金交易仪表盘,适合黄金剥头皮与波段交易 Gold Entry Sniper 是一款先进的 MetaTrader 5 指标,旨在为 XAUUSD 及其他品种提供精准的 买/卖信号 。基于 ATR 移动止损逻辑 和 多周期分析仪表盘 ,适合剥头皮交易者与波段交易者,帮助识别 高概率黄金入场点 。 主要功能与优势 多周期信号分析 – 同时显示 M1、M5、M15 趋势方向。 基于ATR的动态止损 – 根据波动性自动调整。 专业图表仪表盘 – 展示信号状态、ATR水平、线性回归中线和交易方向。 清晰买卖标记 – 自动箭头与文字标签提示。 离场提示与交易管理 – 自动检测离场信号锁定利润。 全面自定义 – 调整仪表盘位置、颜色、字体及参数。 专为黄金优化 – 适用于 M1至M15 黄金剥头皮 ,也适合外汇、指数与加密货币。 为什么选择 Gold Entry Sniper? 为追求 快速、精准、可视化交易决策 的交易者打造,ATR 与多周期确认结合,帮助你抓住 最佳黄金入场点
Atomic Analyst MT5
Issam Kassas
4.51 (65)
Atomic Analyst — MetaTrader 5 购买后,请在 MQL5 上给我发消息,即可免费获得 Smart Universal Expert Advisor,以及在线课程、PDF 手册和私人群组访问权限。 Atomic Analyst 将价格行为、趋势方向、入场和出场信号、止损位及多个止盈位集中呈现在图表上。 看清信号,理解交易形态 Atomic Analyst 将分析结果整理为清晰的可视化信息: • 买入和卖出箭头,用于识别潜在的入场机会。 • 止损位和多个止盈位,帮助规划交易。 • 趋势、强度和动量读数,用于评估市场方向。 • 多时间周期分析,用于比较更广泛的市场背景。 • 彩色K线和提醒,帮助您跟踪变化的市场条件。 结合辅助分析查看信号,再判断该交易形态是否符合您的交易规则。 从短期形态到更大级别的行情 您可以将 Atomic Analyst 用于剥头皮交易、日内交易,或跟踪持续时间更长的市场走势。 建议从 H1 时间周期开始。建议交易品种包括 EURUSD、AUDUSD 和 XAUUSD。 从信号到自动化 Smart Universal Expert A
SQN Max indicator for MT5 by ITC
Renaud Herve Francois Candel
Sqn Max Indicator Sqn Max is an exclusive indicator to trade the market with high effectiveness. The indicator is based on price action, volatility and trend. This indicator is as simple as possible but not too simple. The indicator can generate alerts to ease the trading process. You don't have to stay all day in front of your screen. The indicator can be used with any class of assets and with any time frame. It is possible to achieve better results trading our list of selected assets. We achi
Auto Optimized SpeedAngle 是一款机构级的动量向量化系统,通过持续的前瞻优化(Walk-Forward Optimization, WFO)彻底消除了曲线拟合(curve-fitting)。该指标没有采用在市场 状态转换时容易失效的静态输入参数,而是利用出样外验证(Out-of-Sample, OOS) dynamically 动态重新校准设置,从而确保显示的 信号代表真正的统计优势,而非历史巧合。 核心机构级架构 前瞻优化引擎(Walk-Forward Optimization Engine): 核心算法持续扫描数千种回溯周期(lookback)与阈值组合,严格将数据划分为样本内(in-sample)和样本外(out-of-sample)。只有当参数配置在未知数据环境中证明具备数学优越性时,系统才会对其进行 adoption。 量化目标函数(Quantitative Objective Functions): 优化引擎不一味追求绝对毛利,而是聚焦于机构级的稳定性指标。用户可针对系统质量数(SQN)、期望值(每笔交易的平均 R 倍数)或净 R 值进行优化,从而优
Apex Patterns PRO 购买指标 — 免费获取基于该指标的 Expert Advisor。 自我优化的图表形态与突破分析智能 传统的形态扫描器依赖固定输入,在市场波动和结构发生变化时通常表现不佳。 Apex Patterns PRO 旨在适应不断变化的市场条件,将结构性图表形态识别、动量过滤和统计自我优化结合到一个分析框架中。 适应性扫描引擎 自我优化形态模式 在近期历史数据中自动搜索合适的形态参数,使指标能够根据当前市场行为调整其结构检测,而不是使用静态配置。 智能突破过滤 将经典形态识别与动量、成交量和价格行为指标相结合。引擎不会同等对待每次突破,而是评估潜在的市场结构,以识别符合当前统计环境的交易设置。 主要功能 固定的、不重绘的实时信号 自我优化的形态检测参数 丰富的图表结构库(顶部/底部、头肩顶/底、三角形、楔形) 基于动量和成交量的突破过滤 基于市场结构的动态止损和止盈水平 图表信号和实时性能指标 标准的推送、电子邮件和平台提醒 专为适应不断变化的市场条件而设计,而非依赖永久固定的参数 核心理念 目标不是将静态的几何形状强加于动态的市场。 目标是让历史市场数据
Divergence Bomber
Ihor Otkydach
4.89 (94)
购买该指标的每位用户将额外免费获得以下内容: 原创工具“Bomber Utility”,该工具会自动跟踪每一笔交易,设置止损和止盈点,并根据策略规则自动平仓; 适用于不同交易品种的指标设置文件(Set 文件); 三种不同风险模式下的 Bomber Utility 设置文件:“最低风险”、“平衡风险” 和 “观望策略”; 一套详细的 视频操作手册,帮助您快速完成安装、配置并开始使用本交易系统。 注意: 要获取以上所有赠品,请通过 MQL5 的私人消息系统联系卖家。 我为您介绍原创的自定义指标 “Divergence Bomber”(背离轰炸机),它是一套基于 MACD 背离交易策略 的“全功能”交易系统。 该技术指标的主要任务是识别 价格与 MACD 指标之间的背离,并发出交易信号(包括推送通知),指示未来价格可能的运动方向。平均而言,这些信号的准确率超过 98%。有关该指标如何工作的详细说明,请观看本页面上的视频演示。 该系统使用 止损订单 和 动态回撤平仓机制 来管理交易。 Divergence Bomber 指标的主要特点: 支持交易的品种: AUDCAD、AUDCHF、AUDS
下一次更新 — 版本 2.52 即将推出![全新功能] 准备迎接 4 项重大新功能,全面提升您的市场分析能力与交易流程! 我们将通过 4 项全新功能,进一步提升市场分析水平,满足您的交易需求。现为您介绍: 1. TRADE OVERVIEW DASHBOARD 2. CONFLUENCE AT ZONE 3. STRONG & WEAK HIGH/LOW 4. OTE 1. TRADE OVERVIEW DASHBOARD 一个帮助您更轻松地了解整体市场状况的仪表盘,为您的交易决策提供参考指引,帮助您系统地分析市场并规划交易,所有信息尽在一个屏幕中。 多时间周期市场概览(Multi-Timeframe Market Overview) 更清晰地了解市场方向与价格结构 快速查看市场状况 为系统化市场分析和入场规划提供指引。 2. CONFLUENCE AT ZONE 当价格进入关键区域时……您将了解有多少项支持因素相互吻合。 关键区域是交易决策至关重要的地方。但仅仅是价格进入某个区域还不够。此功能可帮助您在入场交易前,识别相互吻合的因素,包括信号及其他相关因素,从而进行更全面的分析,并
Adaptive Price Action Engine 买指标,免费送EA 自适应多时间框架趋势与K线形态智能分析系统 市场环境始终在变化,不同的市场阶段中,并非所有 Price Action 形态都具有相同的参考价值。 Adaptive Price Action Engine 旨在适应不断变化的市场条件,将 趋势结构、多时间框架分析、K线形态与统计优化 整合到一个统一的分析框架中。 两种自适应模式 Dual Alpha Trend Mode(双 Alpha Trend 模式) 自动搜索适合的 Alpha Trend 参数,并结合低周期与高周期市场结构,使指标能够根据近期市场行为动态调整趋势识别。 Candlestick + Alpha Mode(K线 + Alpha 模式) 将 Alpha Trend 市场状态与 22种多空K线形态 相结合。系统不会简单地对所有形态一视同仁,而是对不同的形态组合进行统计评估,并识别在特定市场环境下表现出更强历史统计特征的配置。 主要功能 趋势参数自动优化 多时间框架市场状态分析 22种多头与空头 Price Action K线形态 对数千种可能
货币强度向导是一个非常强大的指标,为您提供成功交易的一体化解决方案。该指标使用多个时间范围内所有货币的数据来计算这个或那个外汇对的力量。此数据以易于使用的货币指数和货币电力线的形式表示,您可以使用它们来查看这种或那种货币的力量。 您所需要的只是将指标附加到您要交易的图表上,该指标将向您显示您交易的货币的真实强度。该指标还向您显示买卖量压力的极值,您可以在顺势交易时利用这些压力。该指标还显示了基于斐波那契的可能目标。该指标可用于各种交易时间范围。该指标支持各种货币对的交易。   该指标为您提供所有类型的警报,包括推送通知。 购买后请联系我。我将与您分享我的交易技巧,并免费为您提供丰厚的红利指标! 祝您交易愉快,获利丰厚!
Naked Forex Tweezer Pro Indicator Tweezer Pro Indicator is a pattern recognition indicator for Forex, Stocks, Indices, Futures, Commodities and Cryptos. The standard Tweezer is a two bar pattern. Our enhanced version is a multi-bar pattern. We filter the patterns for you so that you only get the     best and most effective patterns   and ignore the noise. The Tweezer pattern is a simple and effective pattern to trade. The strategy that comes with the Tweezer is based on price action. The Twe
Unix Scalper
Issam Kassas
4 (4)
Unix Scalper — MetaTrader 5 购买后,请在 MQL5 上给我发消息,即可免费获得 Smart Universal Expert Advisor,以及在线课程、PDF 手册和私人群组访问权限。 发现交易形态,看清交易计划,选择执行方式。 UNIX Scalper 将市场分析、BUY/SELL/WAIT 决策以及 Entry、Stop Loss、TP1 和 TP2 水平集中在一个清晰的面板中。 看清信号与交易计划 • 明确的决策:BUY、SELL 或 WAIT。 • 明确的价格水平:Entry、Stop Loss、TP1 和 TP2。 • 多时间周期概览:比较面板中各时间周期的信号。 • 辅助分析:趋势、动量、成交量、波动率、支撑与阻力,以及市场质量。 • 灵活的布局:Minimized、Compact、Standard 或 Full。 查看信号,检查价格水平,再判断该交易形态是否符合您的交易规则。 从黄金和比特币开始 建议首先使用的交易品种:XAUUSD 和 BTCUSD。 探索短期剥头皮交易和较高时间周期分析。选择历史K线范围,通过表现曲线查看所选设置
FX Levels Premium indicator for MT5
Renaud Herve Francois Candel
Fx Levels Premium Indicator Support and Resistance are important concepts in trading. Fx Levels Premium was created to easily draw important levels of support and resistance for the active trader. The indicator will give you all important levels (support/resistance) to watch for a wide range of assets. Trading without these levels on your chart is like driving a car for a long journey without a roadmap. You would be confused and blind. Support and resistance levels should be used as guideline
Smc Pro ToolKit
Talal N Z Aljarusha
5 (13)
SMC PRO TOOLKIT — 智能资金分析与结构化交易规划 SMC Pro ToolKit 是一款面向 MetaTrader 5 的专业智能资金概念(Smart Money Concepts / SMC)分析工作空间。 它将市场结构、多周期分析、机构级价格区域、交易机会评估、确认工具、成交量背景、提醒系统和风险规划整合在一个结构清晰的图表环境中。 一个工作空间,多层确认,一套结构化交易计划。 打开完整用户指南 多条件交易机会引擎 SMC Pro ToolKit 的核心是一套 多条件交易机会引擎 。 该引擎不会依赖单一指标或单一市场事件,而是通过多个层面的市场信息,对潜在交易机会进行综合评估。 系统会分析市场结构和背景条件,将各项结果整合为 交易机会质量评分 ,并且只有在所需确认框架完整成立后,才会展示相应的交易思路。 市场背景 → 多周期一致性 → 智能资金区域 → 确认信号 → 质量评分 → 交易计划 当交易机会满足条件时,SMC Pro ToolKit 可以直接在图表上生成完整的交易计划,包括: 买入 / 卖出方向 入场价 止损价 止盈价 风险回报比 交易机会质量
作者的更多信息
RBM Flow Footprint
Renato Brendim Medici
RBM Flow Footprint Read what happens inside every candle. RBM Flow Footprint shows, at each price level, how much was traded by buyers and sellers, right on your MetaTrader 5 chart, in a clean, dark, professional design. Instead of deciding only by candle body and wick, you see where the market really fought, where one side took control, and where price moved through without finding interest. What you see on the chart Bid x Ask footprint: each candle becomes a column. The left half shows selling
FREE
RBM Quick Entry Panel
Renato Brendim Medici
RBM Quick Entry Panel PRO SHORT DESCRIPTION One-click on-chart entry panel: lot size, stop loss, take profit, up to 3 partial exits and automatic breakeven. FULL DESCRIPTION Anyone who trades every day knows the hard part is rarely the analysis. It's the execution. Opening the order window, typing the lot, working out the stop, remembering to take partials, moving to breakeven at the right moment. In a fast market every one of those steps costs seconds and leaves room for mistakes. RBM Quick Ent
FREE
RBM Gold Liquidity Hunter
Renato Brendim Medici
5 (1)
Gold doesn’t forgive a bad entry. It sweeps stops, tricks anyone reading the candle at face value, and reverses right when everyone’s convinced the trend is set. RBM Gold Liquidity Hunter shows you exactly where those traps happen, before you walk into one. The indicator maps yesterday’s high and low automatically and draws the Asian session range live on your chart, that window that usually decides where the day is headed once London and New York show up. When price breaks one of those levels
FREE
SMC Intraday
Renato Brendim Medici
SMC INTRADAY RBM Quick User Manual Smart Money Concepts | MetaTrader 5 1. Installation Open MetaTrader 5. Go to File → Open Data Folder. Navigate to MQL5 → Indicators and copy the indicator file into this folder. Open MetaEditor, compile the file, and return to MetaTrader 5. Refresh the Navigator, locate SMC Intraday RBM, and drag it onto the desired chart. 2. How to Interpret the Indicator BOS — Break of Structure: A break of a previous market structure that may indicate continuation of the cur
FREE
RBM Flow Structure PRO
Renato Brendim Medici
RBM Flow Structure PRO Advanced Capital Flow and Market Structure Analysis for MetaTrader 5 Five integrated modules. One tool. A more complete market view. RBM Flow Structure PRO is a multifunctional indicator designed for traders who want to gain a deeper understanding of market behavior. It combines capital flow analysis, price structure, supply and demand zones, and key trading levels on a single chart. With five independent and configurable modules, the indicator helps organize your analysis
FREE
RBM Smc
Renato Brendim Medici
RBM SMC Liquidity Hunter MT5 — Institutional Structure and Liquidity Indicator   The RBM SMC Liquidity Hunter is a professional tool developed to map Smart Money Concepts (SMC) dynamics directly on your charts. The indicator tracks market structure breaks, validates supply and demand zones using price displacement, and detects liquidity sweeps confirmed by volume, integrating all confluences into an executive on-chart dashboard.   Key Features  Market Structure Mapping (BOS / CHoCH): Automatic
FREE
RBM Delta Gold
Renato Brendim Medici
5 (1)
黄金市场的波动不仅仅来自价格本身,更来自买卖双方的主动进攻、市场失衡以及资金流向。Delta 指标正是为揭示这些核心变化而打造。 RBM Trader 的 XAUUSD Delta 指标能够识别主动买盘与主动卖盘之间的差异,帮助交易者在价格走势变得明显之前,提前发现真实的市场压力。 大多数交易者只关注K线,而 Delta 能够展示价格背后真正发生的资金行为。 该指标专为 XAUUSD 黄金市场开发,充分考虑了黄金在美盘、亚盘和欧盘期间的高波动特性与市场行为。 主要功能: * 主动买卖压力识别   * 市场动能衰竭检测   * 潜在反转确认   * 突破有效性验证   * 更精准的资金流与动量分析   * 简洁直观的界面   * 针对剥头皮、日内交易和短线交易优化   Delta 指标并不是随机发出交易信号,而是帮助交易者理解市场背景与真实资金力量,避免情绪化入场,并识别机构资金真正活跃的位置。 非常适合希望在黄金市场中获得更高精准度、更专业资金流分析以及更好入场时机的交易者。
FREE
RBM Volume Profile Master
Renato Brendim Medici
RBM VolumeProfileMaster Professional Volume Profile Analysis for MetaTrader 5. RBM VolumeProfileMaster was developed to analyze volume distribution across price levels, identify areas of trading concentration, and provide a clearer understanding of market acceptance and rejection zones. A comprehensive analytical tool combining Volume Profile, market structure, and volume flow analysis in a single interface. KEY FEATURES Volume Profile: Displays traded volume distribution across individual pric
FREE
RBM Trader Painel
Renato Brendim Medici
RBM Trade Panel - Automatic Lot Calculator and Order Management Fast execution panel for MetaTrader 5 featuring automatic dollar-based risk calculation, chart-based partial exits, one-click breakeven, and complete order management. Full Description Doing manual math or switching to external position calculators while price moves rapidly usually leads to missed entries or oversized positions. The RBM Trade Panel fixes this directly on your MetaTrader 5 chart by handling all risk calculations a
FREE
RBM OB Dashboard
Renato Brendim Medici
RBM OB Dashboard Short Description Market structure indicator featuring BOS, ChoCH, Pending Breaks, scored Order Blocks, FVG, liquidity sweeps, sessions, Volume Profile, and a draggable dashboard. Full Description The RBM OB Dashboard reads market structure and key price reaction zones directly on the chart. It combines BOS, ChoCH, Order Blocks, Fair Value Gaps (FVG), liquidity, sessions, Kill Zones, Volume Profile, and a compact dashboard for rapid analysis. Built for traders who rely on market
FREE
RBM Volume Ultimate
Renato Brendim Medici
RBM Volume Ultimate RBM Volume Ultimate is an indicator for MetaTrader 5 that combines buyer and seller financial volume, cumulative delta, daily VWAP and automatic detection of absorption and exhaustion in a single panel. The purpose of the indicator is to give traders a clearer view of buying and selling flow in real time. The histogram separates financial volume between buyers and sellers on a bar by bar basis, making it easier to identify moments when pressure shifts from one side of the ma
FREE
RBM Zoomscroll
Renato Brendim Medici
RBM Zoom Scroll Every trader knows the feeling. You are on the gold M5, you want to see how the whole day built up, and you start clicking zoom buttons or dragging the price scale around. By the time you are done, the move you wanted to look at is already gone. RBM Zoom Scroll fixes this the way it should have worked from day one: you spin the mouse wheel over the chart and the chart zooms. No buttons, no menus, no dragging. How it works Scroll: zooms the chart in and out horizontally, which mea
FREE
RBM Volume Real 2
Renato Brendim Medici
5 (2)
O RBM Volume Real foi desenvolvido para transformar volume em informação útil para tomada de decisão. Em vez de observar apenas a movimentação do preço, o indicador permite identificar quem está dominando o mercado em determinado momento: compradores ou vendedores. O primeiro dado apresentado é o volume de Compras, que representa a agressão dos participantes que aceitaram pagar o preço pedido para entrar no mercado. Já o volume de Vendas mostra a agressão daqueles que aceitaram vender ao preço
FREE
RBM Prior Cote
Renato Brendim Medici
The previous day's open, close, high and low are among the levels the market respects most. Gold, Nasdaq, forex, indices: price comes back to these points, tests them, rejects them or breaks through. RBM Prior Cote draws them for you automatically, so you stop marking lines by hand every morning. What it does • Plots the open, close, high and low of the previous daily candle • Shows the last several days of history (you choose how many), so you can see where price actually reacted • Adds a la
FREE
RBM Atr Pro
Renato Brendim Medici
RBM ATR PRO v1.10 Quem opera mercado volátil sabe como é ruim tomar stop por causa de uma violinada de pavio e ver o preço andar forte a favor logo depois. O RBM ATR PRO foi desenvolvido exatamente para resolver isso. Ele evolui o indicador clássico de volatilidade combinando a leitura do ATR com dois níveis independentes de suavização. A linha no gráfico fica limpa e objetiva: verde para estrutura de alta e vermelha quando o mercado vira para a baixa. Funciona perfeitamente para rastrear a ten
FREE
RBM Volume Real Pro
Renato Brendim Medici
RBM Volume Real PRO 3.0 RBM Volume Real PRO 3.0 was developed to transform volume data into actionable market intelligence. While most traders focus exclusively on price movement, this indicator allows users to identify the participants truly driving the market by revealing the balance of power between buyers and sellers in real time. The first component is Buy Volume, which represents the aggression of participants willing to execute orders at the asking price. Conversely, Sell Volume measur
FREE
RBM Watermarkgrid
Renato Brendim Medici
RBM Watermark Grid - MQL5 Market Description RBM Watermark Grid A transparent symbol watermark plus a clean, wide-spaced grid for your MetaTrader 5 charts. Overview RBM Watermark Grid gives your chart a cleaner, more professional look. It shows the symbol name (and optionally the symbol description and timeframe) as a subtle watermark in the center of the chart, and replaces the default MT5 grid with a softer, more open grid that has fewer lines and does not clutter your candles. Key features Sy
FREE
RBM PivotZones
Renato Brendim Medici
RBM Pivot Zones automatically detects pivot highs and lows directly on the chart, marking each level with a horizontal line and a subtle visual zone. The logic is straightforward: the indicator scans price history looking for structural tops and bottoms, the areas where price arrived, rejected, and reversed. Pivot highs in blue, pivot lows in red. Clean chart, no clutter. The indicator adjusts to any timeframe automatically. It works the same way on M5, H1, or D1 without reconfiguration. Sensiti
FREE
RBM Stop and Take Label
Renato Brendim Medici
5 (1)
Here is the English version of the product description, tailored to sound clear, professional, and engaging for the MQL5 Market: RBM SL TP Label — Indicator for MetaTrader 5 If you trade Forex and miss seeing the exact financial value of your risk and target directly on your chart, this indicator solves that in a clean, direct, and intuitive way. What It Does As soon as you open a position, the indicator automatically detects your Stop Loss and Take Profit lines and displays, in real-time, both
FREE
RBM Atr Pro 01
Renato Brendim Medici
RBM ATR PRO v1.20 Intelligent Volatility Analysis & Dynamic Trailing Stop RBM ATR PRO is a professional trading indicator designed to analyze market volatility, monitor price direction, and assist traders with position management through a dynamic trailing stop reference. Based on the Average True Range (ATR) methodology, the indicator measures market price fluctuations and provides a dynamic visual reference to help traders understand changes in volatility and market conditions. MAIN FEATURES D
FREE
RBM Nasdaq Liquidity Hunter Institutional Liquidity Indicator for Nasdaq RBM Nasdaq Liquidity Hunter is an advanced liquidity analysis tool developed for Nasdaq traders who want to identify institutional liquidity events with greater precision. Instead of highlighting every breakout, the indicator filters market noise and identifies only liquidity sweeps confirmed by volume, trend, and multiple institutional confluence factors. Every detected event is evaluated through a proprietary scoring
FREE
RBM Calendario Pro
Renato Brendim Medici
RBM | CALENDAR PRO MACROECONOMIC INTELLIGENCE DIRECTLY INSIDE METATRADER 5 Developed by RBM.TRADER RBM | CALENDAR PRO is an advanced economic calendar dashboard designed for traders who want to monitor major global macroeconomic events directly inside MetaTrader 5. More than just an economic agenda, this tool organizes essential economic information, allowing you to track upcoming releases, compare market expectations and identify economic surprises that may influence financial markets. KEY FEAT
FREE
SMC Intraday RBM
Renato Brendim Medici
SMC INTRADAY RBM R2 PRO Understand market structure. Identify liquidity. Evaluate confluences before making a trading decision. The SMC Intraday RBM R2 PRO is a professional trading indicator designed for traders seeking a comprehensive understanding of market structure. It combines Smart Money Concepts, liquidity analysis, relative volume, VWAP and multi-timeframe trend confirmation. Rather than identifying isolated patterns, the indicator organizes multiple market conditions into an integrate
FREE
RBM EA Pro Gold
Renato Brendim Medici
RBM EA PRO — the most complete Expert Advisor you’ll find for XAUUSD Gold doesn’t behave like any other asset. It reacts to US interest rates, dollar strength, breaking news, and it loves to sweep stops before making its real move. RBM EA PRO was built specifically to handle that complexity, with no shortcuts and no impulsive entries. How it decides to enter This isn’t a robot that buys or sells at random. RBM EA PRO only considers an entry when multiple layers of analysis agree with each ot
RBM EA Deluxe
Renato Brendim Medici
An XAUUSD-focused robot that only enters when several market conditions line up at once: trend, volume, price structure and session. It shows you exactly what it’s analyzing on the chart, and why it decided to trade or wait. Most gold robots you’ll find out there run on something simple: a moving average cross, or a channel breakout, and that’s it. The problem is gold doesn’t trade that way. It sweeps liquidity, traps early entries, and usually only moves for real after shaking everyone out fir
RBM QuickEntryPanel PRO
Renato Brendim Medici
RBM QUICK ENTRY PRO PANEL LEGEND Trade execution, risk management and operational control for MetaTrader 5 PRODUCT OVERVIEW The RBM Quick Entry PRO | Panel Legend is a professional trade execution and position management panel developed for MetaTrader 5. It combines order entry, risk control, position management and performance monitoring in a compact interface integrated into the chart. MAIN FEATURES 01 | TRADE EXECUTION Market orders: BUY and SELL. Pending orders: BUY LIMIT and SELL LIMIT. St
RBM Heatmap Pro
Renato Brendim Medici
RBM Heatmap PRO 2.08 Visualize market strength across multiple asset classes in a single dashboard. RBM Heatmap PRO is an indicator developed for MetaTrader 5 that brings multiple asset classes together in a visual dashboard, allowing traders to monitor percentage changes, prices, and relative market movements in a clear and organized way. Featuring a professional interface, dynamic asset management, and bilingual support, the indicator is designed for traders who need to monitor different marke
筛选:
无评论
回复评论