ICT Projection
- 指标
- 版本: 1.10

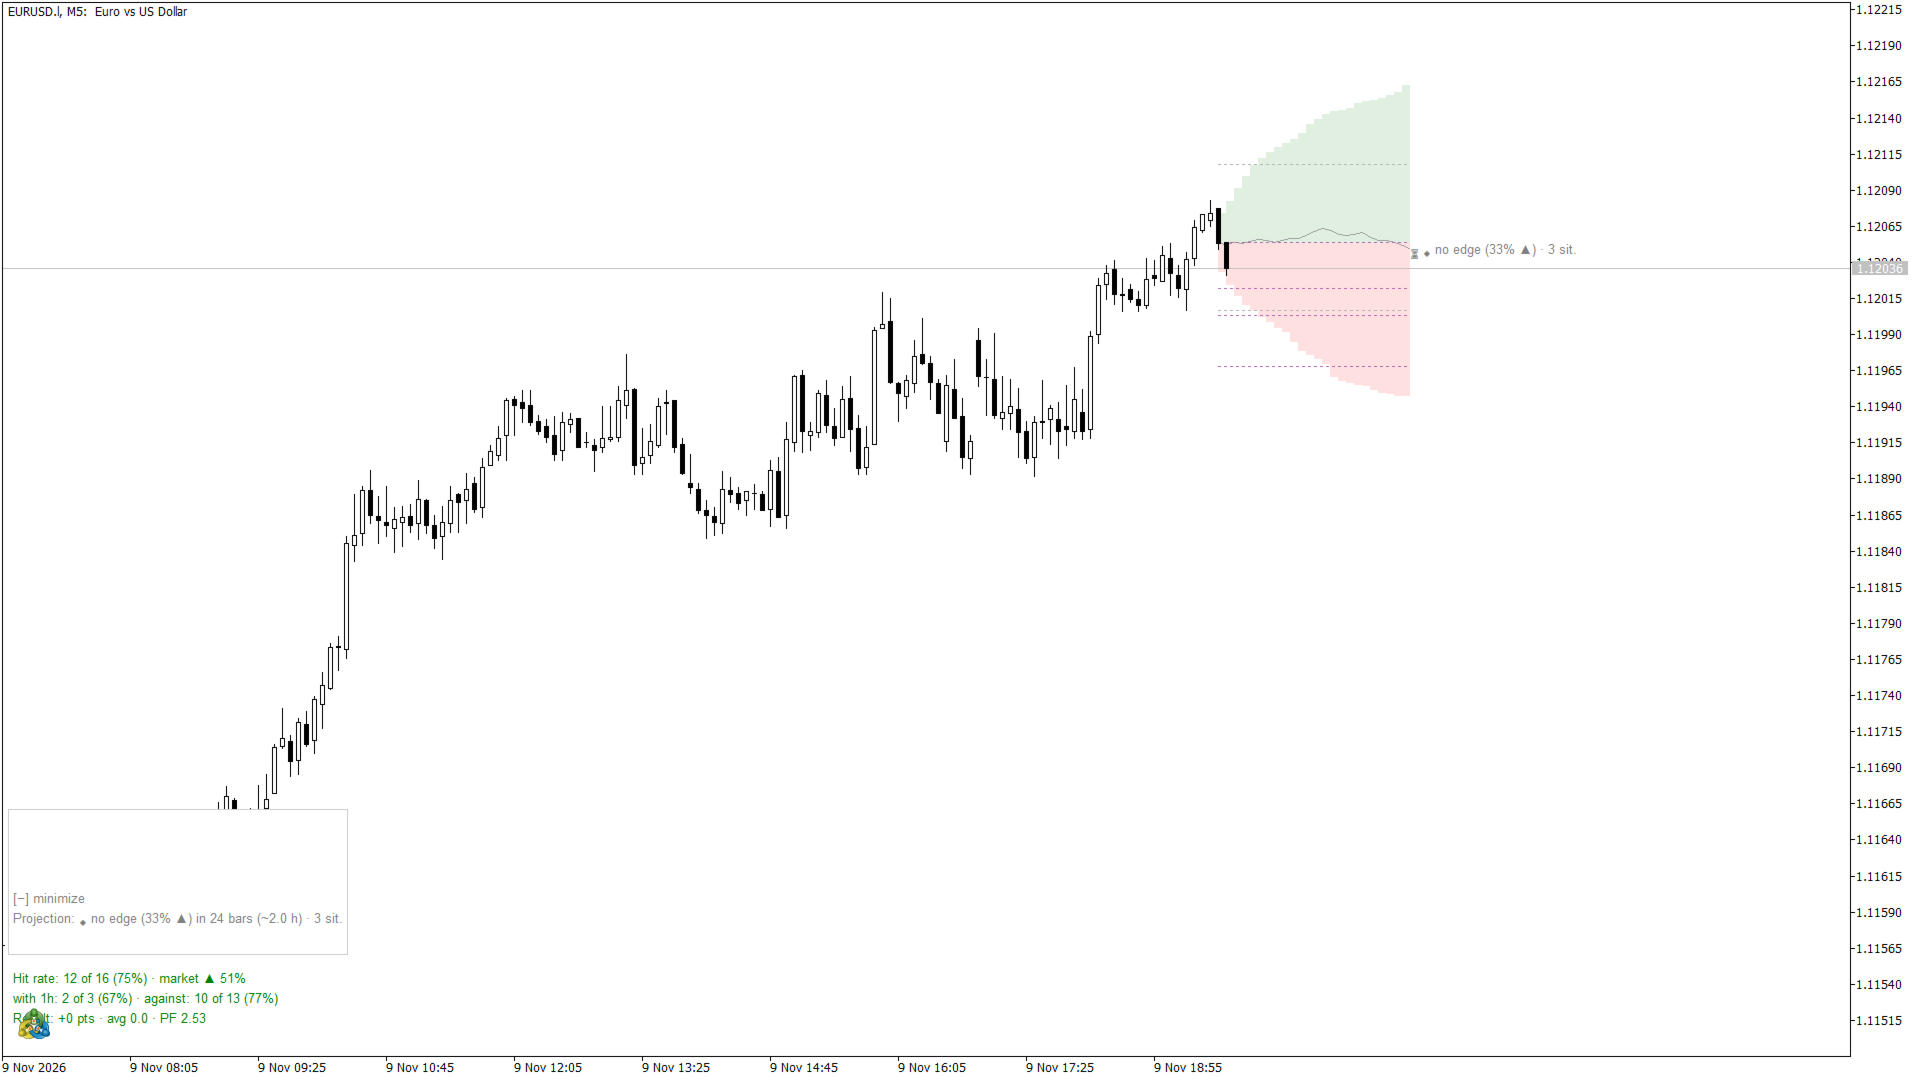
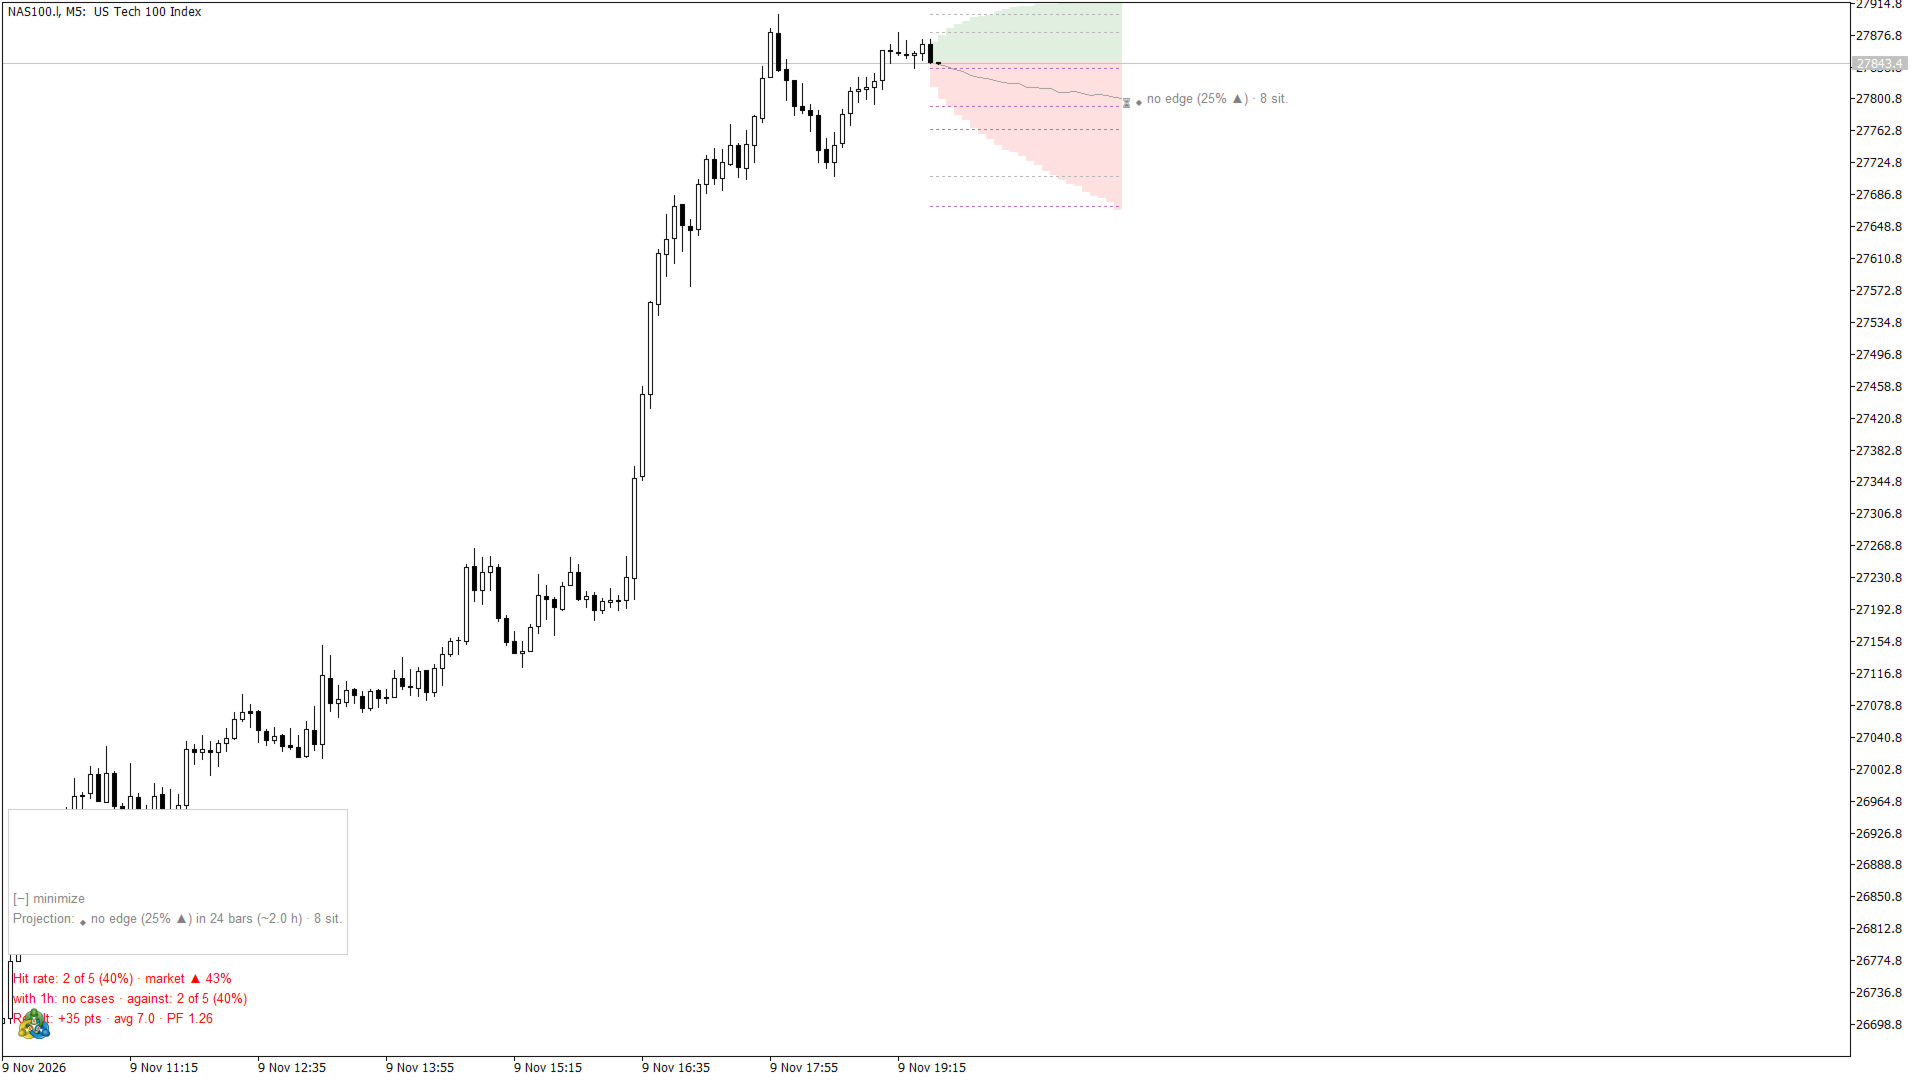
ICT Projection answers one question: "the last times the chart looked like this, where did price go next?" It searches the history of your chart for bars with the same ICT snapshot as now and draws the path price took after them, in ATR units, as a shaded area to the right of the last candle. It is a statistics tool: it shows what usually happened and how often, and it says so plainly when there is no edge.
What it measures
- The ICT snapshot of every bar, from 14 features: market structure, recent break (BOS/MSS/CHoCH), higher-timeframe bias, premium/discount, liquidity sweep, fresh FVG, displacement, side of the midnight open, previous day high/low, day range, nearest liquidity, volume, bar range and the New York session time.
- Similar situations: past bars that match at least 11 of the 14 features (adjustable), kept apart by one horizon so the same move is not counted twice.
- The base rate: how often price went up after all bars at the same time of day. A side is only shown when the similar situations beat this base rate with 95% confidence (Wilson lower bound). Otherwise the projection says "no edge".
What it draws
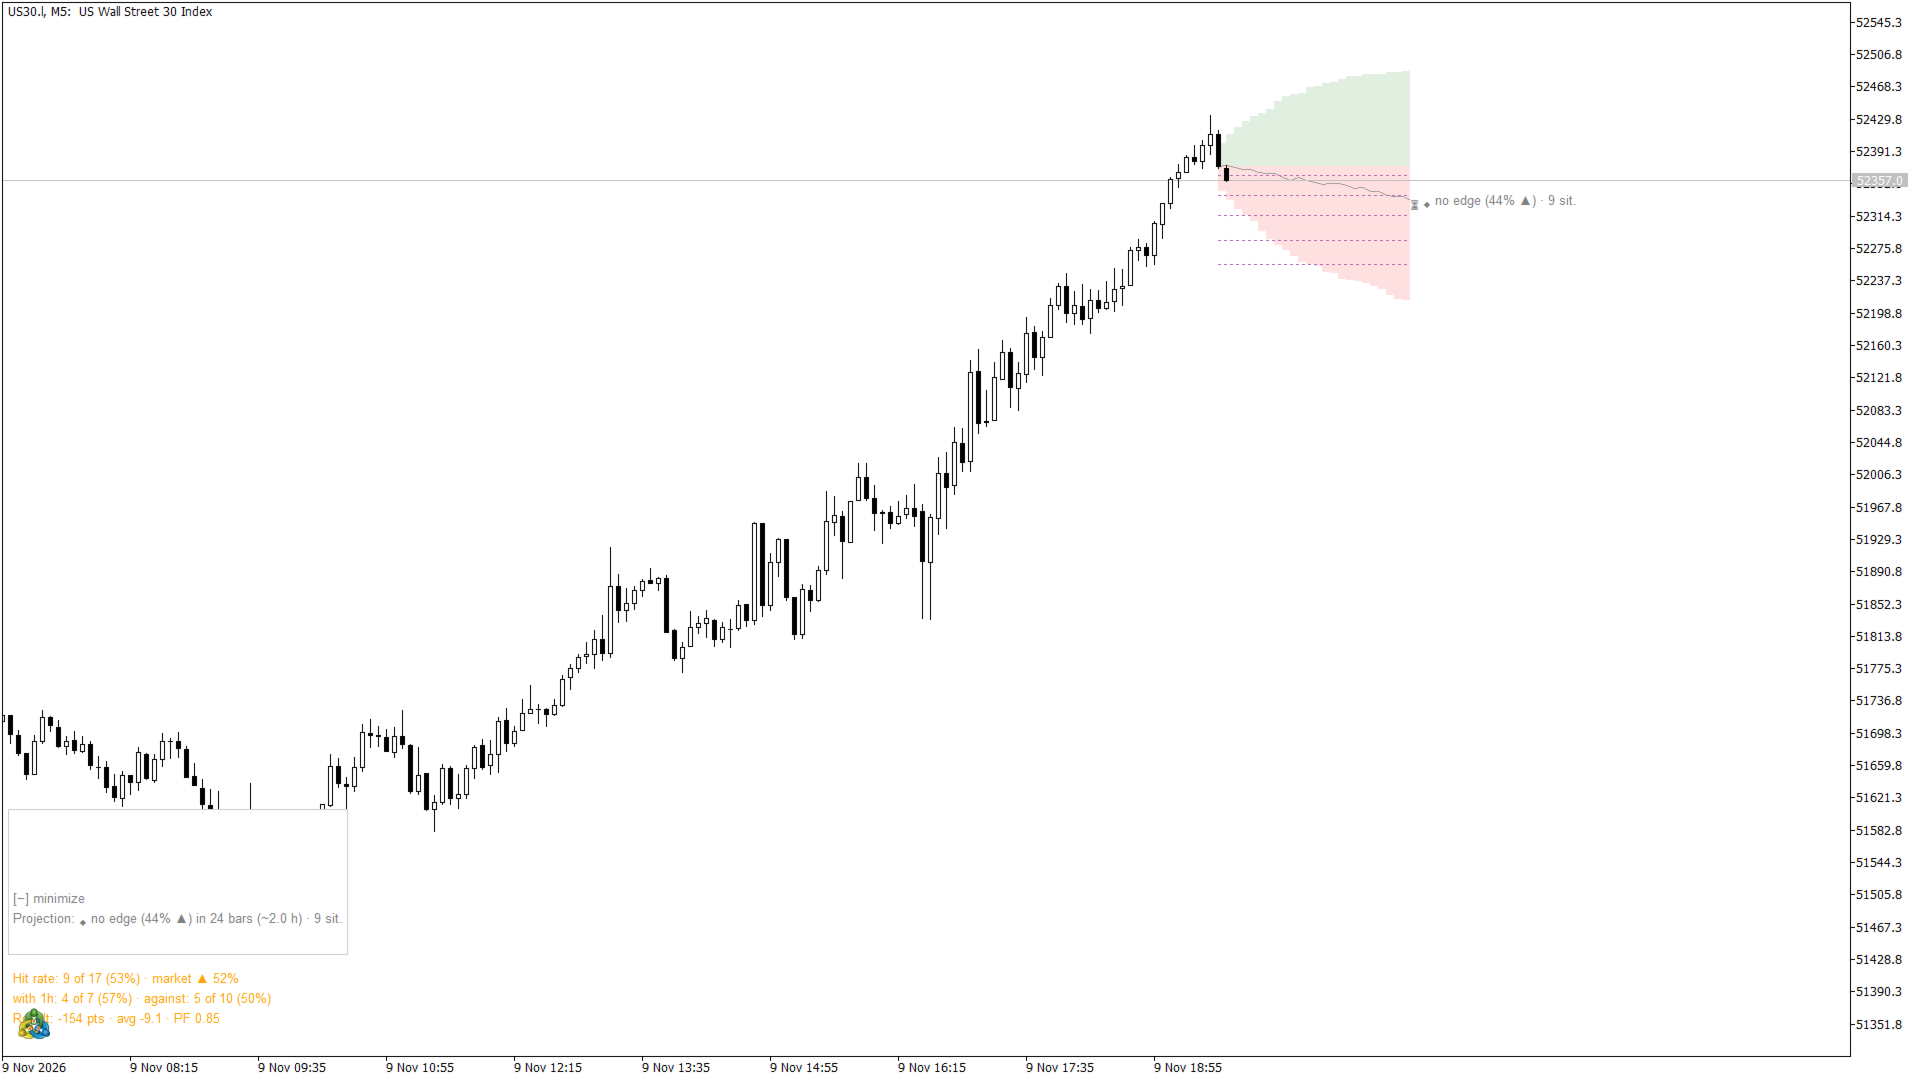
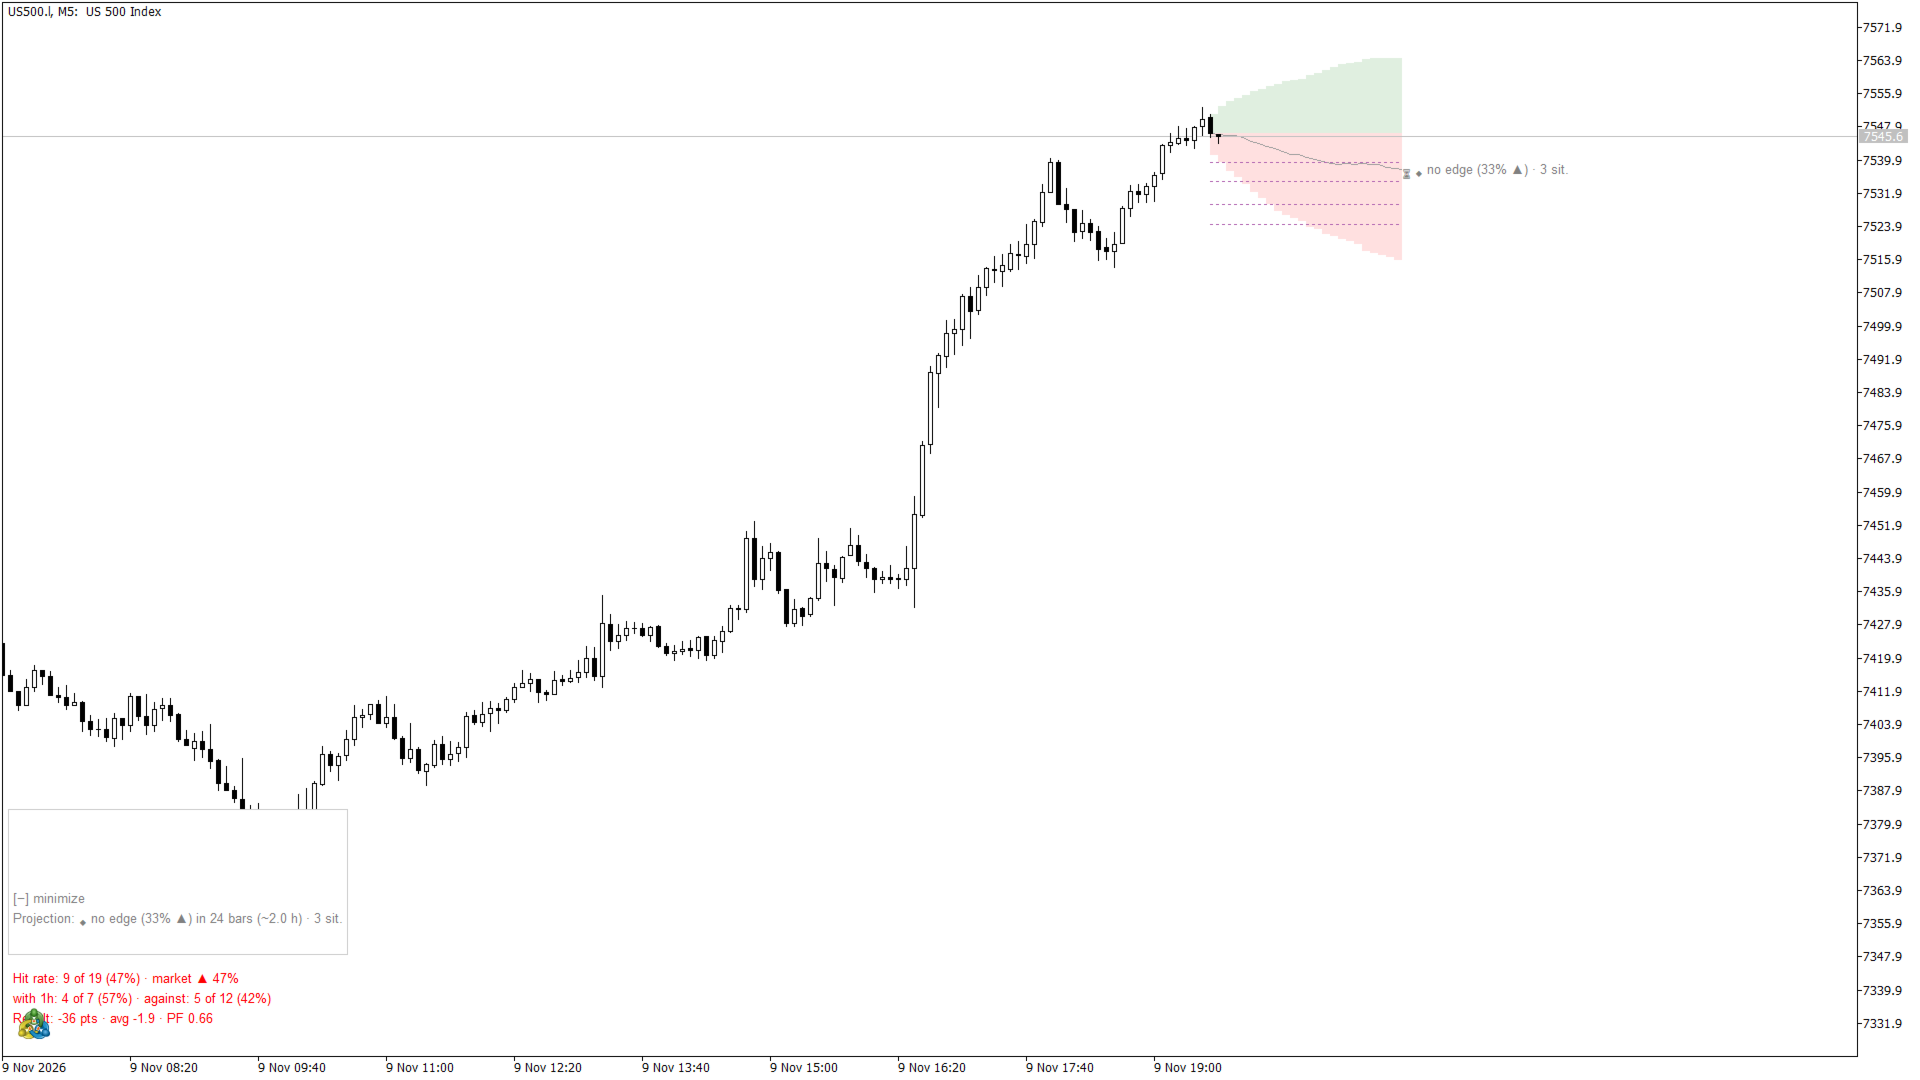
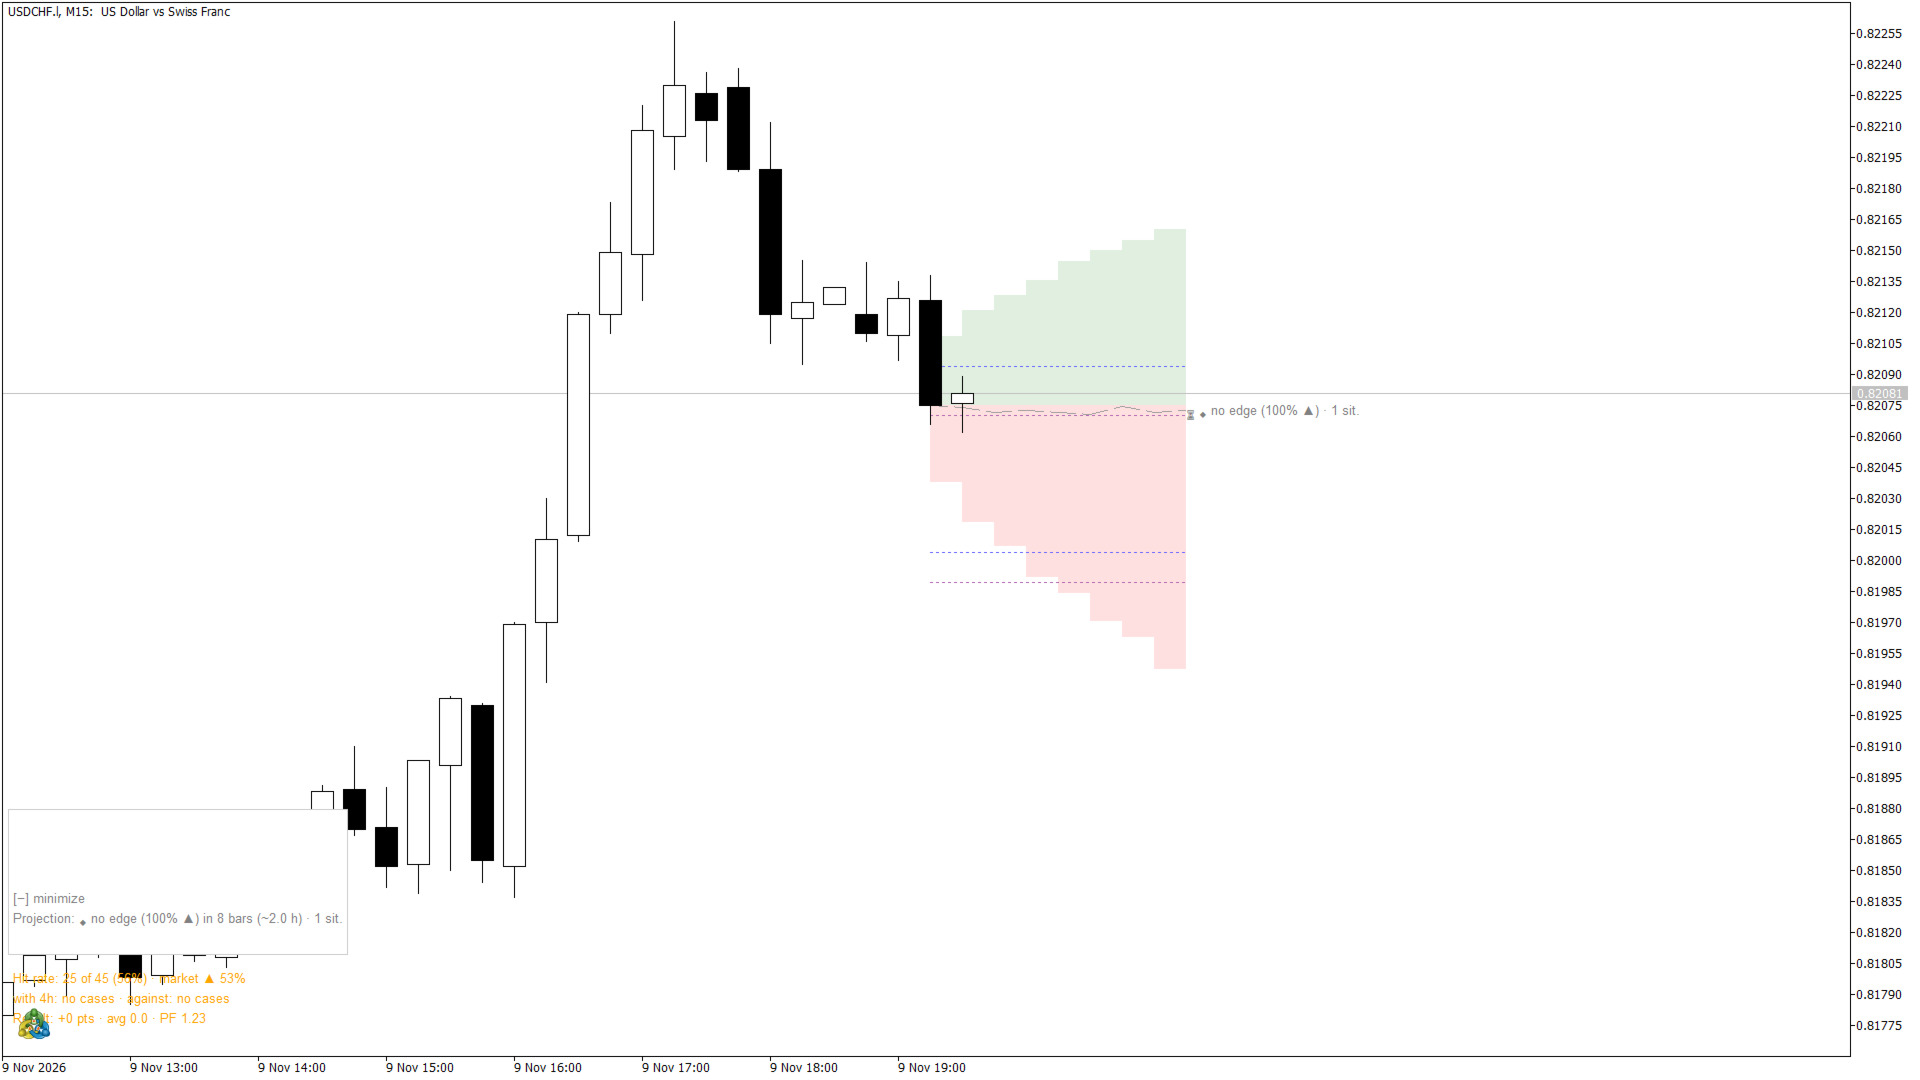
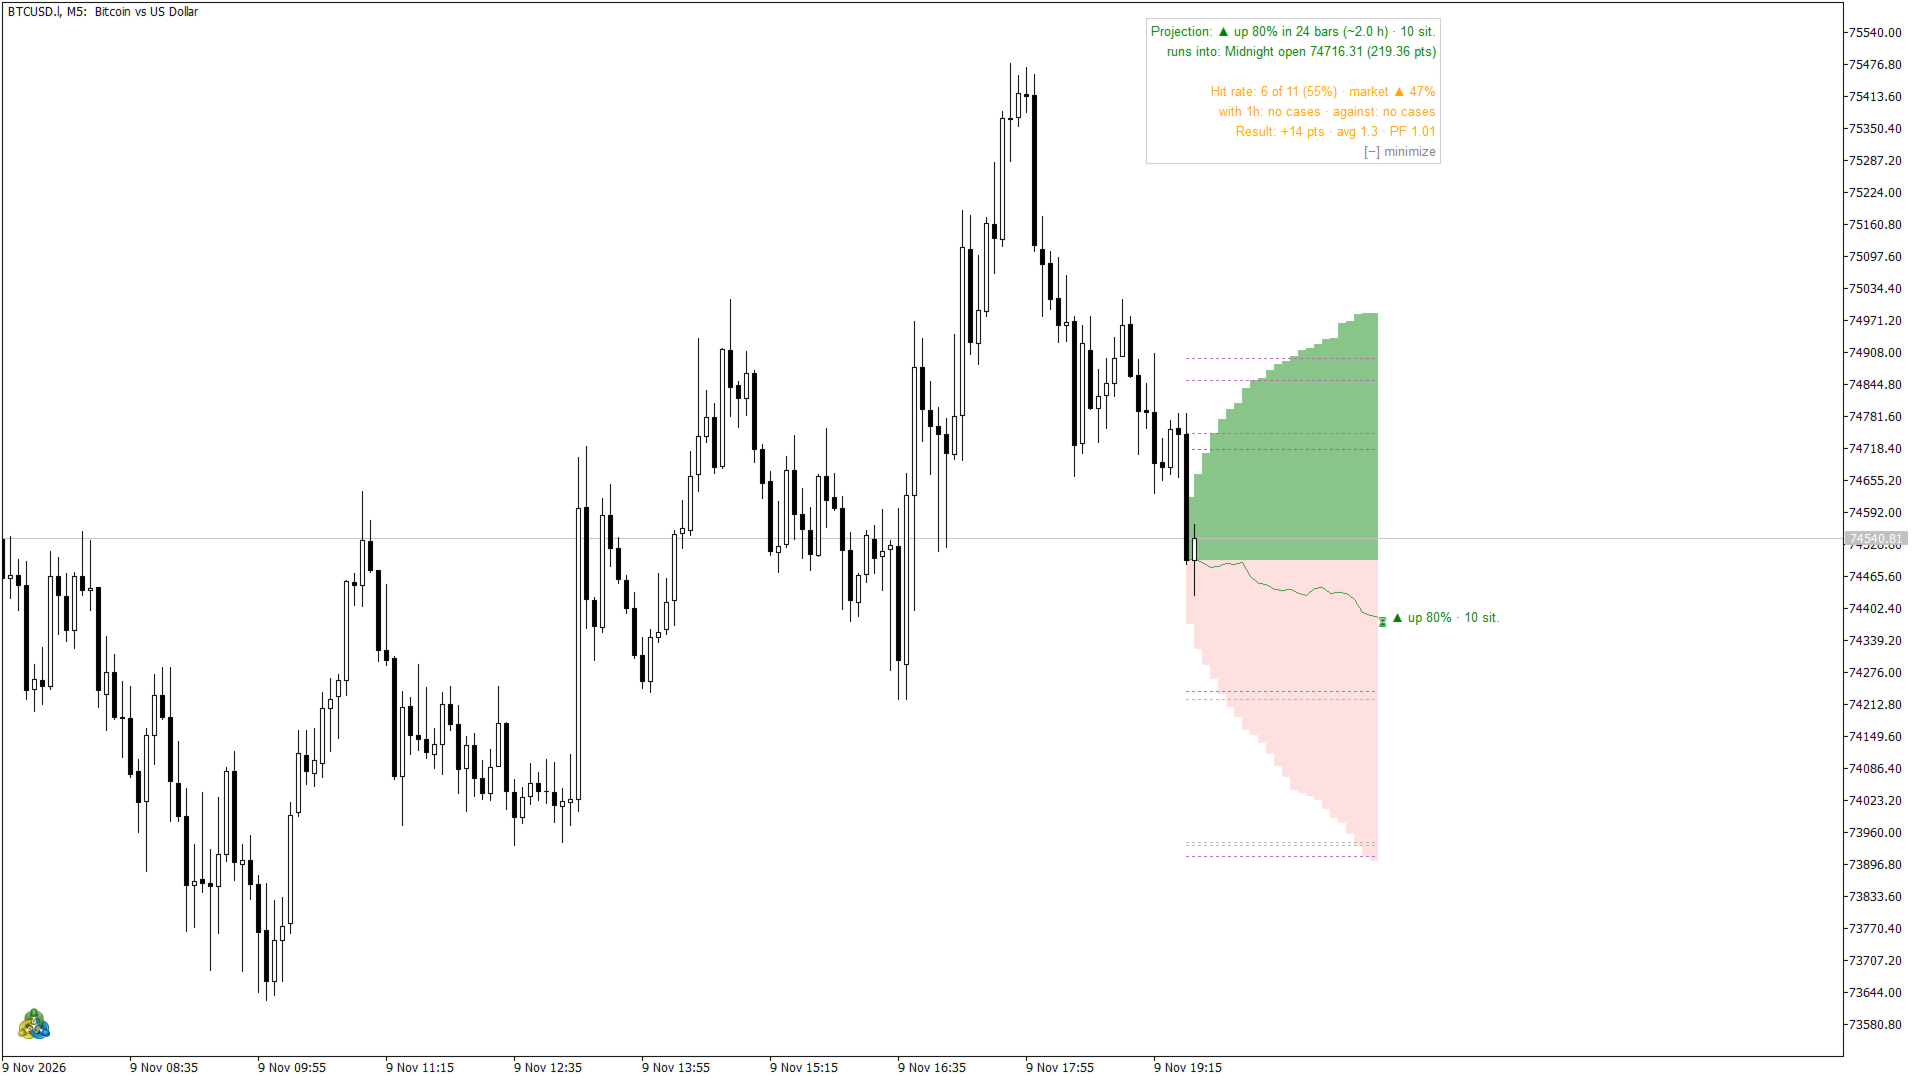
- A green/red area: the 20th to 80th percentile of the highs and lows reached by price after the bars at the same time of day (up to 1,000 of the most recent), drawn bar by bar up to the horizon.
- A dashed median line of the close along the path.
- ICT levels inside the area as dotted lines: previous day and previous week high/low, midnight open, unswept swing highs and lows and the CE (50%) of recent FVGs. The first level in the projected direction is reported as the obstacle ("runs into").
- A label at the end of the area with the side, the percentage and the number of situations.
The box
- Side and percentage, horizon in bars and time, number of situations.
- Context: pullback against the higher-timeframe bias, or move with it.
- Hit rate on history: every past projection with a side is tested on the bars that followed and compared with the market on the same points ("market ▲ 52%"). Also the last 20 tests, the hit rate with and against the bias, and the result in points (enter at the close, exit after the horizon, no costs) with the profit factor.
- Base rate line: bars at the same time of day, how often they went up, and how many features matched.
- The box can be minimized with the button in its title; the lines on the chart stay.
Session-aware
- The path never crosses the daily close (17:00 New York) or the weekend, so overnight gaps and contract rolls do not distort the area or the tests.
- Near the close, the horizon shortens to the bars left in the session. With fewer than 5 bars left, the box says the projection returns at the next open.
- Crypto (which trades on weekends) and charts from H4 up are not cut by session.
- New York time is detected from the server history (European DST, US DST or fixed GMT servers). A manual offset is available if your broker uses something else.
Key settings
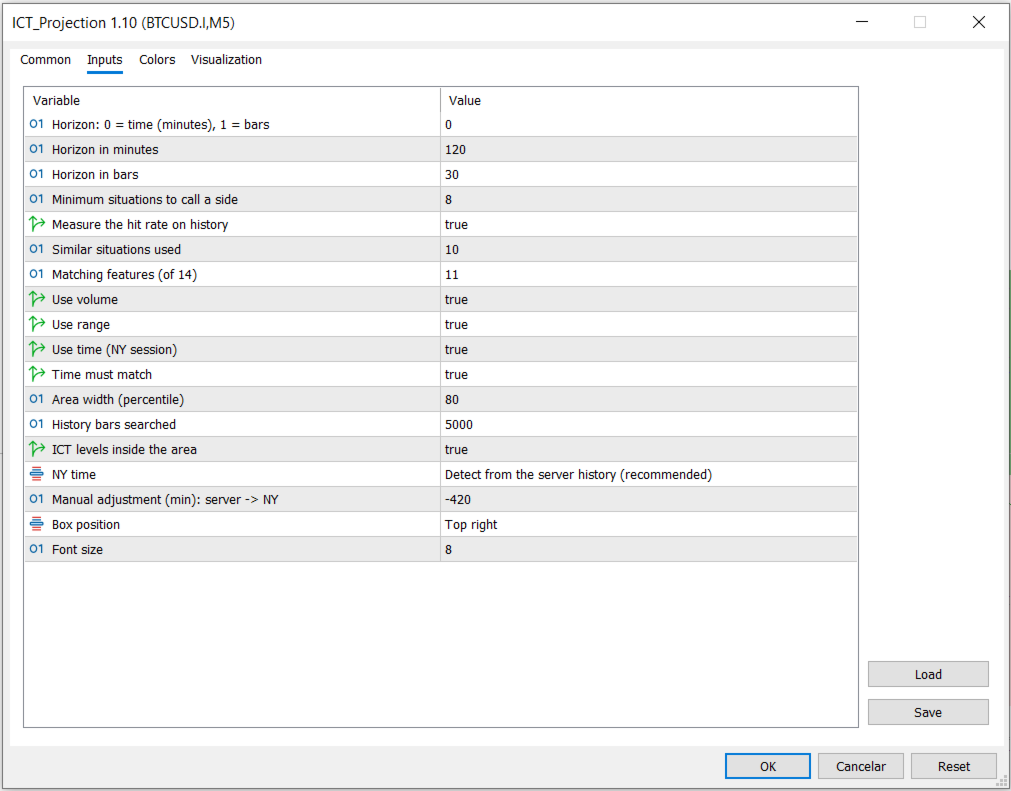
- Horizon in minutes (default 120) or in bars (default 30).
- Matching features (of 14), similar situations used, minimum situations to show a side.
- Volume, bar range and session time as features on or off; require the same time of day.
- Area width (percentile), history bars searched (default 5,000) and the ICT levels inside the area.
- New York time mode, box corner and font size.
Typical use
- Before an entry, check whether the projection agrees with your idea. "No edge" is useful information: the current situation has not behaved differently from any other bar at this hour.
- Use the area and the obstacle to judge room to target: if the first level in your direction sits close, the move may stall there.
- Watch the hit rate versus the market: when it is not clearly above the market's own up/down rate, treat the side as noise on this symbol and timeframe.
Who it is for
- Traders who use ICT concepts and want a data check on their read of the chart.
- Forex, indices, metals and crypto, on intraday timeframes (M5 to H1 work best).
Limitations
- This is a statistics tool, not a signal. It does not open trades and does not guarantee results. Past behavior does not predict the future.
- On most symbols the measured hit rate is close to the market's own rate; a side appears only when the history supports it.
- The hit rate and the result in points are measured on the history loaded on your chart, without costs or slippage. They are not results of real trading.
- The more history the chart has, the more situations are found. The first calculation on 5,000 bars can take a few seconds.
- ICT concepts are based on public educational content. This indicator is not affiliated with or endorsed by Inner Circle Trader.