Trend Pullback RSI
- 专家
- 版本: 1.0
- 激活: 10

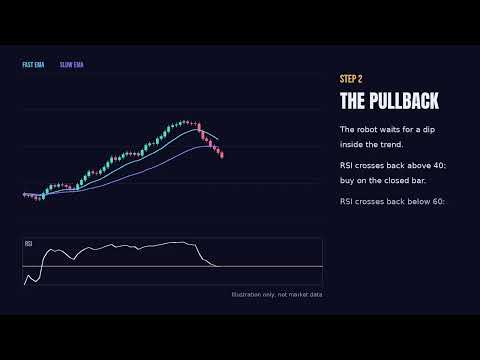
Trend Pullback RSI is an Expert Advisor for MetaTrader 5. It waits for a trend, then enters when the price pulls back and the RSI turns in the direction of that trend. It uses three standard indicators: EMA, RSI and ATR.
How it works
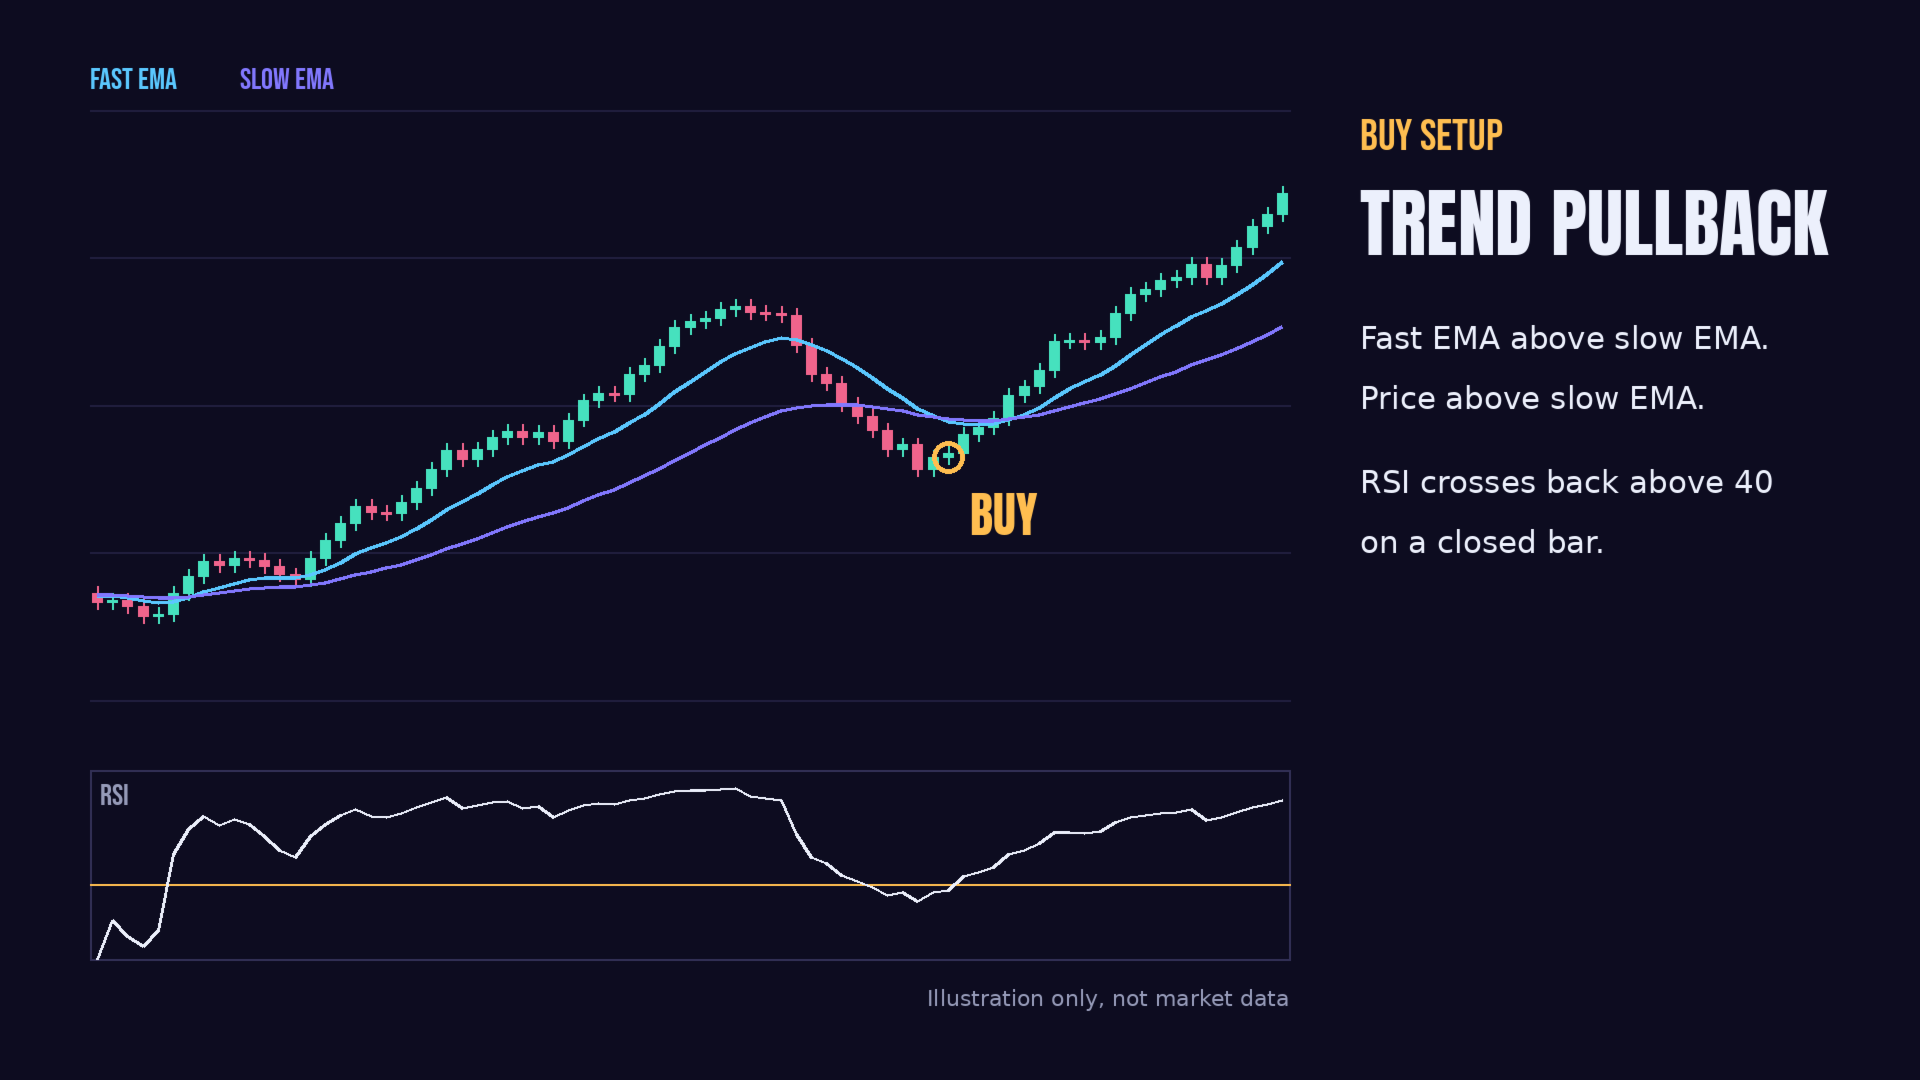
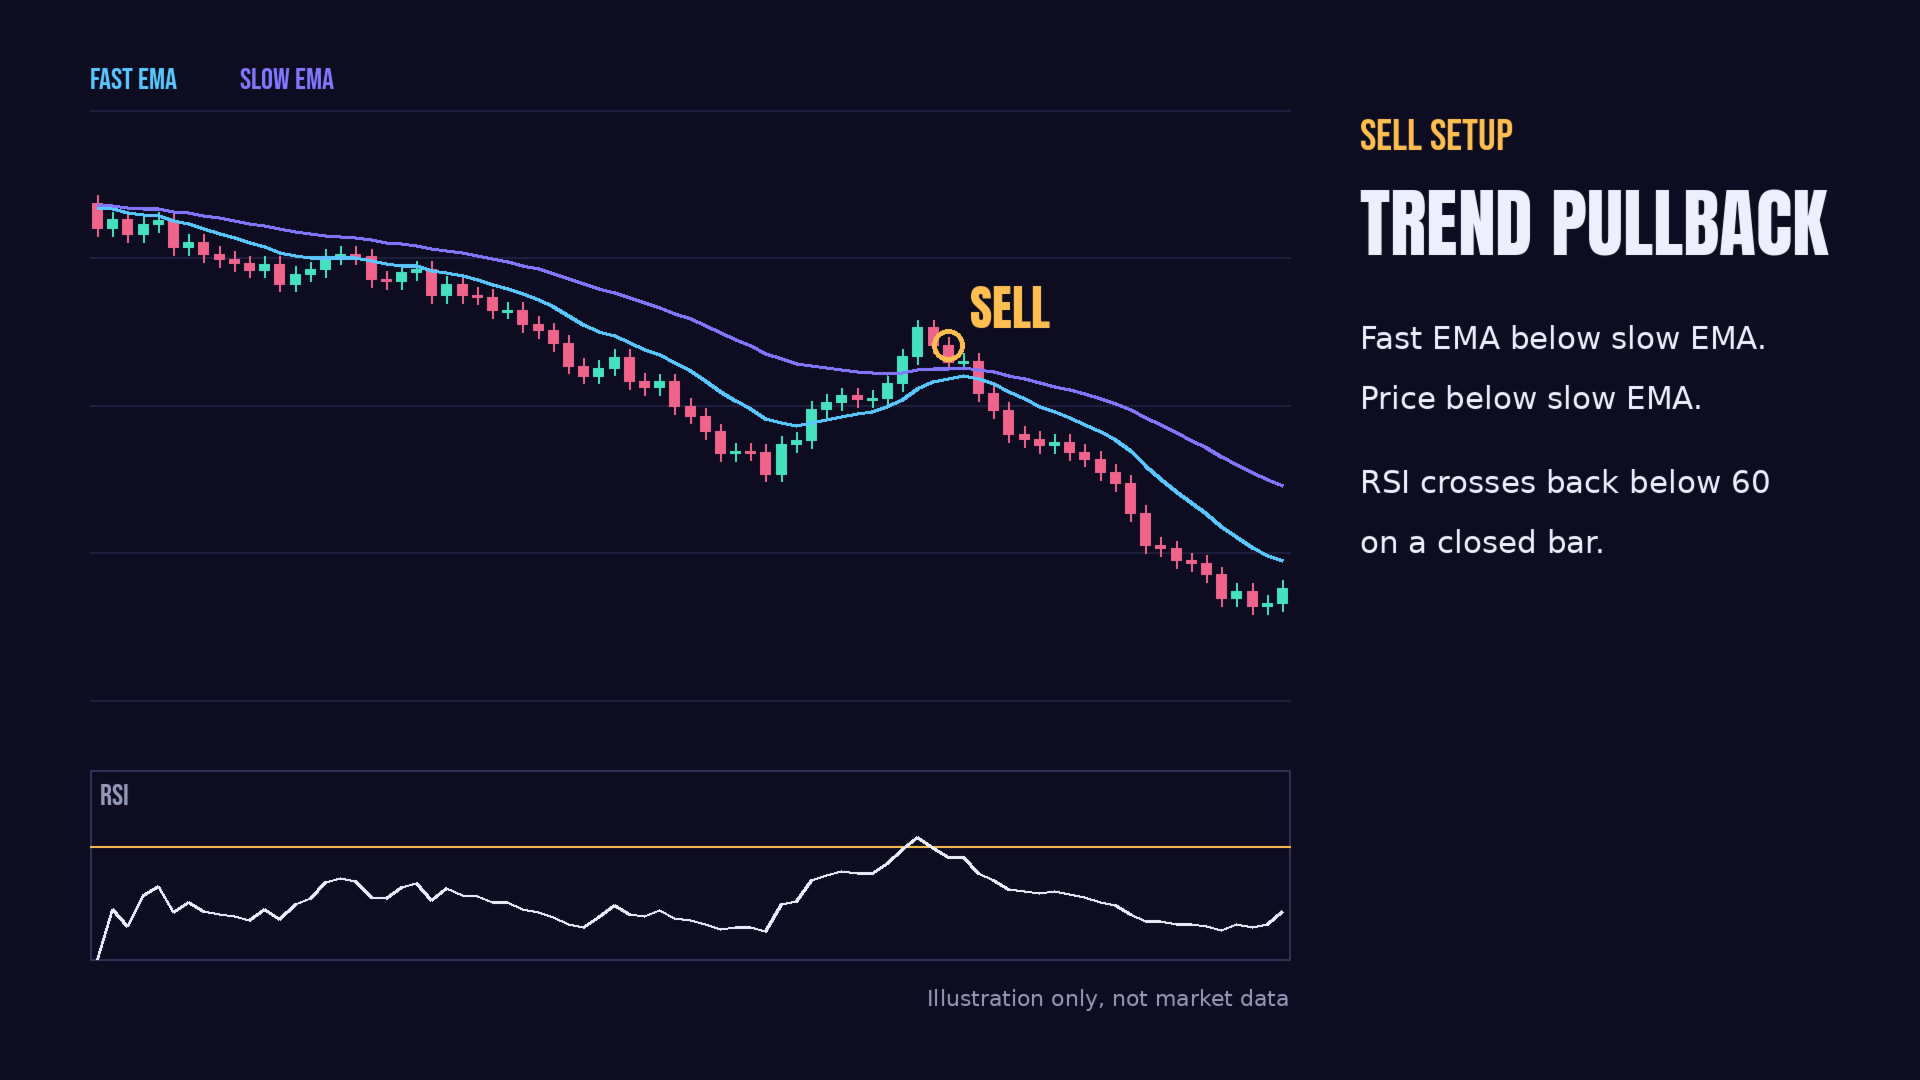
A buy signal needs the fast EMA above the slow EMA, the last closed price above the slow EMA, and the RSI crossing back above its buy level. A sell signal uses the opposite conditions with the RSI crossing back below its sell level.
Signals are read on closed bars only, so an entry does not depend on a bar that is still forming. The Expert Advisor holds one position at a time.
Exits
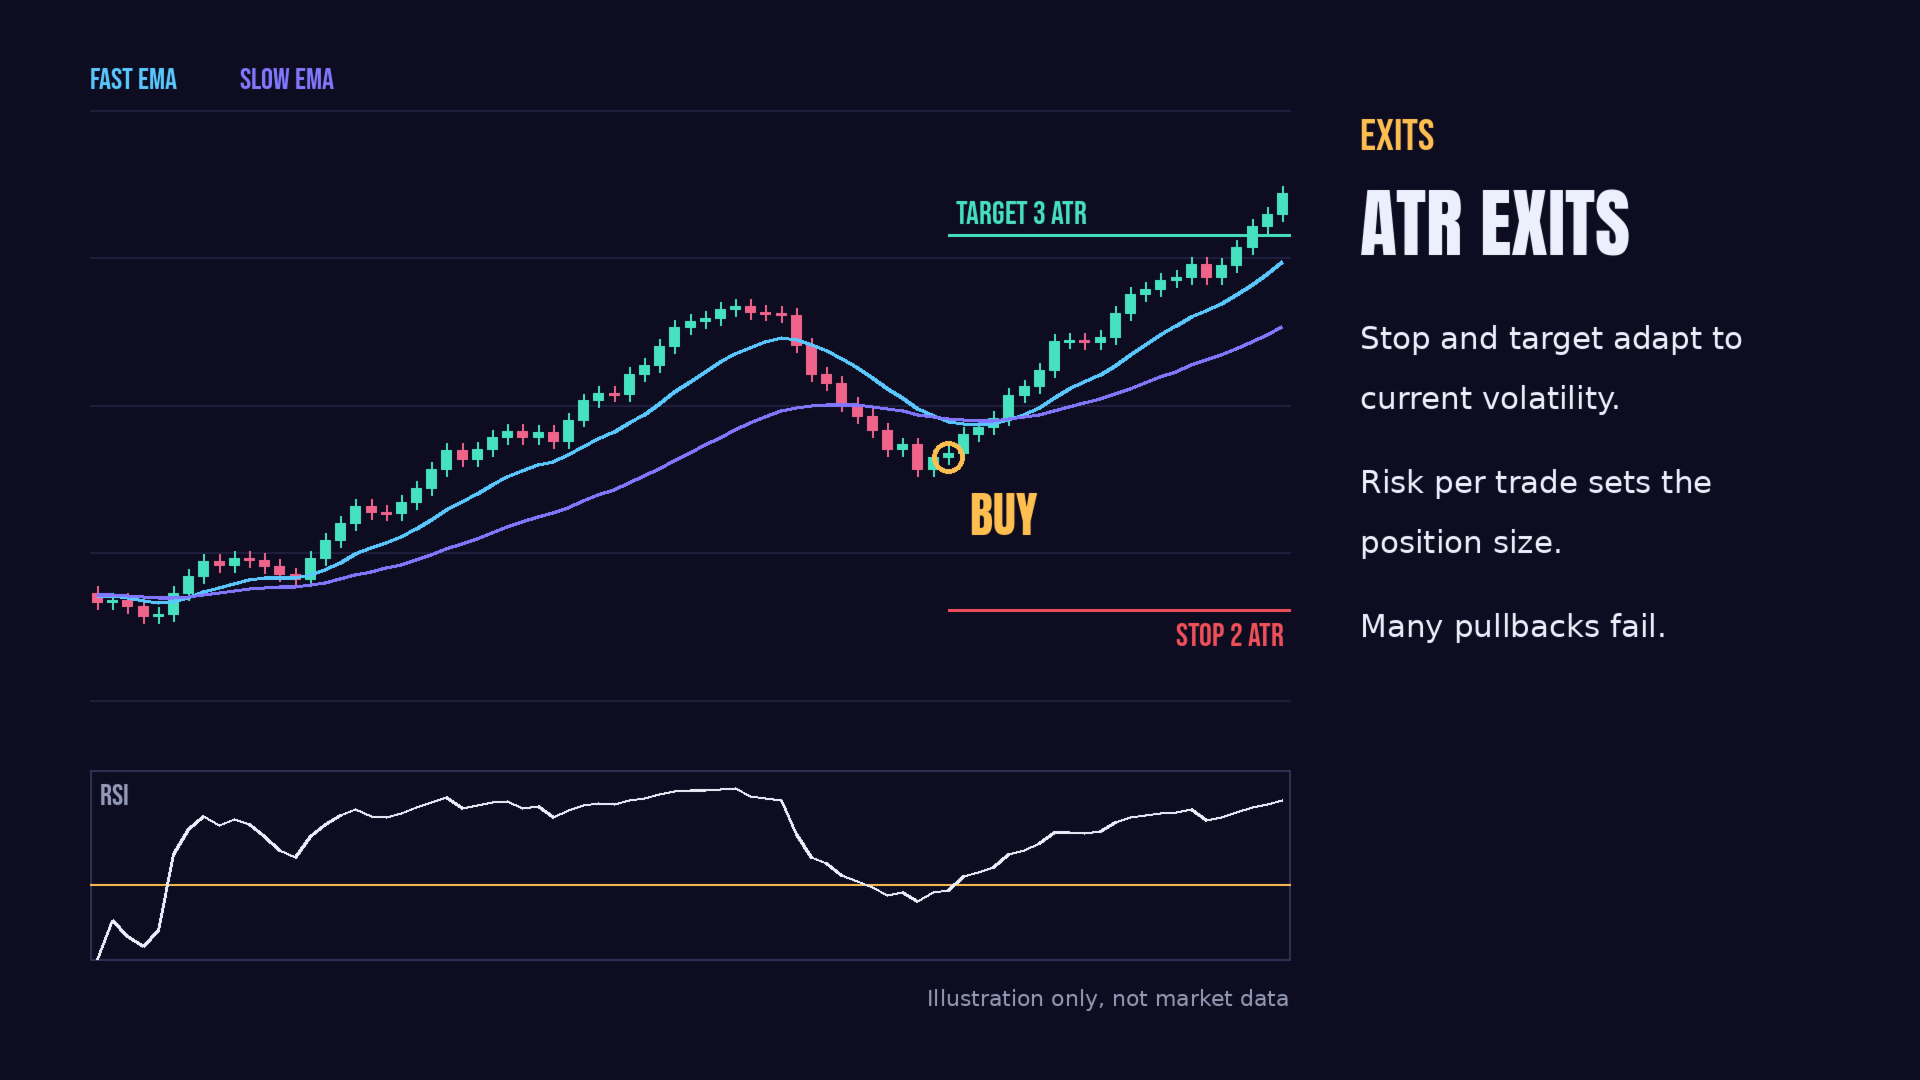
Stop loss and take profit are based on the ATR, so they adapt to current volatility. The default values are 2 ATR for the stop loss and 3 ATR for the take profit. An optional break-even rule moves the stop loss to the entry price after a gain of 1.5 ATR.
Risk control
Position size is calculated from the distance to the stop loss and the risk percentage set by the user. The default risk is 1 percent of equity per trade. If the calculated size is below the minimum lot, the trade uses the minimum lot only when its risk stays within a limit set by the user. Otherwise the trade is skipped.
The Expert Advisor does not use martingale, grid or averaging.
Main settings
Trend: fast and slow EMA periods.
Pullback: RSI period, buy level and sell level.
Exits: ATR period, stop loss, take profit and break-even multiples.
Risk: risk per trade, use of the minimum lot, and the maximum risk allowed for the minimum lot.
Execution: maximum spread, magic number and maximum deviation.
Setup
1. Attach the Expert Advisor to a chart. The default settings were prepared for EURUSD on H1.
2. Enable Algo Trading in MetaTrader 5.
3. Start on a demo account and compare the results with your own Strategy Tester report.
Limits
Pullback entries can lose during sideways markets and sudden reversals. Losing periods are normal. Results depend on the broker, spread, commission and slippage. A backtest shows one past price history only. It is not a real trading result and does not predict future results. Trading involves a risk of loss.