Quant Probability Risk Neutral Density Scan Pair
- 指标
- 版本: 9.51
- 激活: 5

════════════════════════════════════════════════════════════════════
QUANTEDGE PROBABILITY MAP PRO MT5 - Quant Probability Risk Neutral Density Scan Pair
════════════════════════════════════════════════════════════════════
Institutional Risk-Neutral Density, ATM Greeks, Multi-Pair Matrix Scanner & Predictive Trajectory
Professional Quantitative Engine for MetaTrader 5 • Copyrights by FAZA A N - 2026
════════════════════════════════════════════════════════════════════
PRODUCT SPECIFICATION & TECHNICAL OVERVIEW
════════════════════════════════════════════════════════════════════
❖ Product Name: QuantEdge Probability Map Pro
❖ Platform: MetaTrader 5 (MT5 Desktop Terminal)
❖ Product Category: Quantitative Indicators / Volatility & Probability / Scanners
❖ Architecture Version: 9.51 Professional Enterprise Edition
❖ Chart Compatibility: All Candlestick, Bar, and Line Chart Interfaces
❖ Asset Class Universality: Spot Forex, Gold & Metals, Cryptocurrencies, Major Stock Indices
❖ Default Supported Pairs: EURUSD, GBPUSD, USDJPY, XAUUSD (Customizable Watchlist)
❖ Timeframe Spectrum: All Native MT5 Timeframes (M1, M5, M15, M30, H1, H4, D1, W1, MN1)
❖ Graphics Pipeline: Hardware-Accelerated CCanvas Dynamic Alpha-Blending Memory Engine
❖ Repainting Policy: 100% Strictly Non-Repainting Mathematical Numerical Formulation
❖ External DLL Dependency: Zero (100% Native, Clean, Sandbox-Compliant MQL5 Codebase)
════════════════════════════════════════════════════════════════════
EXECUTIVE SUMMARY: THE INSTITUTIONAL EDGE
════════════════════════════════════════════════════════════════════
In modern algorithmic markets, retail technical indicators are fundamentally flawed. Lagging tools like RSI, Moving Averages, MACD, and Bollinger Bands rely strictly on past closing prices. They simply reflect historical action, offering zero insight into where institutional capital, hedging flows, and options market makers are pricing future probability.
Tier-1 investment banks, hedge funds, and market makers navigate the market by evaluating continuous probability distributions derived from option premiums. The pricing across options strike chains establishes an empirical, forward-looking probability map of where the underlying asset can realistically travel over time.
QuantEdge Probability Map Pro bridges this gap for MetaTrader 5 traders, deploying institutional quantitative derivatives modeling directly to your chart:
➔ Empirical Risk-Neutral Density: Extracts the market probability density function (RND) using the Nobel Prize-caliber Breeden-Litzenberger theorem.
➔ Institutional Price Magnets: Identifies Max Pain, Mode (Peak Density), and Expected Mean levels where dealer delta-hedging pulls price before expiration.
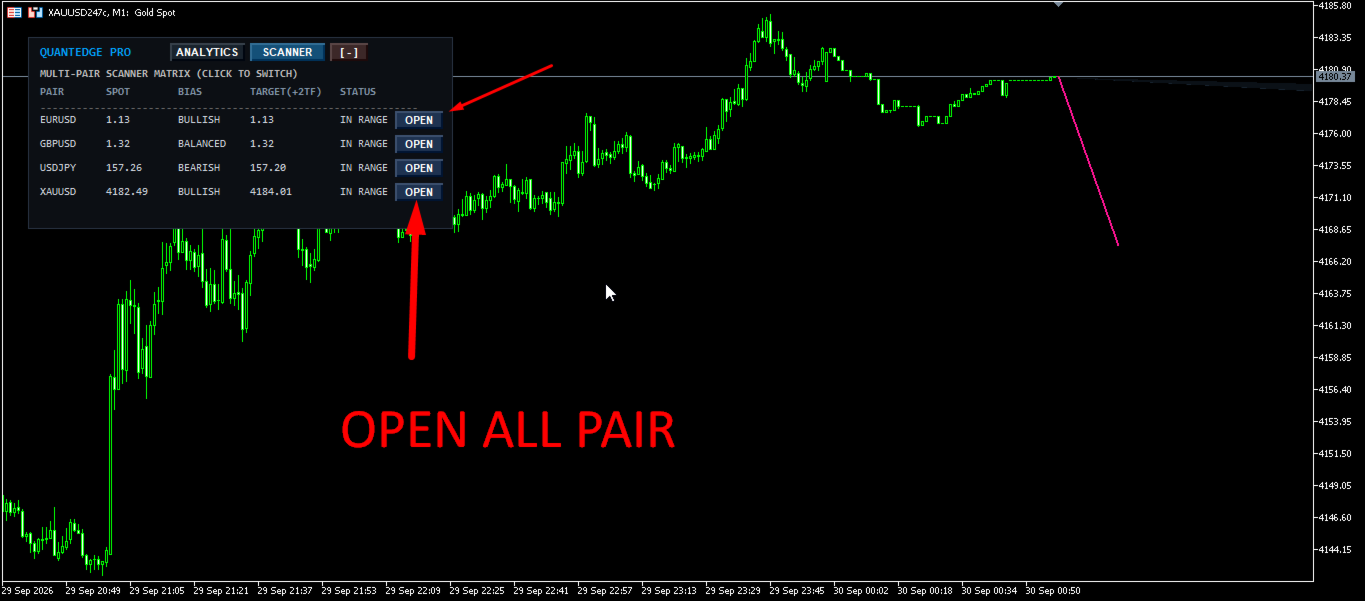
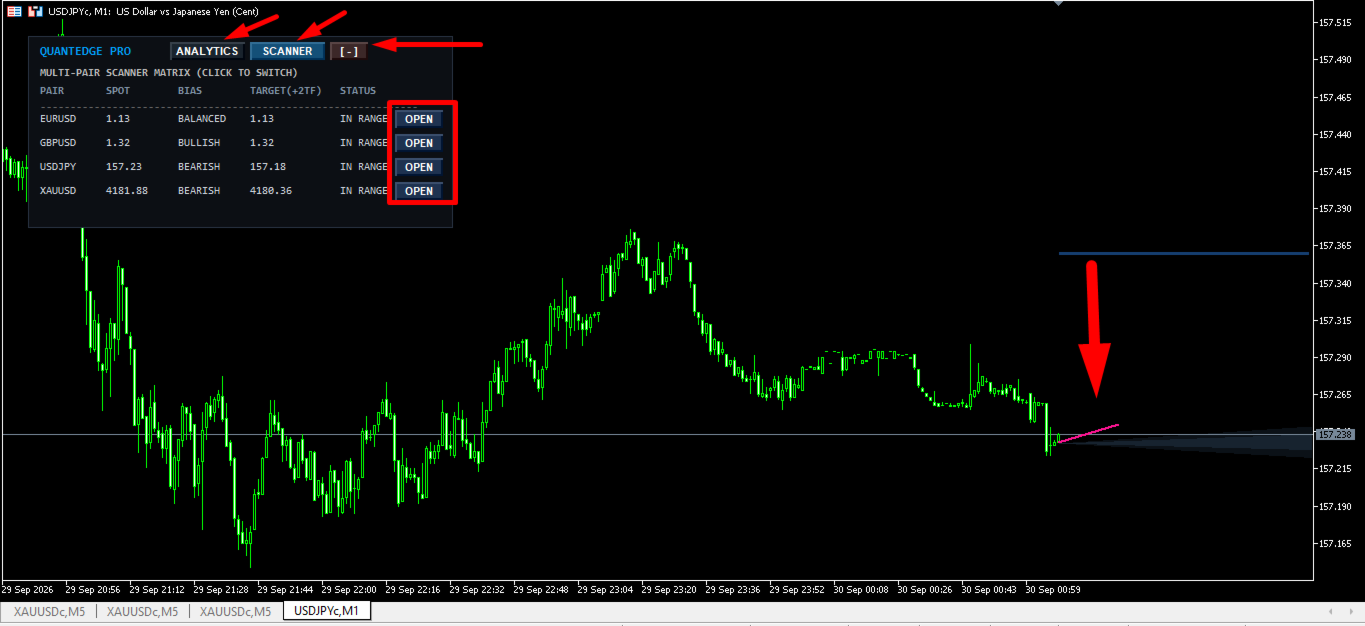
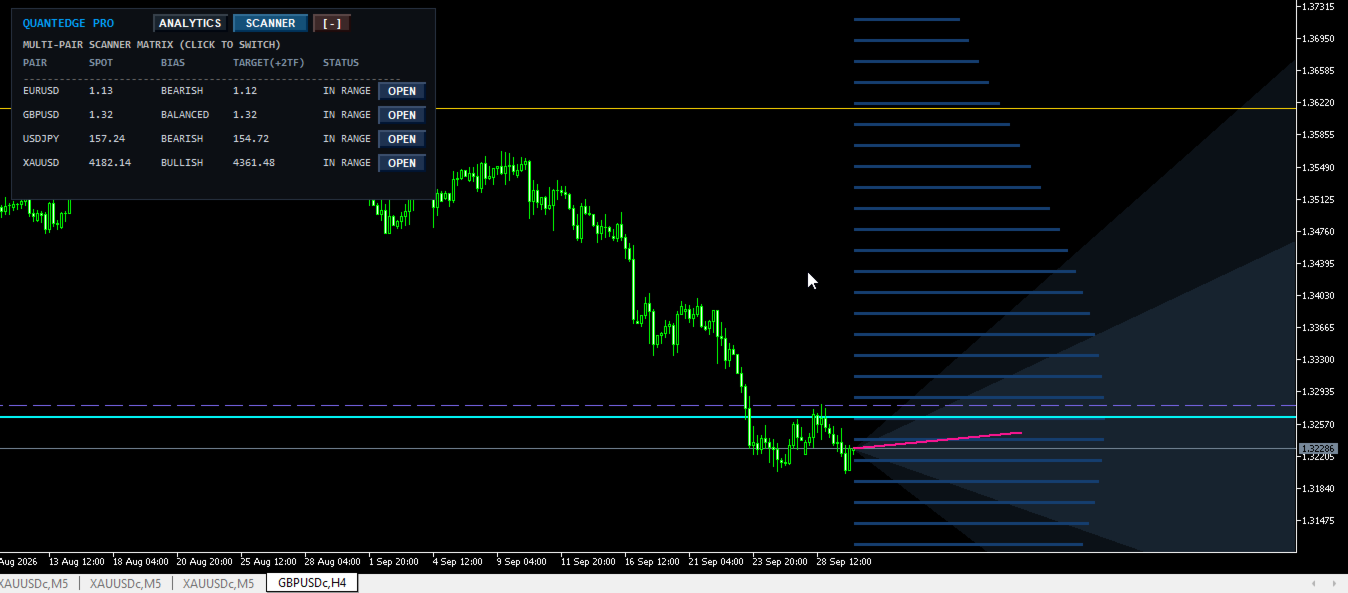
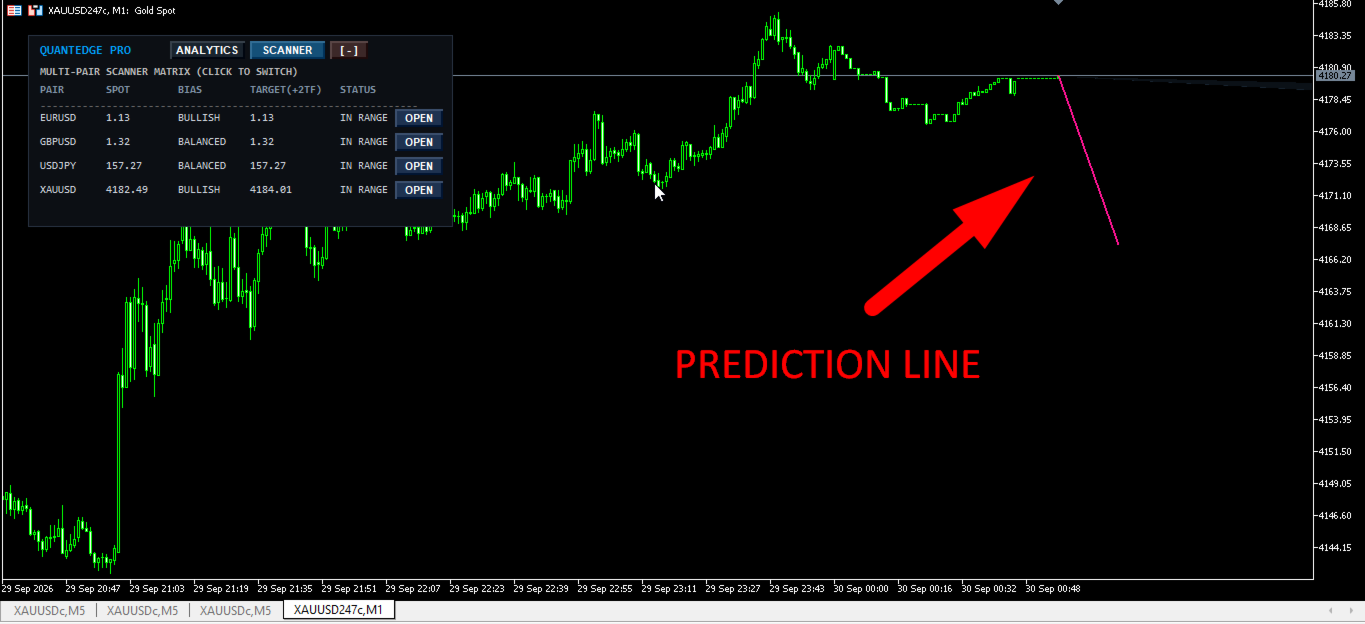
➔ Multi-Pair Matrix Scanner: Scans your watchlist in real-time, displaying live Spot, Bias, Target (+2TF), and Deviation Status with 1-click chart switching.
➔ Multi-Timeframe Predictive Trajectory: Projects a non-repainting predictive vector targeting two timeframe tiers higher (+2TF) for precise target planning.
➔ Autonomous Adaptive Modeling: Operates seamlessly with or without CSV option chain files. In absence of CSV data, it dynamically derives continuous volatility curves from live price dispersion.
════════════════════════════════════════════════════════════════════
MATHEMATICAL FOUNDATION & COMPUTATIONAL RIGOR
════════════════════════════════════════════════════════════════════
QuantEdge Probability Map Pro executes proven quantitative finance algorithms in real-time:
1. Black-Scholes Numerical Implied Volatility Solver:
Incorporates an iterative hybrid solver combining accelerated Newton-Raphson tangent search with a bisection fallback boundary. It evaluates option quotes across multiple strikes to derive exact implied volatilities (IV) without convergence failure across deep OTM or ITM strikes.
2. Natural Cubic Spline Volatility Smile Interpolation:
To prevent discrete stepping from crude linear interpolation, the engine fits a C2 continuous Natural Cubic Spline across the volatility smile. It enforces second-derivative continuity at every strike node, yielding a smooth, fully differentiable volatility curve.
3. Breeden-Litzenberger State-Price Density Theorem:
The core pillar of options probability states that risk-neutral probability density f(K) is proportional to the second partial derivative of European call prices with respect to strike K:
f(K) = exp(r * T) * (d2C / dK2)
QuantEdge computes this continuous derivative across regular strike intervals, isolating real-market negative skewness (tail risk) and excess kurtosis (fat tails).
4. Real-Time Continuous Log-Normal Diffusion Modeling:
In autonomous mode (without CSV option chains), the engine leverages continuous-time stochastic calculus. It translates multi-bar price dispersion into an annualized volatility proxy (sigma), reconstructing log-normal probability densities, confidence cones, and moment metrics instantly.
════════════════════════════════════════════════════════════════════
CORE FEATURE SUITE & TACTICAL TRADER BENEFITS
════════════════════════════════════════════════════════════════════
✦ 1. Interactive Multi-Pair Matrix Scanner:
• Monitor an entire portfolio of instruments simultaneously from a single chart window.
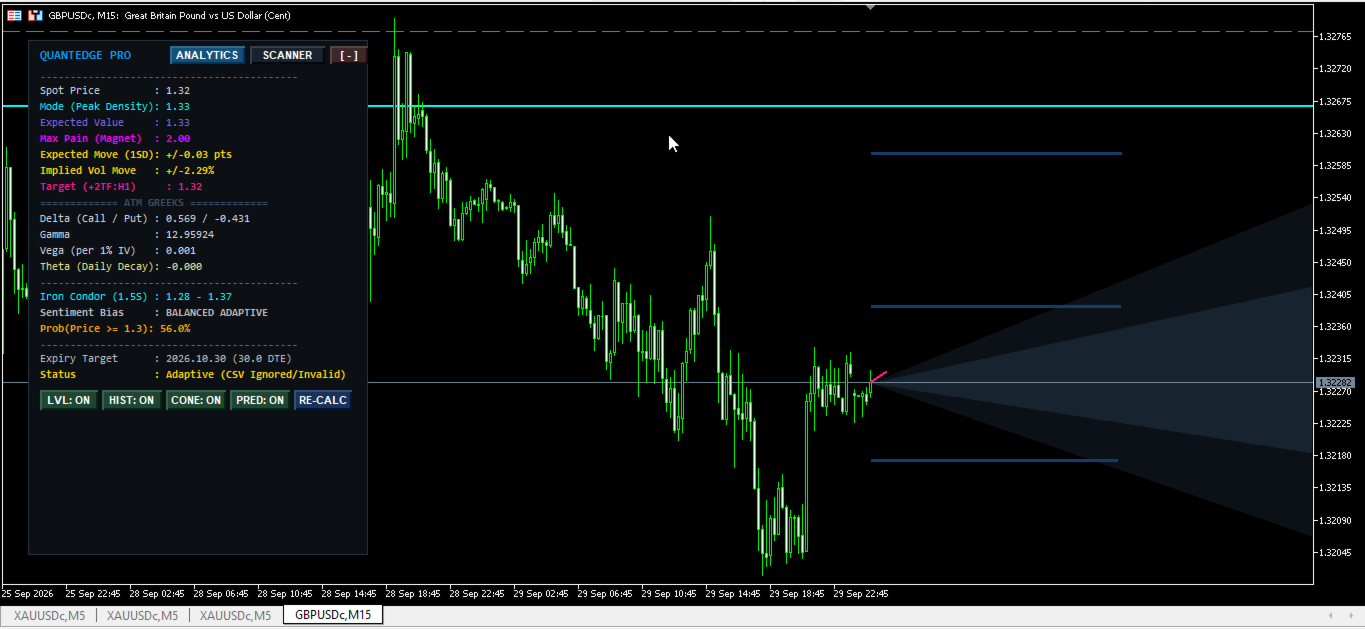
• Displays real-time Spot Price, Directional Bias (BULLISH, BEARISH, BALANCED), Projected Target (+2TF), and Deviation Status (IN RANGE, OVERBOUGHT, OVERSOLD).
• 1-Click Symbol Switch: Every row features an [OPEN] button to switch your active chart symbol instantly without opening new chart windows.
✦ 2. Adaptive Multi-Timeframe Predictor (+2TF Vector):
• Projects mathematical drift trajectory 2 timeframes higher (M5 -> M30, M15 -> H1, M30 -> H4, H1 -> D1, H4 -> W1).
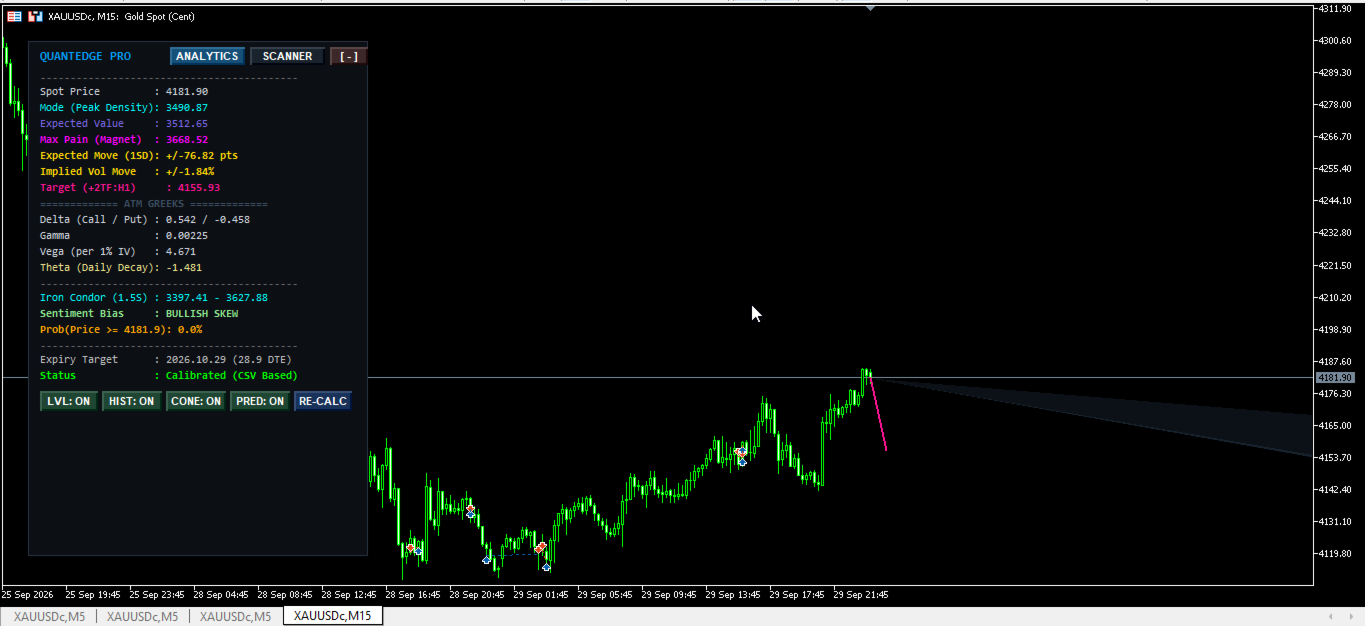
• Draws a non-repainting predictive vector line directly to the target price while displaying the exact numerical price coordinate on the HUD panel.
✦ 3. CCanvas High-Speed Alpha-Blending Graphics Engine:
• Powered by MetaTrader 5's native CCanvas bitmap class, rendering translucent graphics directly to the chart background.
• Delivers true hardware-accelerated transparency for probability cones and density profile histograms without covering candlestick wicks or causing terminal lag.
✦ 4. Institutional Gravitational Magnets (Mode, Mean & Max Pain):
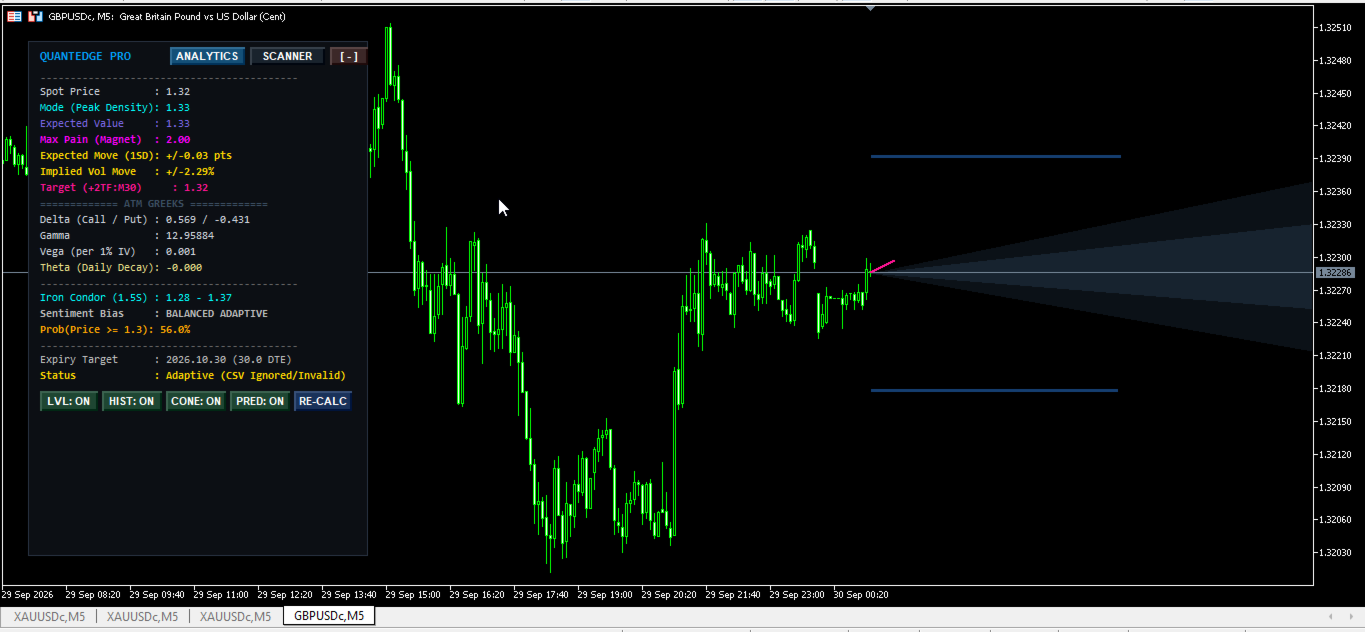
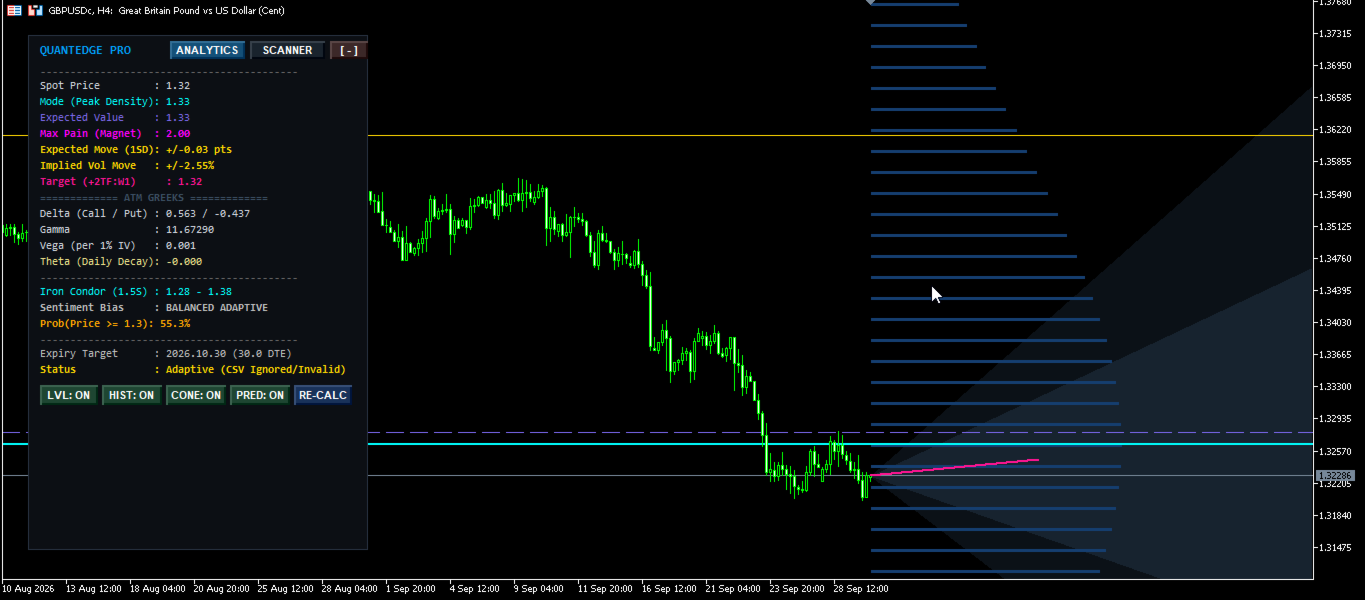
• Mode Price (Peak Density): Highlights the strike level holding the single highest probability concentration in the distribution.
• Mean Price (Expected Value): Identifies the mathematically balanced center of gravity for price at the expiration horizon.
• Max Pain Level: The strike level where option buyers incur maximum financial loss. Underlying assets frequently gravitate toward this level near expiration as dealers rebalance delta hedges.
✦ 5. Precision Volatility Bands (+/- 1-Sigma & +/- 2-Sigma):
• 1-Sigma Bands (68.27% Confidence): Outlines the standard expected move corridor representing normal market pricing.
• 2-Sigma Bands (95.45% Confidence): Highlights statistical exhaustion zones. Touches at 2-Sigma represent prime mean-reversion reversal setups.
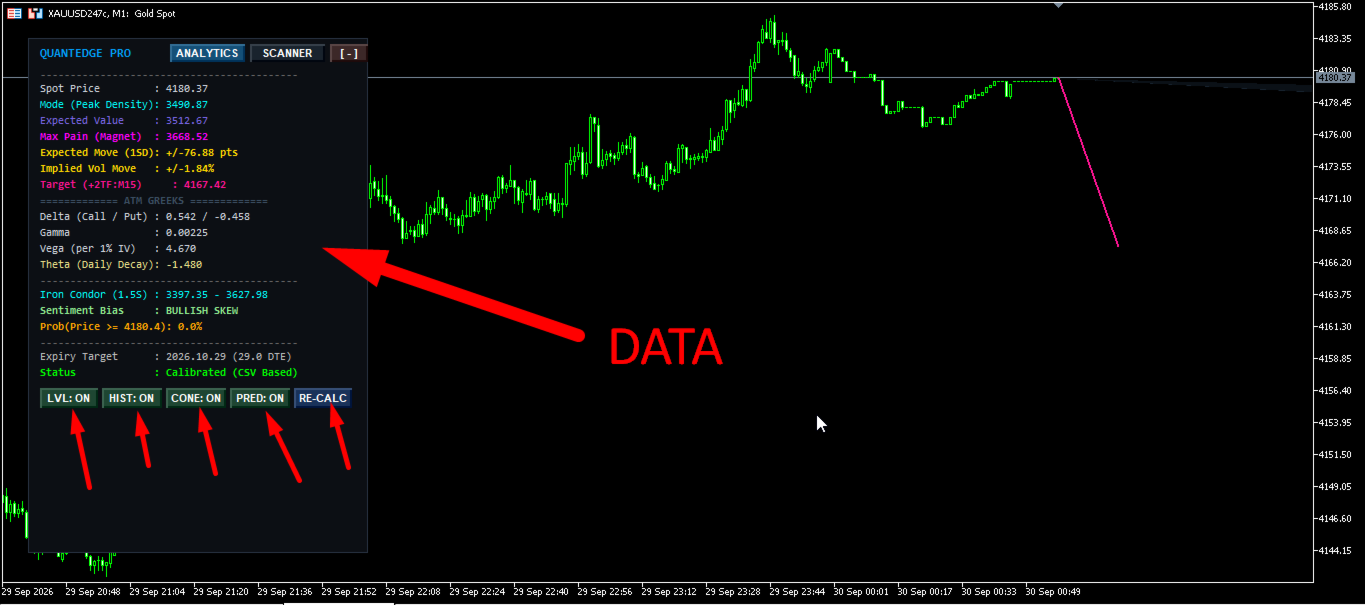
✦ 6. Live At-The-Money (ATM) Option Greeks:
• Displays real-time risk sensitivity metrics on the HUD:
- Delta (Call/Put): Real-time directional sensitivity of ATM options.
- Gamma: The rate of change in delta, signaling impending volatility acceleration.
- Vega: Sensitivity of prices relative to a 1% shift in systemic volatility.
- Theta: Exact point value loss per day due to time decay, ideal for timing range trades.
✦ 7. Institutional Iron Condor Boundary Range:
• Dynamically calculates 1.5-Sigma boundaries (93.32% upper and 6.68% lower percentiles).
• Provides range traders with statistically verified support and resistance boundaries for fade setups.
✦ 8. Multi-Channel Alert & Push Notification Suite:
• Receive terminal pop-up alerts, audio chimes, and instant push notifications directly to your MT5 mobile app whenever price breaches 2-Sigma boundaries.
• Features an alert cooldown timer to eliminate notification spamming during volatility spikes.
✦ 9. Minifiable & Draggable Glassmorphic HUD Panel:
• Full ergonomic control: drag and position the HUD anywhere across your workspace.
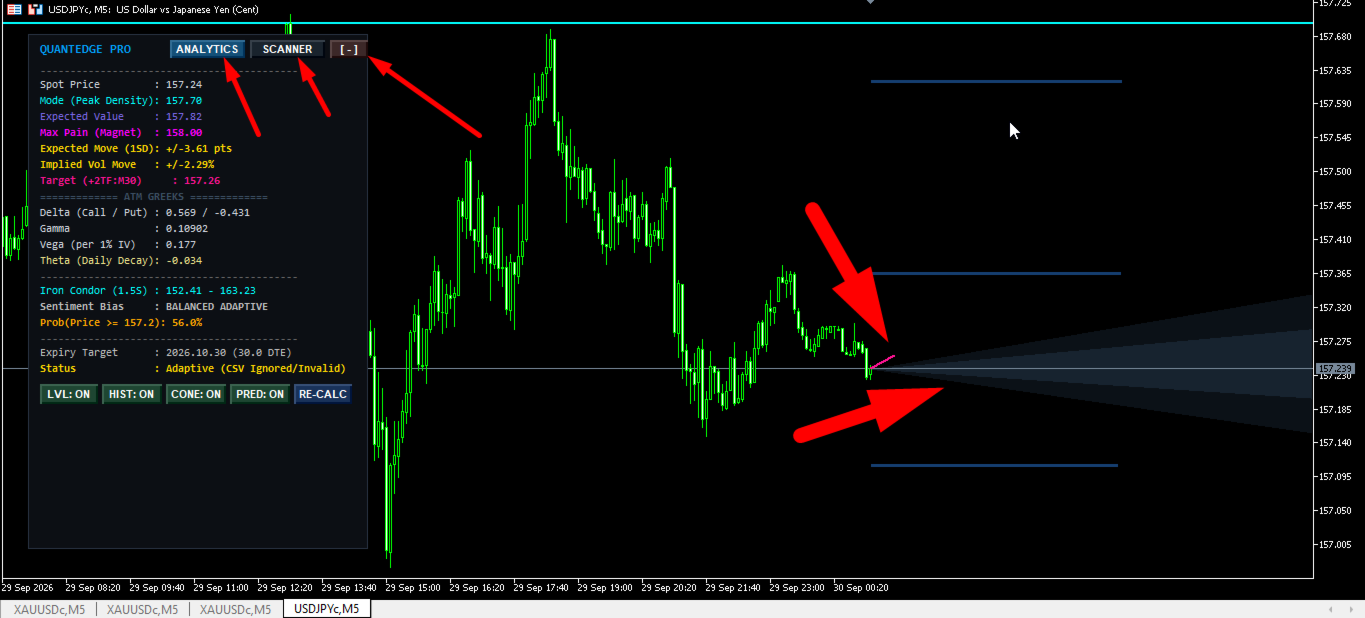
• One-click minimize button [ - ] collapses the interface into a discreet header bar to keep your workspace clear.
════════════════════════════════════════════════════════════════════
DETAILED ON-CHART VISUAL ELEMENTS EXPLAINED
════════════════════════════════════════════════════════════════════
◈ Right-Axis Density Profile Histogram:
Translucent blue bars on the right axis. Longer bars represent higher probability clusters where market participants expect price to trade. Low-density valleys represent liquidity vacuums where price moves rapidly without resistance.
◈ Forward Probability Cone:
A forward-expanding translucent shaded funnel projecting from the live candle to expiration:
• Inner Core (1-Sigma): Darker shaded corridor enclosing 68.27% of all modeled pricing trajectories.
• Outer Boundary (2-Sigma): Lighter shaded corridor enclosing 95.45% of potential price paths.
◈ Solid Cyan Line (Mode Level):
Marks the price point holding the absolute highest probability density peak in the distribution.
◈ Dashed Slate-Blue Line (Mean Expected Value):
The risk-neutral expected price at expiration, providing a benchmark for fundamental fair valuation.
◈ Magenta Dash-Dot Line (Max Pain Magnet):
The institutional pinning level. Price frequently gravitates toward this level near expiration due to market maker hedging.
◈ Solid Gold Lines (+/- 1-Sigma Expected Move):
Upper and lower boundaries of the standard expected move corridor.
◈ Dotted Orange Lines (+/- 2-Sigma Extreme Deviation):
Upper overbought and lower oversold boundary lines representing statistical exhaustion barriers.
◈ Vertical Red Dash-Dot Line (Expiry Wall):
Vertical line marking the expiration timestamp for the analyzed cycle.
◈ Deep Pink Predictive Trajectory Vector:
Non-repainting vector line projecting the directional path to the +2TF target price.
════════════════════════════════════════════════════════════════════
EXHAUSTIVE PARAMETER SPECIFICATIONS & USER MANUAL
════════════════════════════════════════════════════════════════════
Every input parameter in QuantEdge Probability Map Pro has been designed for maximum institutional flexibility:
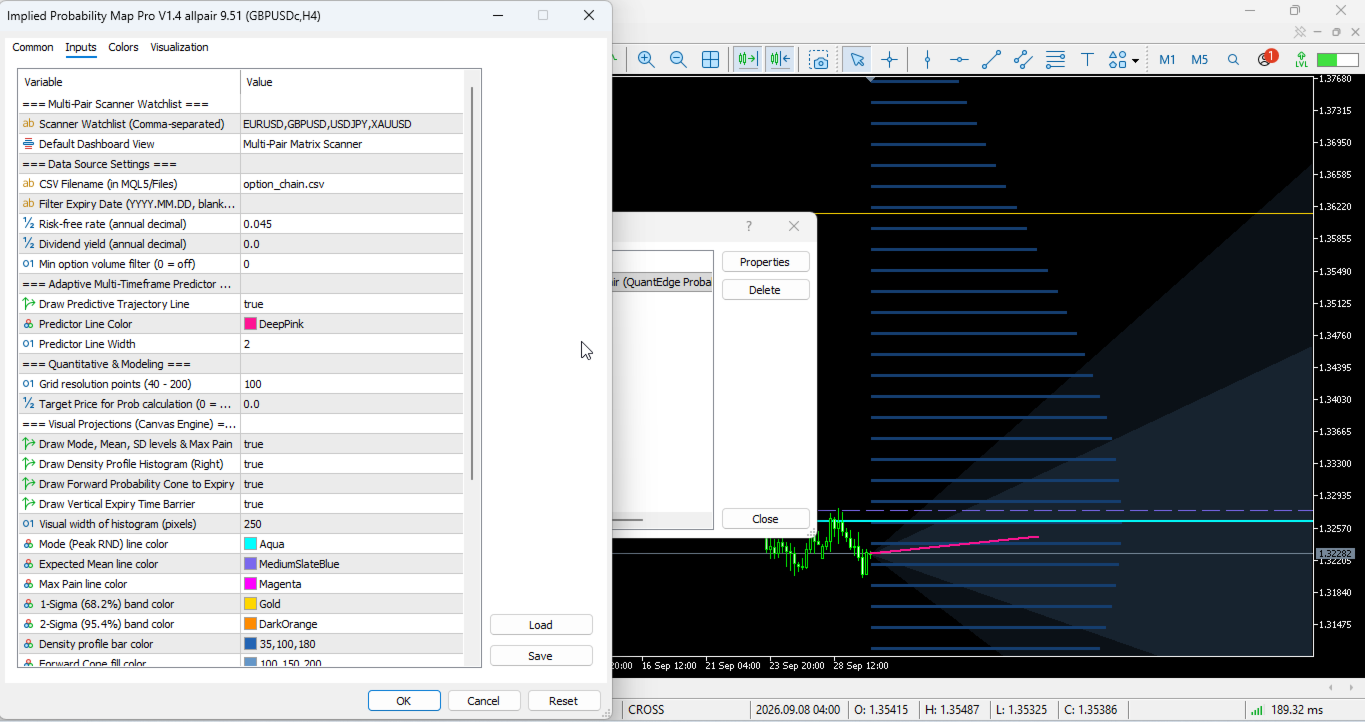
=== 1. MULTI-PAIR SCANNER WATCHLIST ===
• InpScannerPairs (string, default: "EURUSD,GBPUSD,USDJPY,XAUUSD"):
Comma-separated list of symbols for the Scanner Matrix. Enter any broker symbol name. The built-in symbol matcher automatically resolves broker suffixes (e.g., '.pro', 'm', 'c').
• InpDefaultTab (ENUM_DASH_TAB, default: TAB_SCANNER):
Specifies default dashboard view: TAB_SCANNER (multi-pair matrix) or TAB_ANALYTICS (detailed Greeks and density metrics).
=== 2. DATA SOURCE SETTINGS ===
• InpCSVFileName (string, default: "option_chain.csv"):
File name of the option chain placed in the MT5 'MQL5/Files' directory. If omitted or if strikes do not match the live price, the indicator automatically activates its autonomous Adaptive Mode.
• InpFilterExpiry (string, default: ""):
Target expiration date formatted as 'YYYY.MM.DD'. If left blank, the engine automatically selects the nearest expiration cycle found in the data.
• InpRiskFreeRate (double, default: 0.045):
Annual risk-free interest rate in decimal format (e.g., 0.045 represents 4.5% annual rate).
• InpDividendYield (double, default: 0.000):
Annual dividend yield or foreign exchange carrying cost in decimal format.
• InpFilterMinVolume (int, default: 0):
Minimum contract volume threshold. Filters out illiquid strikes with zero or negligible trading volume.
=== 3. ADAPTIVE MULTI-TIMEFRAME PREDICTOR ===
• InpDrawPredictor (bool, default: true):
Enables or disables the single forward-looking predictive trajectory line on the chart.
• InpPredictorColor (color, default: clrDeepPink):
Color of the forward predictive trajectory line and target coordinates.
• InpPredictorWidth (int, default: 2):
Line thickness of the predictive trajectory vector (Range: 1 to 5).
=== 4. QUANTITATIVE & MODELING ===
• InpGridPoints (int, default: 100):
Resolution count along the price axis for spline and density integration (Range: 40 to 200). Higher numbers increase curve granularity.
• InpCustomTarget (double, default: 0.0):
Custom target price for probability calculations. Set to 0.0 to automatically track the current live spot price.
=== 5. VISUAL PROJECTIONS (CANVAS ENGINE) ===
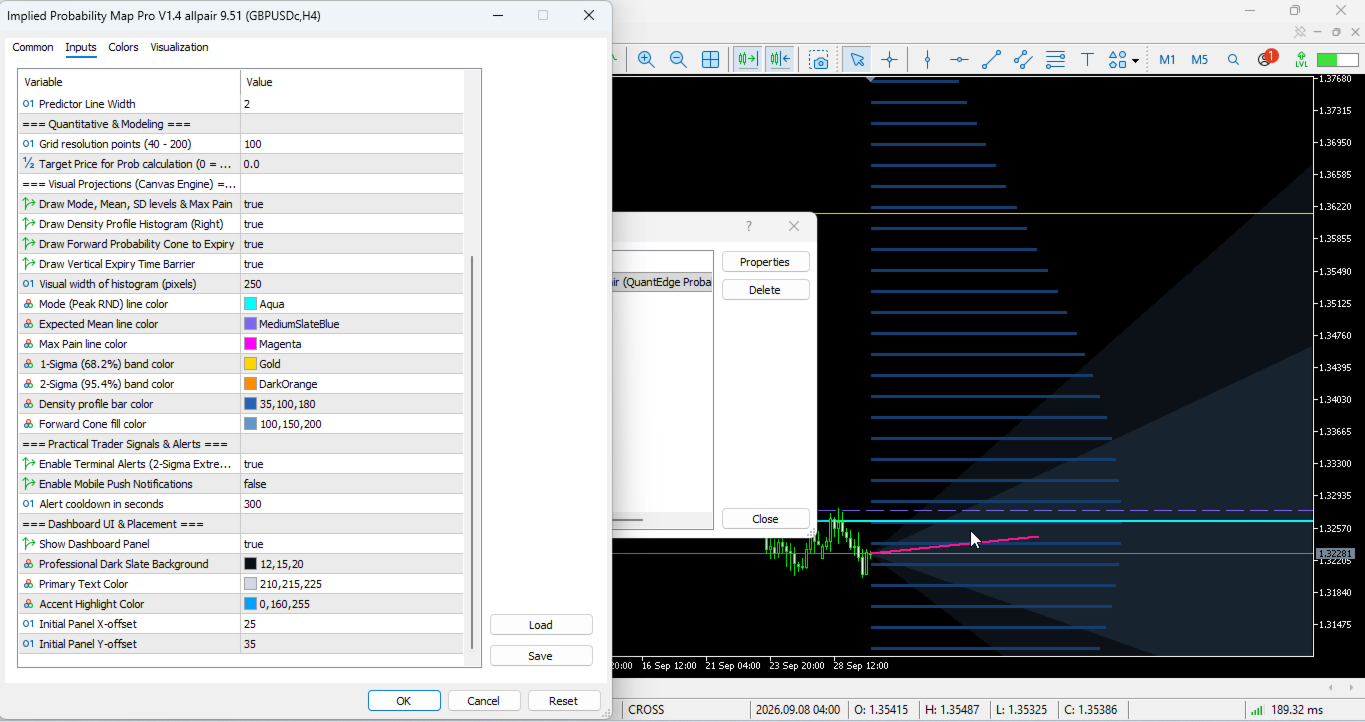
• InpDrawLevels (bool, default: true): Toggles horizontal Mode, Mean, Max Pain, and Sigma levels.
• InpDrawDensityHist (bool, default: true): Toggles the translucent density profile histogram on the right margin.
• InpDrawForwardCone (bool, default: true): Toggles the forward translucent 1-Sigma and 2-Sigma probability cone.
• InpDrawExpiryWall (bool, default: true): Toggles the vertical expiration barrier line.
• InpHistWidthPixels (int, default: 250): Maximum pixel width for the highest peak in the density histogram.
• InpModeColor (color, default: clrAqua): Line color for the Mode level (highest density peak).
• InpMeanColor (color, default: clrMediumSlateBlue): Line color for the expected Mean level.
• InpMaxPainColor (color, default: clrMagenta): Line color for the institutional Max Pain level.
• InpSD1Color (color, default: clrGold): Line color for the +/- 1-Sigma expected move bands.
• InpSD2Color (color, default: clrDarkOrange): Line color for the +/- 2-Sigma extreme deviation bands.
• InpHistBarColor (color, default: C'35,100,180'): Base color for the density profile histogram bars.
• InpConeColor (color, default: C'100,150,200'): Base color for the forward probability cone.
=== 6. PRACTICAL TRADER SIGNALS & ALERTS ===
• InpEnableAlerts (bool, default: true): Enables desktop terminal pop-up alerts and audio chimes when price breaches 2-Sigma.
• InpEnablePush (bool, default: false): Enables mobile push notifications sent directly to your MetaTrader 5 mobile app.
• InpAlertCooldownSec (int, default: 300): Cooldown period in seconds between alerts to prevent notification spamming.
=== 7. DASHBOARD UI & PLACEMENT ===
• InpShowPanel (bool, default: true): Enables or disables the on-screen graphical dashboard.
• InpPanelBgColor (color, default: C'12,15,20'): Background color of the dashboard panel.
• InpTextColor (color, default: C'210,215,225'): Primary typography color.
• InpAccentColor (color, default: C'0,160,255'): Accent color for headers, highlights, and borders.
• InpPanelX (int, default: 25): Initial X-offset from the left edge of the chart window in pixels.
• InpPanelY (int, default: 35): Initial Y-offset from the top edge of the chart window in pixels.
════════════════════════════════════════════════════════════════════
INSTITUTIONAL TRADING PLAYBOOK & STRATEGY FRAMEWORKS
════════════════════════════════════════════════════════════════════
QuantEdge Probability Map Pro equips traders with statistically verified entry and exit setups:
❖ STRATEGY 1: STATISTICAL MEAN REVERSION (THE 2-SIGMA FADE)
• Setup Context: Price extends rapidly into extreme territory, penetrating the dotted orange 2-Sigma boundary.
• Trigger & Execution: Look for rejection candlestick patterns (pin bar, engulfing) closing back inside the 2-Sigma band.
• Target & Exit: Take Profit 1 at the 1-Sigma line; Take Profit 2 at the Mode or Mean price line.
• Mathematical Edge: Over 95.45% of price distribution remains inside 2-Sigma, making boundary penetrations high-probability reversal zones.
❖ STRATEGY 2: DEALER GRAVITATIONAL PINNING (MAX PAIN HARVEST)
• Setup Context: Asset trades within 2 to 5 days of options expiration (monitored via the dashboard DTE metric).
• Trigger & Execution: When price diverges significantly from the Magenta Max Pain line, enter trades positioned toward Max Pain.
• Target & Exit: Close positions directly at the Max Pain level prior to expiration.
• Mathematical Edge: Market makers dynamically adjust underlying hedges, pulling price toward Max Pain to minimize aggregate option payouts.
❖ STRATEGY 3: STATISTICAL IRON CONDOR & RANGE HARVESTING
• Setup Context: Dashboard displays "Sentiment Bias: BALANCED" and the Scanner Matrix displays "IN RANGE".
• Trigger & Execution: Trade range-bound fades or sell out-of-the-money options beyond the Iron Condor (1.5-Sigma) levels.
• Target & Exit: Target price return toward the central Mean Expected Value line.
• Mathematical Edge: Capitalizes on verified 86.6% historical containment rates during consolidating market regimes.
❖ STRATEGY 4: MULTI-TIMEFRAME MOMENTUM EXPANSION (+2TF)
• Setup Context: Price breaks cleanly outside the 1-Sigma band in the exact direction of the Predictive Trajectory vector.
• Trigger & Execution: Enter momentum trend trades aligned with the vector, placing defensive stops behind the opposite 1-Sigma boundary.
• Target & Exit: Target the projected price level displayed on the dashboard for the +2TF horizon.
════════════════════════════════════════════════════════════════════
DUAL DATA PIPELINE: CSV OPTION CHAIN VS AUTONOMOUS ENGINE
════════════════════════════════════════════════════════════════════
QuantEdge Probability Map Pro features a dual-engine architecture designed for 100% operational reliability:
1. External Option Chain Mode (Institutional Real-Market Data):
Drop your option chain CSV file into the MT5 'MQL5/Files' folder. The indicator automatically ingests strike quotes, open interest, and volume data to generate empirical Breeden-Litzenberger density functions.
Expected CSV format: Strike,Bid,Ask,Type,Expiry,Volume
Example: 2600.0,25.50,26.20,C,2026.10.30,4500
2. Autonomous Adaptive Quantitative Mode (Zero-Config Default):
If no CSV file is present, or if trading assets without exchange options (like spot Forex, spot Gold, or crypto CFDs), the built-in Adaptive Engine calculates empirical log-normal density curves from price action dispersion. You get complete institutional analytics, Greeks, probability cones, and predictive trajectories without manual CSV updates.
════════════════════════════════════════════════════════════════════
FREQUENTLY ASKED QUESTIONS (FAQ)
════════════════════════════════════════════════════════════════════
Q: Does this indicator repaint any lines or values?
A: Absolutely not. All probability distributions, mathematical moments, and predictive trajectory coordinates are calculated strictly from closed historical bars and live bid/ask prices. Once a candle closes, the historical distribution remains permanently fixed.
Q: Can I use this on Forex, Gold, Crypto, and Indices?
A: Yes. QuantEdge Probability Map Pro is completely asset-agnostic. It works flawlessly across Forex pairs, Gold (XAUUSD), Indices (US30, NAS100), and Cryptocurrencies (BTCUSD).
Q: Do I need a third-party paid data subscription?
A: No. The built-in Adaptive Mode derives all curves, levels, Greeks, and predictive vectors directly from price data in real-time.
Q: Does the indicator slow down MetaTrader 5?
A: No. By leveraging native CCanvas hardware-accelerated memory bitmaps, all graphics render smoothly with zero terminal freezing or chart lag.
Q: How does the Click-to-Switch button work in the Scanner?
A: In the SCANNER tab, simply click the [OPEN] button beside any symbol in the watchlist. The indicator calls MT5's native ChartSetSymbolPeriod function to switch your active chart instantly.
════════════════════════════════════════════════════════════════════
AUTHOR & SUPPORT ACKNOWLEDGMENT
════════════════════════════════════════════════════════════════════
Thank you for choosing QuantEdge Probability Map Pro. Built with rigorous quantitative standards, this engine provides retail and professional traders with an institutional-grade probabilistic edge.
For inquiries, support, or custom setups, reach out via the MQL5 Community messaging system. May your trading remain disciplined, systematic, and mathematically profitable!
════════════════════════════════════════════════════════════════════
★ QuantEdge Probability Map Pro • Copyrights by FAZA A N - 2026 ★
════════════════════════════════════════════════════════════════════