Harmonic Pattern Auto Scanner All Pair Timeframe
- 指标
- 版本: 1.13
- 更新: 12 九月 2026
- 激活: 5

HARMONIC PATTERN SCANNER DASHBOARD MT5 – Multi Pair Multi TF Gartley Bat Butterfly Crab Cypher Shark + MA RSI RVI Filters
════════════════ PRODUCT TYPE ════════════════
Product type : Technical Indicator
Platform : MetaTrader 5 (MT5)
Chart mode : Chart window overlay (dashboard + optional pattern drawing)
Plots : 0 (no extra price buffers)
Version : 1.13
Author : Harmonic Dashboard by FAZA A N
Use : Multi-symbol / multi-timeframe harmonic scanning, alerts, and visual trade planning (Entry / SL / TP1 / TP2 / TP3)
★ This product does not auto-trade. It is a scanner and planning tool.
════════════════ WHAT THIS INDICATOR DOES ════════════════
★ Watches many pairs and many timeframes in one panel
★ Finds XABCD harmonic structures from confirmed swing pivots
★ Matches Gartley, Bat, Butterfly, Crab, Cypher, and Shark
★ Applies optional trend filters (Single MA, RSI, Double MA, RVI)
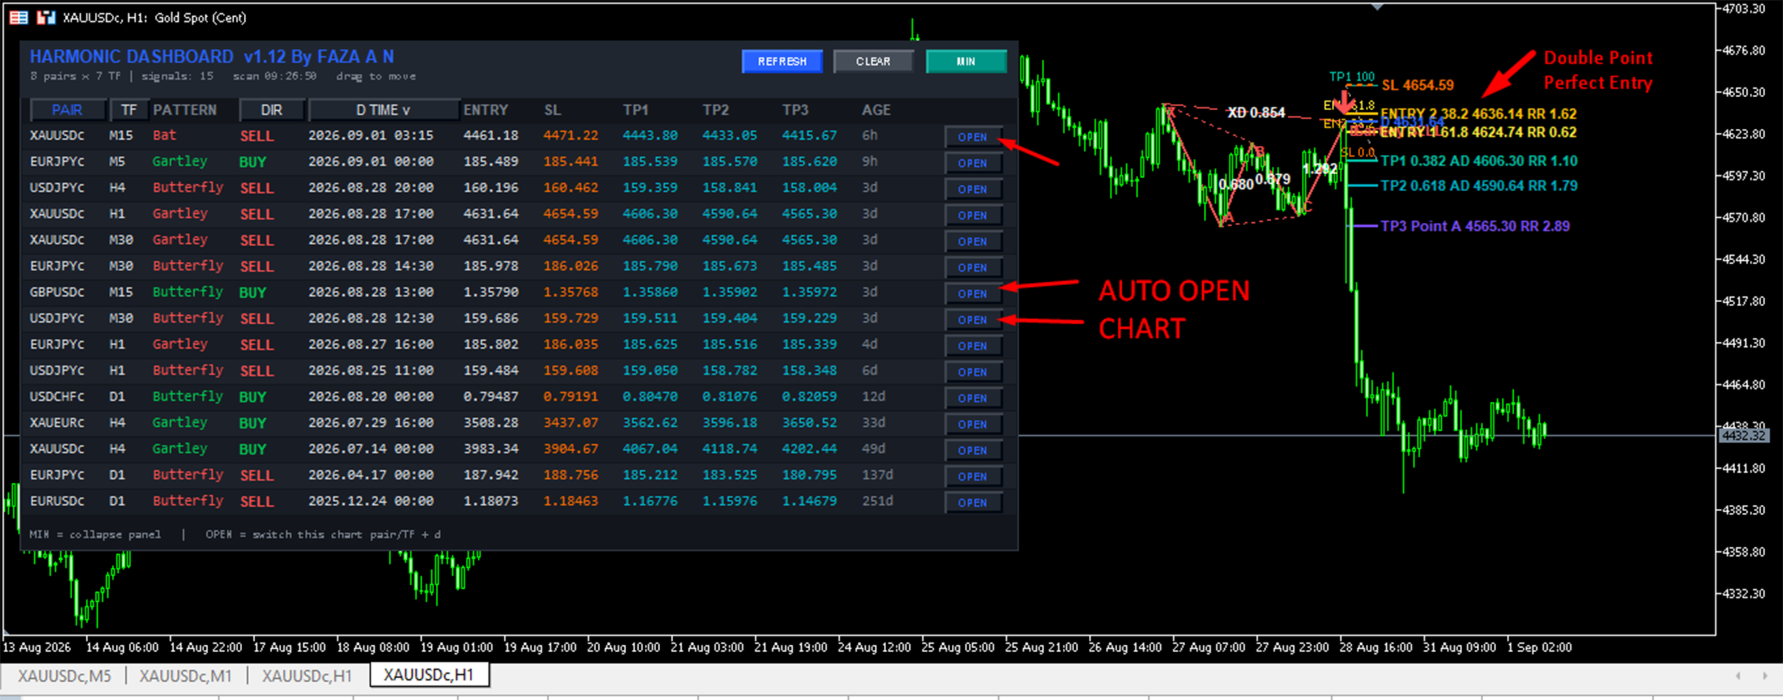
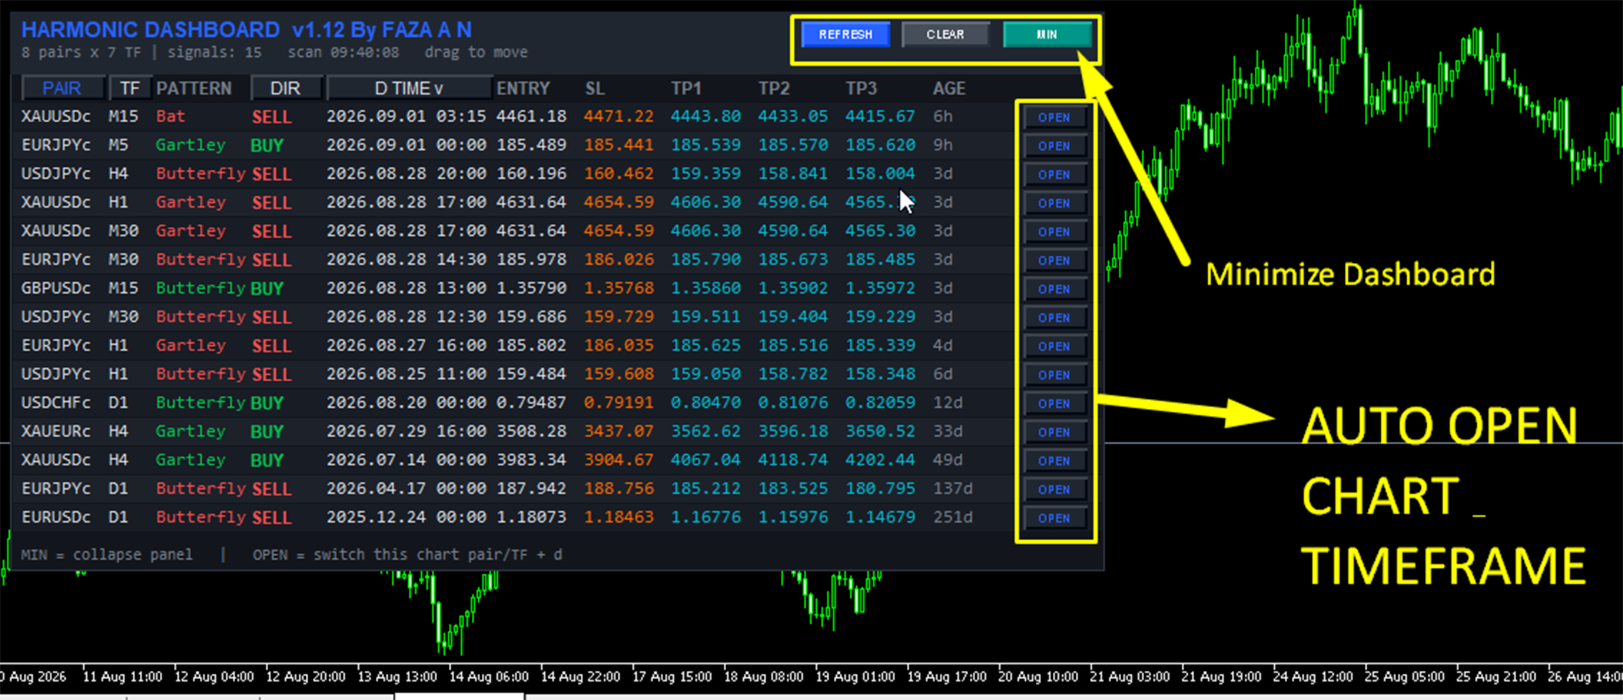
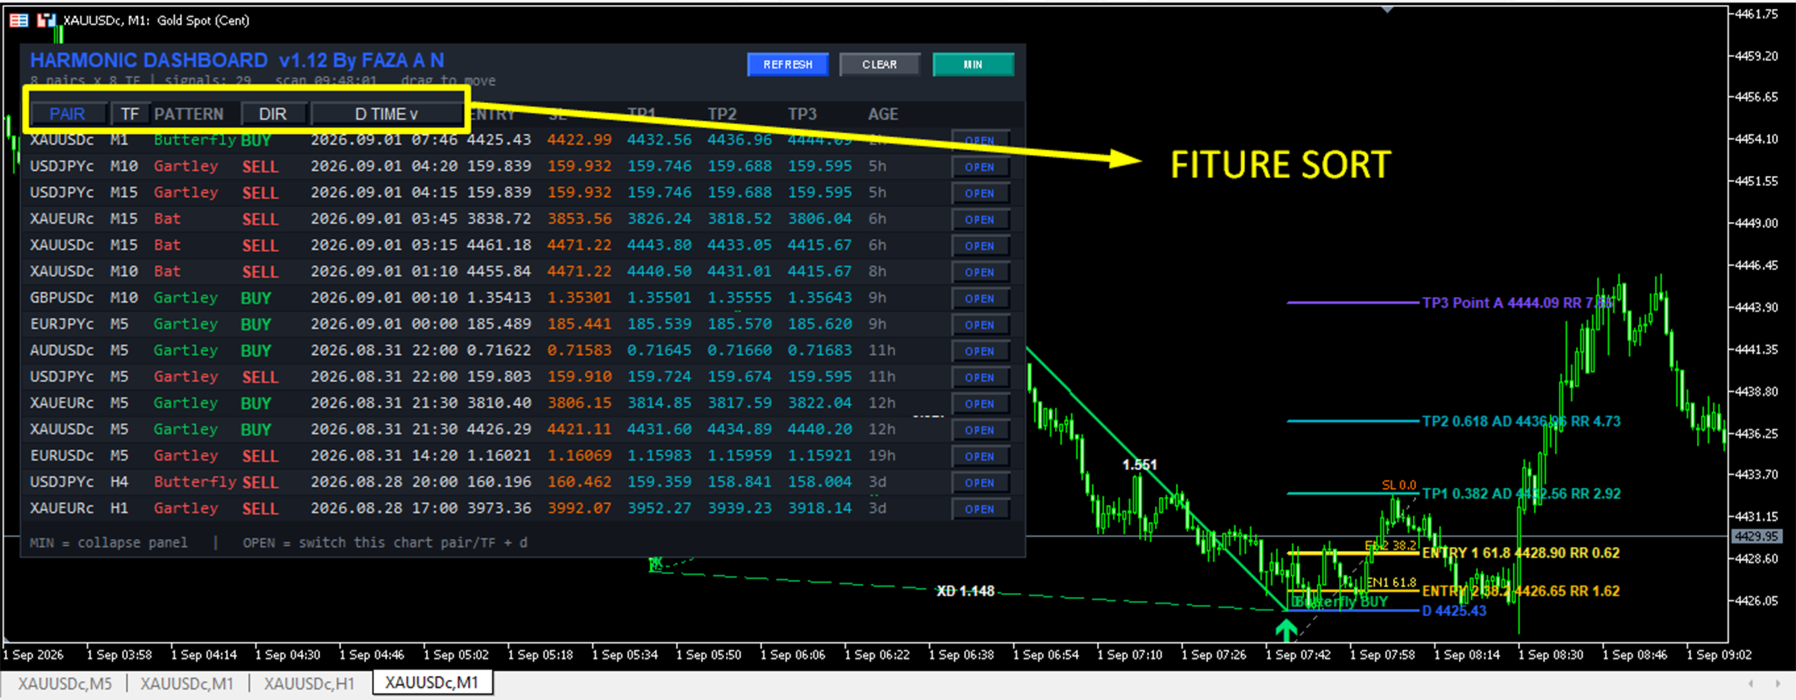
★ Shows PAIR, TF, PATTERN, DIR, D TIME, ENTRY, SL, TP1, TP2, TP3, AGE
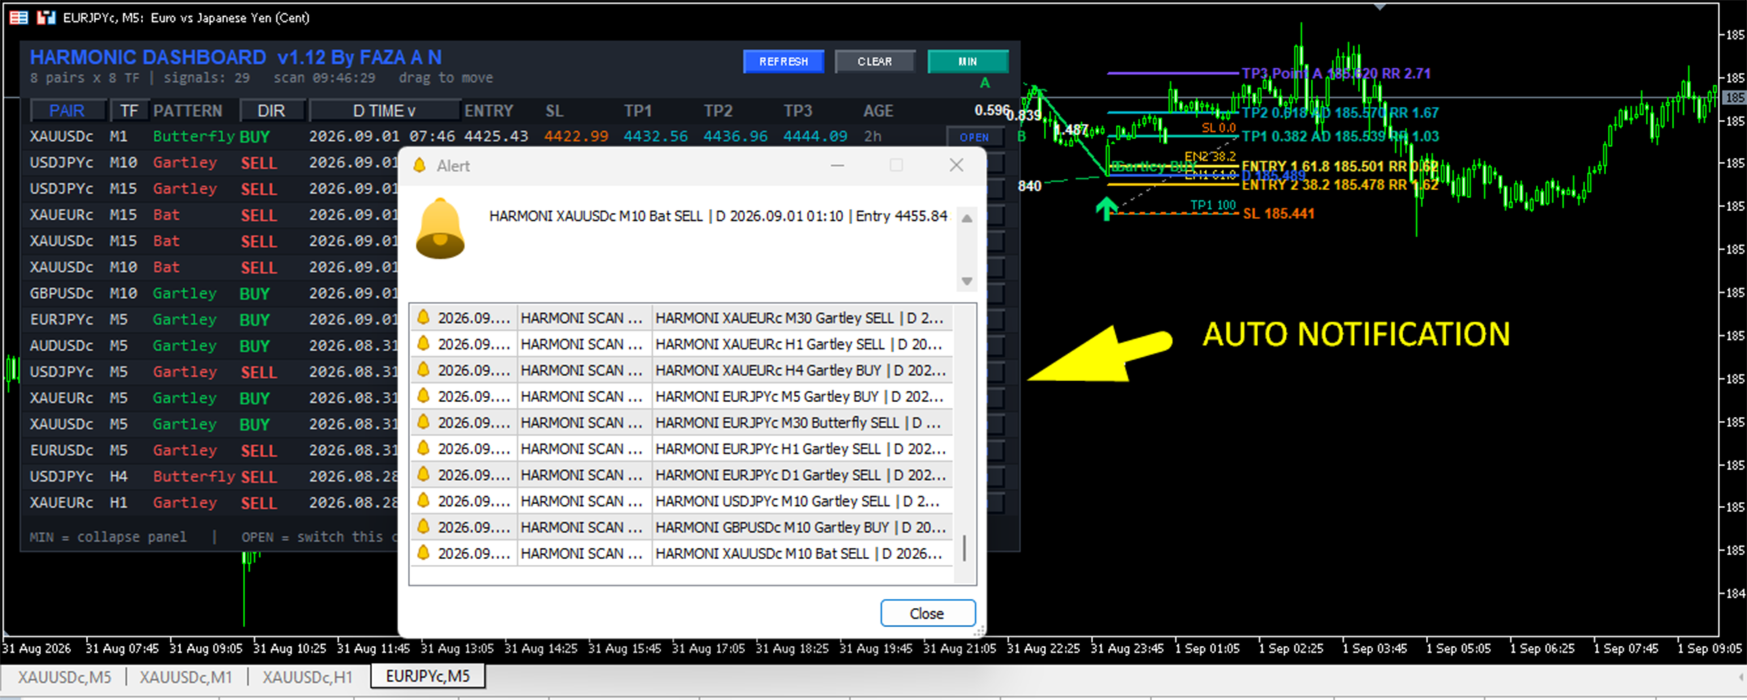
★ Sends popup, sound, and push alerts
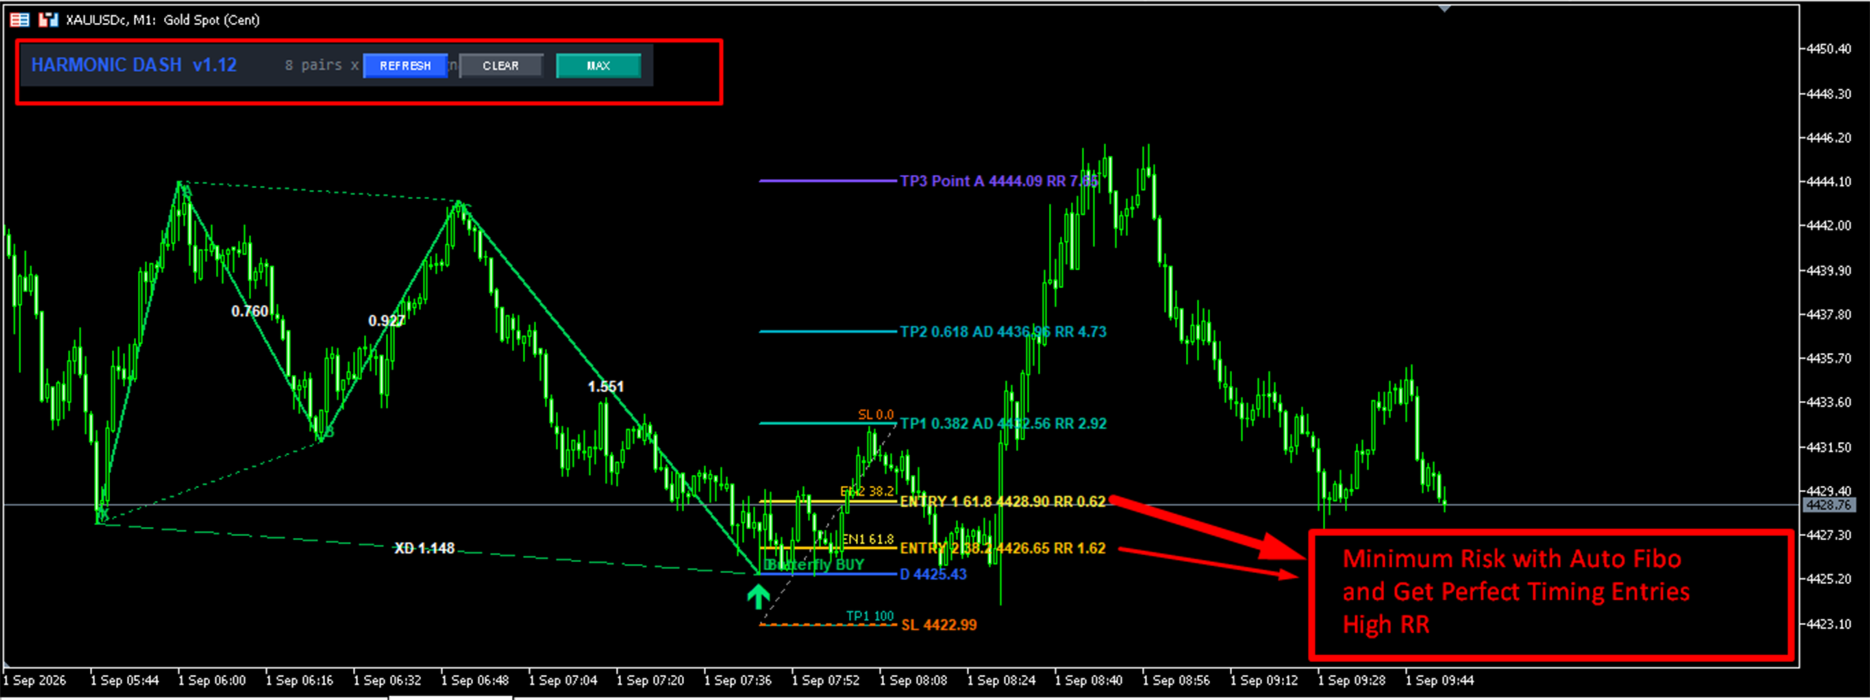
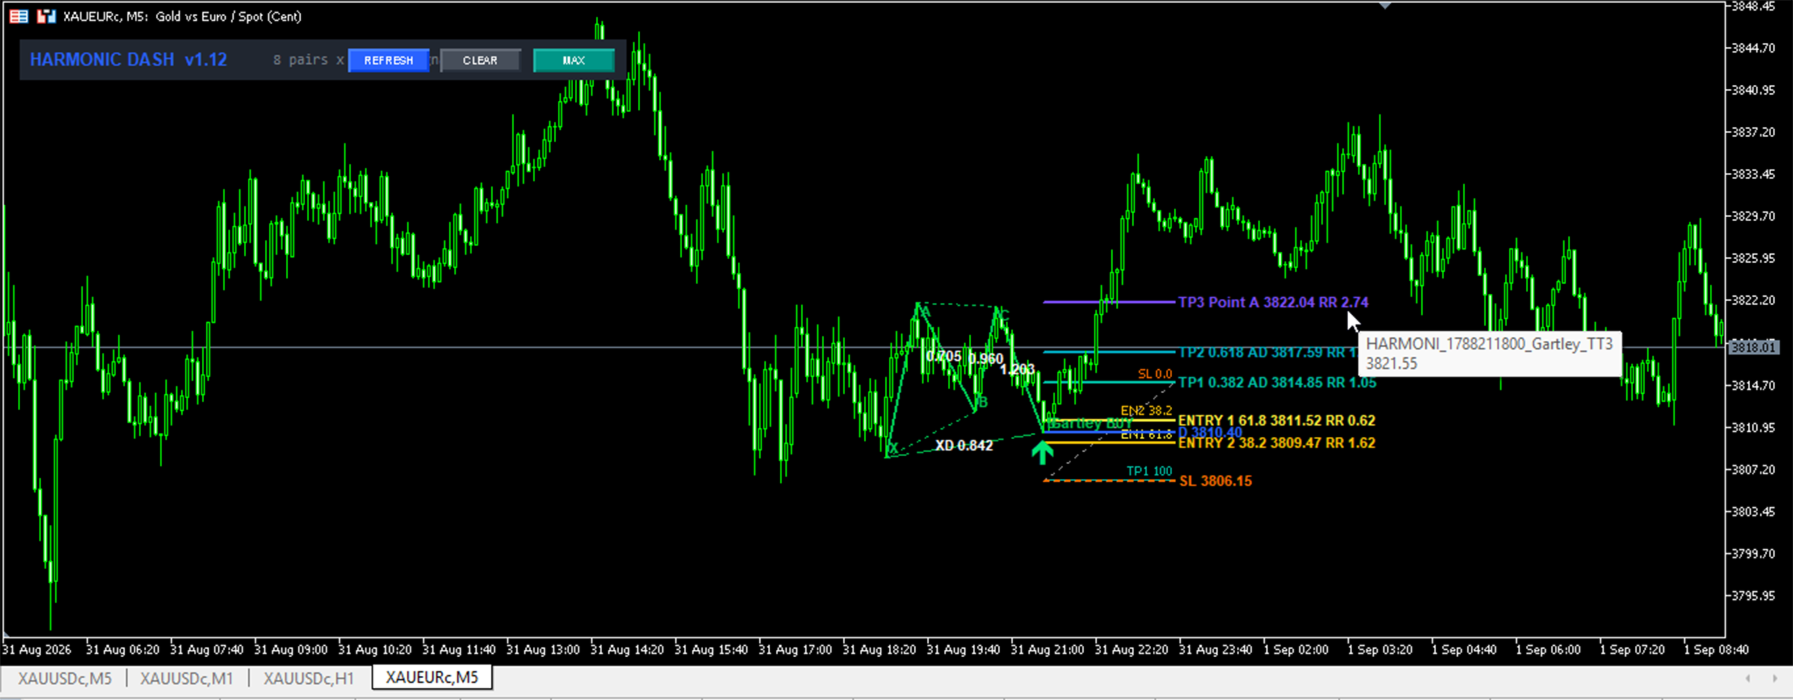
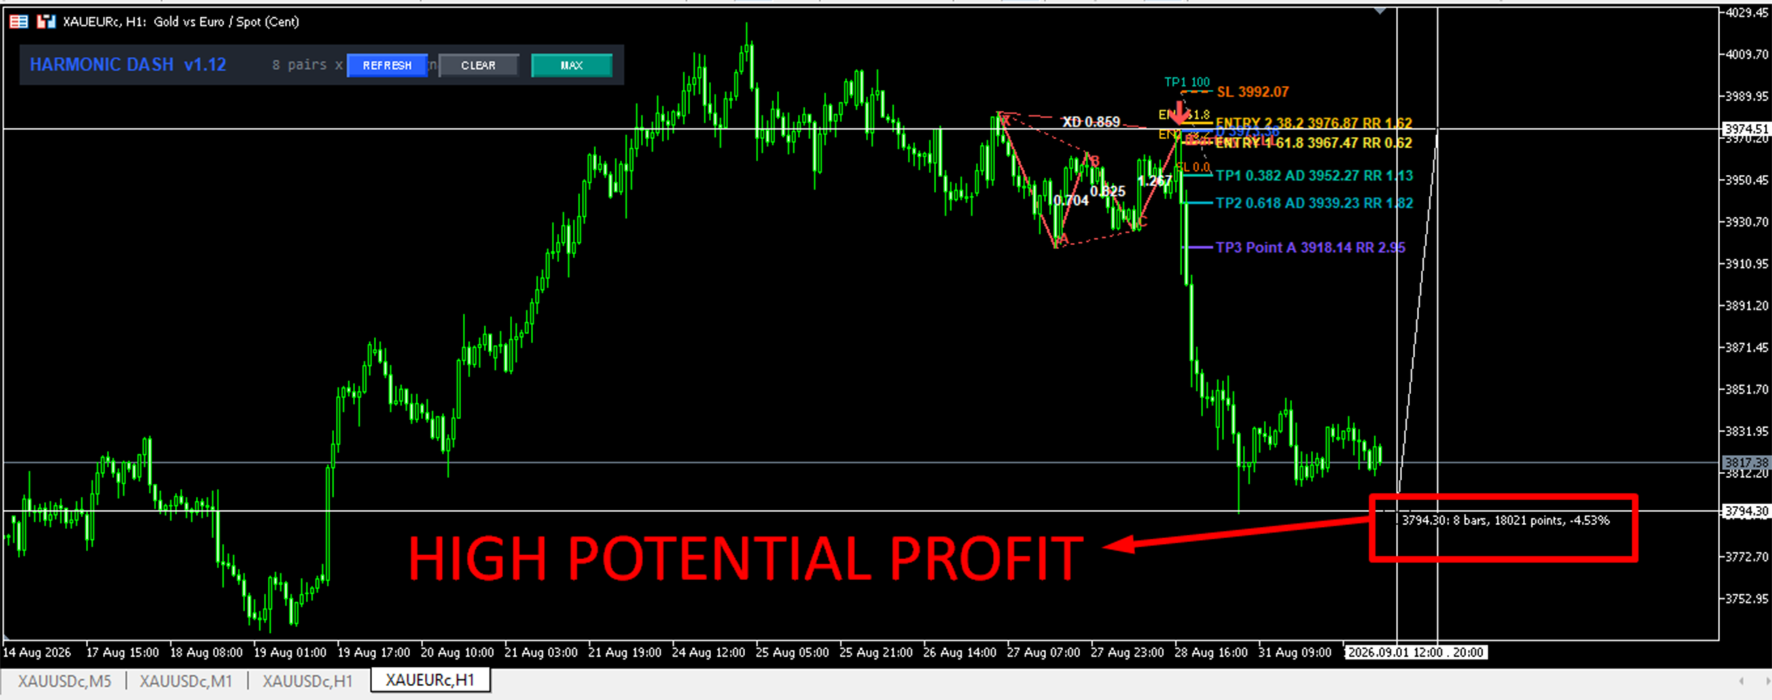
★ Draws the pattern, ratios, Fibonacci, SL, and targets on the chart
★ OPEN button jumps to that pair/timeframe and redraws the geometry
► Important design rule
The scanner keeps the newest valid harmonic for each pair and timeframe.
If that latest pattern fails the active filters, the row is hidden.
It does not fall back to an older pattern.
That keeps the table clean and avoids outdated signals.
════════════════ WHO IT IS FOR ════════════════
✓ Harmonic and price-action traders who want a multi-market watchlist
✓ Scalpers who scan M1–M30
✓ Swing traders who scan H1–D1
✓ Traders who only want harmonics when trend filters agree
✓ Users who want a ready plan: D entry, stop, and three targets
✓ Anyone tired of opening twenty charts just to hunt patterns
════════════════ KEY FEATURES ════════════════
► 1) Multi-pair scanner
Scan majors, crosses, metals such as XAUUSD, or Market Watch symbols, up to the Max pairs limit.
► 2) Multi-timeframe engine
One dashboard can scan M1 through D1, or any mix you type.
No need for a separate indicator on every timeframe.
► 3) Six harmonic patterns
Enable or disable each one:
✓ Gartley
✓ Bat
✓ Butterfly
✓ Crab
✓ Cypher
✓ Shark
► 4) Pivot / ZigZag swing engine
Swings come from confirmed pivot highs and lows using Pivot Length.
Same-direction swings are merged so the structure stays clean.
► 5) Ratio matching with tolerance
Classic harmonic ratios are checked with a tolerance input.
Lower tolerance = fewer, cleaner, more textbook hits.
Higher tolerance = more patterns, more approximate geometry.
► 6) Direction control
Scan both sides, BUY only, or SELL only.
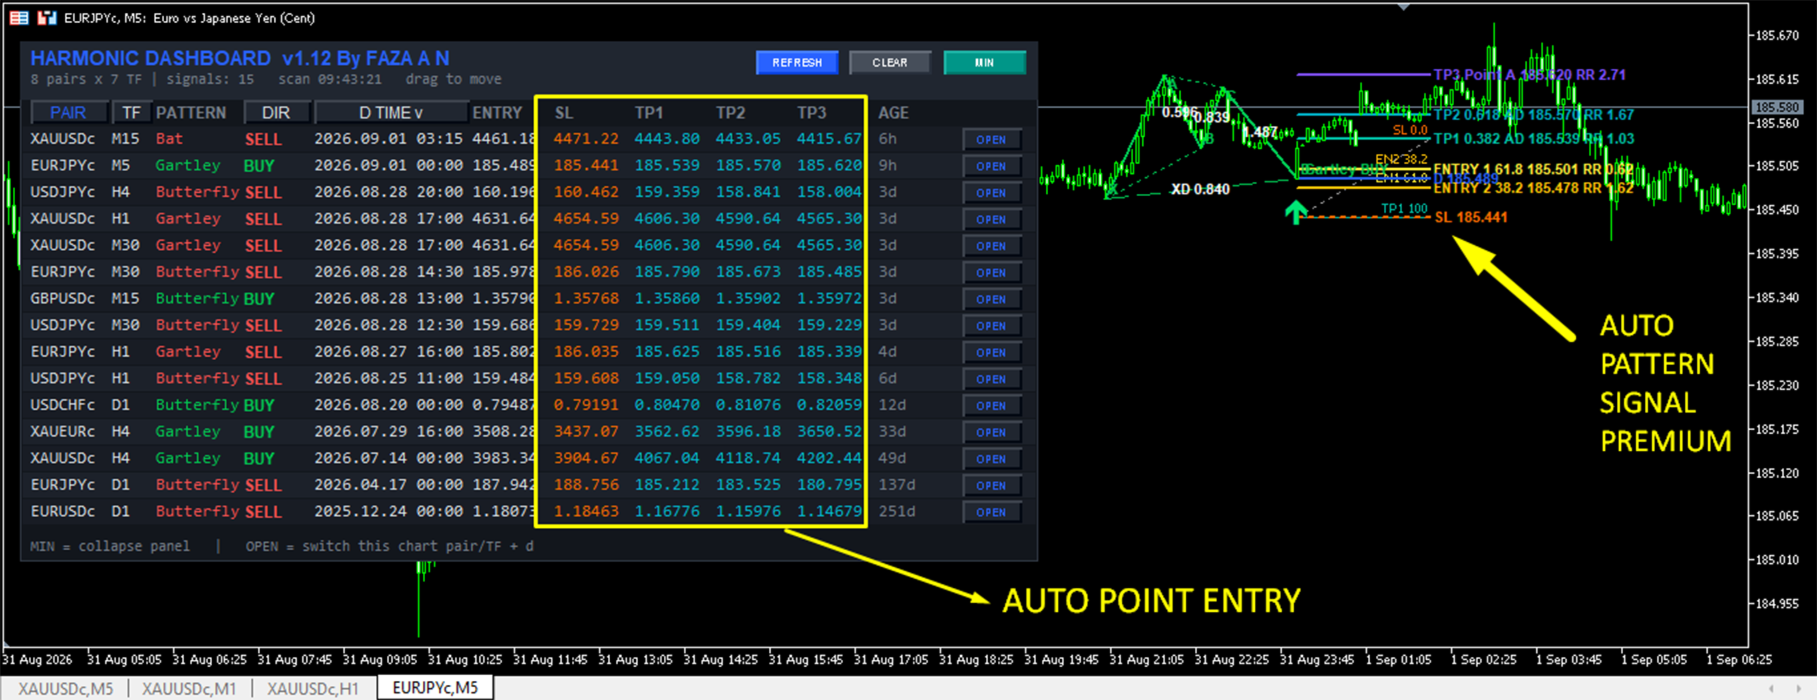
► 7) Built-in trade map
For every valid signal the dashboard calculates:
• ENTRY = point D
• SL = beyond X, or beyond D for extension patterns
• TP1 = 38.2% of AD
• TP2 = 61.8% of AD
• TP3 = 100% of AD (back toward point A)
► 8) Four optional trend filters (AND logic)
If more than one filter is ON, all enabled filters must pass.
• Single MA filter
• RSI filter (default period 75, direction uses the 50 line)
• Double MA filter (fast vs slow)
• RVI trend filter
► 9) Alert system
Popup, sound, and mobile push.
Optional “alert only new signals” so the same D point does not spam you.
► 10) Professional dashboard UI
Dark panel, color-coded BUY/SELL, scale %, column widths, drag to move, minimize, refresh, clear, click-to-sort, and ratio tooltips.
► 11) One-click chart jump
OPEN switches the current chart to that symbol and timeframe, then draws the harmonic.
► 12) Full chart drawing suite
XA-AB-BC-CD legs, helper lines, labels, optional box, arrows, ratio text, Fibonacci, extra ENTRY 1 / ENTRY 2 zones, SL and TP lines with RR text.
════════════════ WHY THIS IS A VALUE ADD ════════════════
★ Speed
Many markets and timeframes in one place. That is the main selling point.
★ Clarity
Each row is a mini-plan: pattern, direction, D time, entry, stop, three targets, and age.
★ Quality control
Filters can hide patterns that go against MA, RSI, dual MA, or RVI. Less counter-trend noise.
★ No fallback clutter
Only the latest pattern per pair/TF is used. If filters reject it, the row stays empty.
★ Visual confirmation
OPEN + drawing lets you verify geometry before you risk money.
★ Flexible layout
Scale, fonts, widths, colors, position, and minimize state can be tuned. Position is remembered.
★ Practical risk geometry
Extension patterns (Butterfly, Crab, Shark) use a stop beyond D plus a buffer.
Internal patterns use a stop beyond X plus a buffer.
Targets are measured from AD.
════════════════ PATTERN LOGIC ════════════════
The engine looks for 5 alternating swings: X, A, B, C, D.
► Bullish structure (BUY at D)
X below A, B below A, C above B, D below C, A above C.
If D is below X, the pattern is treated as an extension type.
► Bearish structure (SELL at D)
The mirror of the bullish rules.
► Ratio checks (with your tolerance)
Gartley
• XAB near 0.618
• ABC in 0.382–0.886
• BCD in 1.13–1.618
• XAD near 0.786
• D not beyond X
Bat
• XAB in 0.382–0.50
• ABC in 0.382–0.886
• BCD in 1.618–2.618
• XAD near 0.886
• D not beyond X
Cypher
• XAB in 0.382–0.618
• XAC in 1.13–1.414
• XCD near 0.786
• D not beyond X
Butterfly
• XAB near 0.786
• ABC in 0.382–0.886
• BCD in 1.618–2.24
• XAD in 1.272–1.618
• D beyond X
Crab
• XAB in 0.382–0.618
• ABC in 0.382–0.886
• BCD in 2.24–3.618
• XAD near 1.618
• D beyond X
Shark
• XAB in 1.13–1.618
• ABC in 1.13–1.618
• XAD in 0.886–1.13
• Checked in both internal and extension branches
► Tolerance
InpTol = 0.15 means about 15% room around a target or range.
0.08 is closer to textbook harmonic.
Start at 0.08–0.12 if you want quality first.
════════════════ STOP LOSS AND TAKE PROFIT ════════════════
XA = distance from X to A
AD = distance from A to D
Buffer = XA * SL buffer (default 0.15)
► Internal patterns (Gartley, Bat, Cypher)
BUY SL = X minus buffer
SELL SL = X plus buffer
► Extension patterns (Butterfly, Crab, Shark)
BUY SL = D minus buffer
SELL SL = D plus buffer
► Targets from point D using AD
TP1 = 0.382 AD
TP2 = 0.618 AD
TP3 = 1.000 AD
► Extra planning prices when Fibonacci drawing is ON
ENTRY 1 = 61.8% of the SL–TP1 span
ENTRY 2 = 38.2% of the SL–TP1 span
RR text is printed next to those levels.
These extra entries are for traders who do not want the exact D print and prefer a pullback into the zone.
════════════════ DASHBOARD COLUMNS AND BUTTONS ════════════════
► Columns
PAIR = symbol
TF = timeframe name
PATTERN = Gartley / Bat / Butterfly / Crab / Cypher / Shark
DIR = BUY or SELL
D TIME = time of point D
ENTRY = price of D
SL = calculated stop
TP1 / TP2 / TP3 = calculated targets
AGE = how old point D is (s / m / h / d)
OPEN = switch chart + draw
► Header buttons
REFRESH = reload symbols, timeframes, filter handles, then rescan now
CLEAR = hide dashboard objects
MIN / MAX = collapse to a slim bar or expand the full table
► Sorting
Click PAIR, TF, DIR, or D TIME.
Click again to reverse order.
Default can start from Latest D time, newest on top.
► Drag
Click the title / header / status / drag area and move the panel.
X/Y position and minimized state are saved.
► Tooltip
Hover a row to see XD, XAB, ABC, BCD and the three TP prices.
► Status line
Shows pair count, TF count, number of signals, which filters are on, and last scan time.
════════════════ FILTERS IN DETAIL ════════════════
All enabled filters use AND.
Disabled filters are ignored.
If every filter is OFF, every valid harmonic can appear.
Filter values are read from the last closed bar (shift 1) to reduce flicker from the forming candle.
► 1) Single MA Filter
BUY needs last closed price above MA
SELL needs last closed price below MA
Use this as a simple trend or location filter.
► 2) RSI Filter (labeled RSI 75)
Default period is 75, but you can change it.
This is not an “RSI must be 75” trigger.
BUY needs RSI above 50
SELL needs RSI below 50
A long RSI period makes the 50-line slower and more regime-like.
► 3) Double MA Filter
BUY needs Fast MA above Slow MA
SELL needs Fast MA below Slow MA
Default idea in inputs: EMA 30 vs EMA 140.
► 4) RVI Trend Filter
BUY needs RVI above 0
SELL needs RVI below 0
Useful as a momentum / trend layer.
If a handle cannot be copied, that pair/TF fails the filter and will not show as a valid row.
► Suggested recipes
Cleaner swing signals : Double MA ON + RVI ON
Simple location filter : Single MA ON only
Regime + momentum : RSI period 75 ON + Double MA ON
Raw harmonics : all filters OFF, tolerance 0.08–0.10
════════════════ ALERTS ════════════════
✓ Popup Alert = MetaTrader alert window
✓ Sound Alert = plays alert.wav
✓ Push Alert = terminal notification (enable push in MT5 options first)
✓ Alert only new = if true, alert when D time is newer than the last alerted D for that pair/TF
If false, alert when D time changes compared with the stored value.
Alert text includes symbol, TF, pattern, BUY/SELL, D time, Entry, SL, TP1, TP2, TP3.
════════════════ CHART DRAWING ════════════════
When Draw HARMONIC pattern on this chart is true, the indicator searches the current symbol and current timeframe with the same rules as the scanner.
Drawn objects can include:
• Solid XA, AB, BC, CD
• Dotted XB, AC
• Dashed XD
• X A B C D labels
• Pattern name + BUY/SELL at D
• Optional filled box around the pattern
• Arrow at D
• Ratio labels on AB, BC, CD, and XD
• Fibonacci from SL toward TP1
• Horizontal ENTRY, SL, TP1, TP2, TP3 lines
• Extra ENTRY 1 (61.8) and ENTRY 2 (38.2) planning lines
Object prefixes
Dashboard objects : HMD_
Chart pattern : HARMONI_
InpShowZigZag exists as a display switch in inputs.
The working swing engine is the pivot routine used by the scanner and the chart drawer.
════════════════ FULL INPUT GUIDE ════════════════
Read this before you attach the indicator.
──────── SCANNER ────────
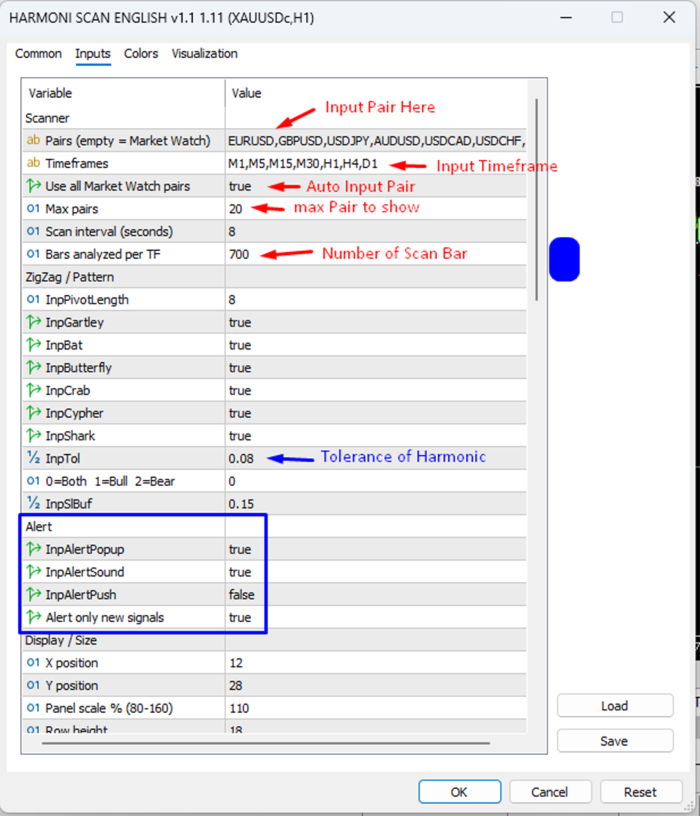
★ Pairs (InpSymbols)
Comma-separated symbols, example:
EURUSD,GBPUSD,USDJPY,AUDUSD,USDCAD,USDCHF,NZDUSD,EURJPY,GBPJPY,XAUUSD
Spaces are removed.
You may also separate with ; or |
If this field is empty, Market Watch mode is used.
★ Timeframes (InpTimeframes)
Example: M1,M5,M15,M30,H1,H4,D1
Supported names include M1–M30 variants, H1–H12, D1, W1, MN.
Invalid names are skipped.
If nothing valid remains, the code falls back to M15, M30, H1, H4, D1.
★ Use all Market Watch pairs (InpUseWatch)
true = take symbols from Market Watch, up to Max pairs
false = use the Pairs list (unless that list is empty)
★ Max pairs (InpMaxSymbols)
Hard cap for how many symbols are loaded.
Higher values = heavier scan.
★ Scan interval, seconds (InpScanSec)
Timer interval for a full rescan.
Minimum used by the code is 3 seconds.
5 seconds is a good starting point.
Very low values on many symbols/TFs can load the terminal.
★ Bars analyzed per TF (InpBarsCopy)
How many bars are copied for pivot and pattern search.
Default 150.
Too low = not enough swings.
Too high = more CPU.
──────── ZIGZAG / PATTERN ────────
★ Pivot Length (InpPivotLength)
Bars left and right required to confirm a pivot.
Default 2.
Higher = fewer, larger swings, fewer patterns, usually cleaner.
Lower = more swings, more patterns, more noise.
★ Gartley / Bat / Butterfly / Crab / Cypher / Shark
Master switches.
Turn OFF patterns you do not trade.
★ Tolerance (InpTol)
Ratio flexibility.
0.08 = stricter / more classic
0.15 = default, more detections
★ Direction (InpDirection)
0 = Both
1 = Bull only (BUY)
2 = Bear only (SELL)
★ SL buffer (InpSlBuf)
Fraction of XA added beyond the SL anchor.
Default 0.15.
Larger buffer = wider stop, fewer wick-outs, worse raw RR.
──────── SINGLE MA FILTER ────────
★ Enable Single MA filter (Use_MA_Filter)
★ MA period (MA_Period) default 50
★ MA method (MA_Method) SMA / EMA / SMMA / LWMA
★ MA applied price (MA_Applied) usually Close
★ MA shift (MA_Shift) default 0
Rule:
BUY if close[1] > MA[1]
SELL if close[1] < MA[1]
──────── RSI FILTER ────────
★ Enable RSI 75 filter (Use_RSI75_Filter)
★ RSI period (RSI_Filter_Period) default 75
★ RSI applied price (RSI_Price_Source) usually Close
Rule:
BUY if RSI[1] > 50
SELL if RSI[1] < 50
The name “RSI 75” refers to the default lookback, not a 75 overbought trigger.
──────── DOUBLE MA FILTER ────────
★ Enable Double MA filter (Use_DoubleMA_Filter)
★ Fast MA period / method / price / shift default EMA 30 Close
★ Slow MA period / method / price / shift default EMA 140 Close
Rule:
BUY if Fast[1] > Slow[1]
SELL if Fast[1] < Slow[1]
──────── RVI TREND FILTER ────────
★ Enable RVI trend filter (Use_RVI_Filter)
★ RVI period (RVI_Period) default 75
Rule:
BUY if RVI[1] > 0
SELL if RVI[1] < 0
──────── ALERT ────────
★ Alert popup (InpAlertPopup)
★ Alert sound (InpAlertSound)
★ Alert push (InpAlertPush)
★ Alert only new signals (InpAlertOnlyNew)
Turn push ON only after MetaTrader notifications are configured on your phone.
──────── DISPLAY / SIZE ────────
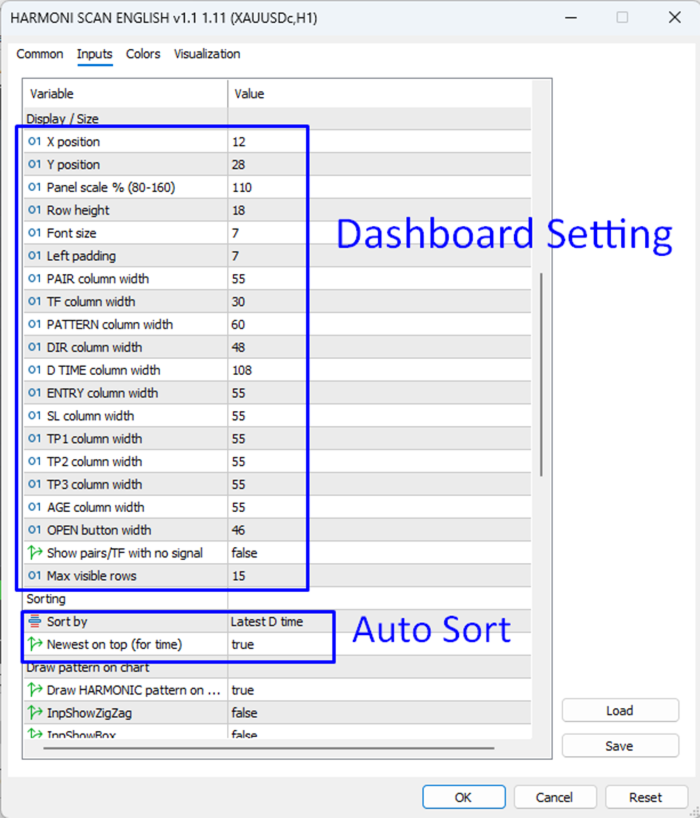
★ X position / Y position
Starting coordinates.
Later overridden by saved drag position if present.
★ Panel scale % (InpScale)
Default 110.
Clamped around 70–180 in the scaler.
Use this if the panel is too small or too large on your screen.
★ Row height / Font size / Left padding
Control table density.
★ Column widths
PAIR, TF, PATTERN, DIR, D TIME, ENTRY, SL, TP1, TP2, TP3, AGE, OPEN
Increase a column if text is clipped on your screen.
★ Show pairs/TF with no signal (InpShowEmpty)
false = only valid, filter-passed rows (recommended)
true = also list empty pair/TF slots
★ Max visible rows (InpMaxRows)
Default 17.
Extra signals can exist in memory but are not drawn beyond this cap after sorting.
──────── SORTING ────────
★ Sort by (InpSortBy)
0 Latest D time
1 Pair name
2 Timeframe
3 Direction (BUY first or SELL first, depending on the newest flag)
★ Newest on top (InpSortNewest)
For time sort, true puts the newest D at the top.
──────── DRAW PATTERN ON CHART ────────
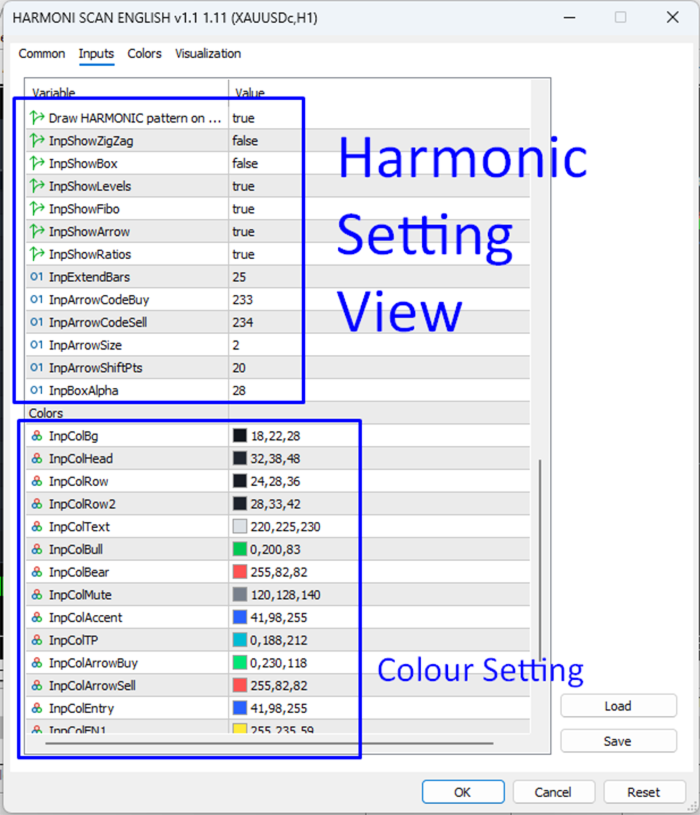
★ Draw HARMONIC pattern on this chart (InpDrawOnChart)
Master switch for current-chart geometry.
★ Show ZigZag (InpShowZigZag)
Display option in the Draw group.
★ Show box (InpShowBox)
Semi-transparent rectangle around X..D.
★ Show levels (InpShowLevels)
ENTRY / SL / TP1 / TP2 / TP3 lines and labels.
★ Show Fibo (InpShowFibo)
Fibonacci tool plus ENTRY 1 / ENTRY 2 planning lines.
★ Show arrow (InpShowArrow)
Arrow at point D.
★ Show ratios (InpShowRatios)
Prints XAB, ABC, BCD, XD on the legs.
★ Extend bars (InpExtendBars)
How far level lines continue to the right.
★ Arrow code buy / sell, arrow size, arrow shift points
Visual tuning for the D marker.
★ Box alpha
Transparency of the optional pattern box.
──────── COLORS ────────
Full color set for background, header, rows, text, bull, bear, muted text, accent, TPs, arrows, entry, extra entries, fibo, SL, TP1, TP2, TP3.
Change these to match your chart theme.
They do not change pattern math.
════════════════ RECOMMENDED FIRST SETUP ════════════════
- Attach the indicator to any MT5 chart.
- No extra DLL is required.
- Keep the default pair list, or set Use all Market Watch pairs = true and Max pairs = 8–12.
- Start with timeframes M15,M30,H1,H4 if your PC is average. Add M1/M5 later.
- Set Pivot Length = 2 or 3.
- Set Tolerance = 0.10 if you want fewer but cleaner patterns.
- Enable only the patterns you actually trade.
- Keep all filters OFF for the first day so you learn how the table looks.
- Then enable Double MA or RVI if you want fewer counter-trend rows.
- Turn Draw on chart = true, Show levels = true, Show ratios = true.
- When a row looks good, press OPEN and inspect the geometry before any order.
- Use REFRESH after you change Market Watch or input lists.
► Performance tips
• Fewer symbols and timeframes = smoother terminal
• Bars analyzed 120–200 is enough for most day/swing use
• Scan interval 5–15 seconds is plenty
• Do not enable every filter plus every TF plus 30 pairs on a weak VPS
════════════════ HOW TO READ A SIGNAL ════════════════
Example row:
XAUUSD | H1 | Bat | BUY | D time | Entry | SL | TP1 | TP2 | TP3 | Age
Meaning:
• Gold on H1 printed a bullish Bat
• Point D is the listed Entry
• SL is already buffered
• TP1/TP2/TP3 are AD projections
• Age tells you whether D is fresh or old
Before trading, check:
✓ Spread and session
✓ Whether price already ran through TP1
✓ Whether D is still near the PRZ
✓ Whether your filter regime still matches
✓ Whether the drawn ratios look acceptable at your tolerance
A completed harmonic is a location, not a guaranteed reversal.
════════════════ INSTALL AND COMPATIBILITY ════════════════
✓ MetaTrader 5 only
✓ Attach to one chart; the dashboard can still scan other symbols
✓ Symbols must be visible / selectable in Market Watch for reliable quotes
✓ Works on FX, gold, and other symbols that provide normal OHLC
✓ Uses standard MT5 indicators: iMA, iRSI, iRVI
✓ Uses timer + chart events for scan, drag, and buttons
✓ Saves minimize state and panel X/Y in global variables:
HMD_MINIMIZED
HMD_POS_X
HMD_POS_Y
Remove / reattach if you change broker symbol suffixes and the pair list no longer matches.
════════════════ LIMITATIONS ════════════════
• This is not an Expert Advisor. It does not open, manage, or close orders.
• Harmonic recognition depends on pivot length and tolerance. Two settings can show different names or no pattern.
• The engine reports the latest matching structure, not every historical pattern on the chart.
• Filters can hide a geometrically valid pattern. That is intended.
• Results depend on broker quotes, holidays, gaps, and available history.
• Past pattern shapes do not guarantee future profit.
• Always test on demo and confirm the drawing matches your own harmonic rules.
════════════════ IDEAL WORKFLOW ════════════════
Watch the dashboard on a spare chart.
When a fresh BUY/SELL appears and filters agree, press OPEN.
Confirm XABCD, ratios, and SL/TP on candles.
Decide cash risk from SL distance, not from hope.
If price has already left D by a large amount, treat it as late and skip.
Use CLEAR if you need a clean screen.
Use MIN when you want price action first and the table later.
════════════════ KEYWORDS ════════════════
harmonic pattern scanner, harmonic dashboard, multi timeframe harmonic, multi pair scanner, Gartley, Bat, Butterfly, Crab, Cypher, Shark, XABCD, PRZ, Fibonacci harmonic, MT5 indicator, gold XAUUSD harmonic, forex pattern scanner, MA filter, RSI filter, RVI filter, entry SL TP dashboard
════════════════ THANKS ════════════════
Thank you for using Harmonic Dashboard.
Trade the geometry, respect the stop, and stay selective.