Trade Risk Desk

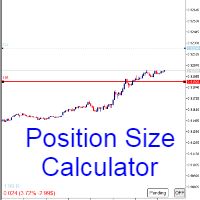
Trade Risk Desk answers one question at the moment you need it answered: what volume makes this stop cost exactly what you decided to risk. Drag the stop line to where it belongs on the chart and the panel prints the volume, the money behind it, and the margin the position will hold.

What It Answers

Set the risk as a percent of balance or as a fixed amount in account currency. Put the stop where your idea says it belongs. The panel reads the symbol settings your broker publishes and prints:

  • the volume the broker will accept, next to the raw calculated one
  • what the stop costs in account currency and in percent of the balance
  • the margin the position will hold, and its share of your free margin
  • the broker's minimum distance for a stop, in points
  • price levels for the first R multiples

Every figure comes from the symbol settings your terminal already holds, so they match the account you are looking at rather than a generic table.

The Two Lines

Two horizontal lines carry the trade. The entry line follows the market price, or stays where you put it when you plan an entry ahead of time. The stop line is yours to drag, and the panel recalculates the moment you drop it.

Dragging the stop across the entry switches the panel between a long and a short, so one setup covers both directions without a second input.

What Goes Into The Cost

The stop distance is only part of what a losing trade costs. The spread is paid on the way in and the commission is paid on both sides, so both come out of the risk budget rather than sitting outside it.

Enter your commission per lot for the round turn and it is added to the cost of one lot. Leave IncludeSpreadInRisk on and the current spread joins it. The line marked cost per lot shows the sum, and it is the number the volume is divided by.

The Volume Your Broker Will Accept

A calculated volume of 0.4856 lots is not something you can send. The panel rounds it down to the broker's volume step, never up: rounding up would spend more than the risk you set. Both figures stay on screen, so the size of the rounding is visible rather than hidden.

The result is capped at the broker's maximum. Below the broker's minimum lot there is nothing to round to, so instead of a volume the panel prints what that minimum lot would put on this stop, and the decision is made on a number rather than on a blank. When the volume reaches the ceiling, the risk line says so in place of quietly showing a figure larger than your budget.

Margin And The Minimum Stop Distance

Margin is computed from what the symbol publishes: the initial margin per lot when your broker gives it in your account currency, otherwise contract size and price handled by the symbol's own calculation mode, with leverage where that mode uses leverage and without it where it does not. The rate is taken for the side you are trading. When the figures come out, the line shows the amount and the share of your free margin it takes; for a symbol priced in a currency other than the one your account is held in, that line stays out rather than carrying a converted guess.

Brokers also set a minimum distance for a stop, and an order with a closer stop is rejected. That distance is printed in points next to your own, and the line turns red when your stop is inside it, which is cheaper to see here than in a rejection message.

R Multiples

The panel prints price levels for the first R multiples of the trade along with what each one is worth in account currency at the accepted volume. Set how many you want to see, up to ten.

Reading The Figures From An Expert Advisor

Five values are published as indicator buffers and are available through iCustom: accepted volume (0), risk at the stop (1), cost per lot (2), margin (3), and a status code (4). The inputs carry no grouping headers, so the parameters you pass to iCustom line up with the list above them one to one, in the order printed below. The status code is zero when the figures are valid, and otherwise names the reason: no tick value from the broker, stop on the entry price, zero risk budget, zero cost per lot, or risk below one minimum lot.

Input Parameters

  • RiskMode - risk as a percent of balance or as a fixed amount
  • RiskPercent, RiskMoney - the risk budget itself
  • RiskFromEquity - take the percent from equity instead of balance
  • EntryMode - entry at market price or from the line
  • StopMode - stop from the draggable line or a fixed distance in points
  • StopPoints - stop distance for the fixed mode
  • IncludeSpreadInRisk - take the current spread out of the risk budget
  • CommissionPerLotRoundTurn - commission per lot, round turn
  • TargetsToShow - how many R multiples to print
  • ShowPanel, PanelCorner, PanelXOffset, PanelYOffset, PanelFontSize
  • ColorGood, ColorWarn, ColorNeutral, ColorEntryLine, ColorStopLine
  • ObjectPrefix - name prefix that separates this copy's lines and labels from another one

Requirements

The platform is MetaTrader 5, and the panel needs an account the terminal is logged into, because volume step, margin rate and the minimum stop distance are account and symbol properties rather than platform constants. Any symbol and any timeframe: nothing here is read from bars. Two copies can sit on one chart with different risk settings, each keeping its own lines, as long as each one gets its own ObjectPrefix. No orders are placed, and no order is ever modified.

Support

Ask in the comments of this product. Useful things to include: the symbol, your broker, and the line you think is wrong, because margin modes and stop levels differ between brokers and the answer usually lives in those three facts.

推荐产品
Donchian Breakout And Rsi
Mattia Impicciatore
4.33 (3)
概述 本指标是经典 Donchian 通道 的增强版,增加了多种实用的交易功能。 除了标准的三条线(最高、最低和中线),系统能够检测 突破 ,并在图表上用箭头进行可视化标记,同时只显示 与当前趋势方向相反的那条线 ,让图表更加简洁。 功能包括: 可视化信号 :突破时在图表上绘制彩色箭头 自动通知 :弹窗、Push 推送和 Email 邮件 RSI 过滤 :根据市场相对强弱验证信号 个性化设置 :颜色、线条粗细、箭头符号、RSI 阈值等 工作原理 Donchian 通道计算: 上轨线 :最近 N 根已收盘 K 线的最高价 下轨线 :最近 N 根已收盘 K 线的最低价 中线 :最高价和最低价的平均值 看涨突破 :收盘价高于上轨线 看跌突破 :收盘价低于下轨线 指标会: 绘制三条 Donchian 通道线 仅在 方向变化后的首次突破 绘制箭头 隐藏顺应趋势方向的那条线(上涨趋势: 只显示红色下轨线;下跌趋势: 只显示绿色上轨线) 可选用 RSI 过滤突破信号,减少虚假突破 支持实时发送通知 参数说明 Donchian 通道设置 indPeriod :计算通道高低点的已收盘 K 线数量 Lin
FREE
Important Lines
Terence Gronowski
4.88 (24)
This indicator displays Pivot-Lines, preday high and low, preday close and the minimum and maximum of the previous hour. You just have to put this single indicator to the chart to have all these important lines, no need to setup many single indicators. Why certain lines are important Preday high and low : These are watched by traders who trade in a daily chart. Very often, if price climbs over or falls under a preday low/high there is an acceleration in buying/selling. It is a breakout out of a
FREE
FiT Panel Pro
Thonglak Janyakorn
Overview FiT Panel Pro is a professional-grade trade management panel designed for MetaTrader 5 traders who demand speed, precision, and full control over their trades. Built with a modern dark-theme UI, it combines one-click execution with advanced risk management, visual SL/TP drag lines, automatic Fibonacci-based levels, and comprehensive order management — all in a single, compact panel. Whether you are a scalper, day trader, or swing trader, FiT Panel Pro gives you the edge you need to exec
FREE
JT360 DNA Mini PnL Pointer V1.04 Public Компактно. Наглядно. Всегда перед глазами. JT360 DNA Mini PnL Pointer — это лёгкий индикатор для MetaTrader 5, который отображает суммарную текущую прибыль или убыток по всем открытым позициям текущего символа графика. Компактная индикация непосредственно на графике объединяет PnL относительно первоначального риска в формате R, тонкую мини-полоску и настраиваемую цветовую матрицу. Фирменные цвета JT360 — бирюзовый и пурпурный — выделяют крайние значения и
FREE
Trade Behavior Mirror 只读取您自己账户中已经平仓的交易历史,并且只统计一种具体行为:在一次已确认的亏损之后不久,以高于自己平常水平的手数开出新仓位。这个工具不做任何预测,也不给出任何建议。面板上出现的每一个数字,都是这个账户上已经发生过的事实。 数字是这样算出来的:它读取所有品种、所有魔术号在内的最多31天已平仓交易 —— 这是整个账户的画面,而不只是当前图表所在品种的画面。从今天之前的30天里,它计算每天新开仓笔数的中位数,以及这些开仓手数的中位数。之所以用中位数而不是平均值,是为了不让某一笔异常大的交易拉偏整体基准。如果这30天窗口内的开仓不足5笔,历史数据就不足以建立一个公平的基准,面板会显示"Collecting history",而不是用过少的数据硬凑出一个数字。 核心统计,即面板上的 Entries within 10min of a loss, at above-median lot: 一行:对每一次新开仓,它都会检查前10分钟内是否有一笔亏损被确认平仓,以及这次开仓的手数是否高于30天中位数。符合条件的次数会分别按 Today 和 Last 7
FREE
Ninja Trend Matrix MT5 Ninja Trend Matrix MT5是一款MetaTrader 5指标,将多个时间周期的趋势方向、相对强度和基于ATR的波动状态集中显示在一个面板中。它可用于在进行主观判断或使用其他交易系统之前,快速了解当前市场环境。 本指标不会开仓、修改订单或平仓,也不显示入场箭头、止盈、止损、胜率或利润预测。 主要功能 将每个选定周期分类为 STRONG UP、UP、RANGE、DOWN、STRONG DOWN 或 N/A 显示0至100的相对趋势强度 基于ATR显示 LOW、NORMAL、HIGH 或 SHOCK 波动状态 综合EMA 20/50、EMA斜率、近期高低点结构、ADX和+DI/-DI 使用已收盘K线,而不是当前尚未收盘的K线 面板可直接拖动、最小化、自动布局并支持紧凑网格 时间周期 DEFAULT显示M5、M15、H1、H4和D1。CUSTOM可输入逗号分隔的列表,例如M1,M5,M30,H1,W1,MN1。ALL显示从M1到MN1的全部21个MT5标准时间周期。 综合状态与提醒 面板汇总显示 BULLISH ALIGNMENT
FREE
Free automatic Fibonacci is an indicator that automatically plots a Fibonacci retracement based on the number of bars you select on the BarsToScan setting in the indicator. The Fibonacci is automatically updated in real time as new highest and lowest values appears amongst the selected bars. You can select which level values to be displayed in the indicator settings. You can also select the color of the levels thus enabling the trader to be able to attach the indicator several times with differe
FREE
Position Selective Close MT5
Francisco Manuel Vicente Berardo
The Position Selective Close is a multi-symbol multi-timeframe script used to close simultaneously various positions.  General Description   The Position Selective Close   possesses   three operation modes (Intersection,   Union   and All) that control the way   as   four position features (symbol, magic number,   type   and profit) are used. The modes, available through the Selection Mode input parameter, relate to the features, available through the “Select by Feature” and “Feature” input pa
FREE
Coral Indi
Dinh Duong Luong
Coral trend is   a trend-following indicator that is widely popular among FOREX traders . It is usually used as a confluence with other indicators. It uses combinations of moving averages with complex smoothing formulas! It has two configurable parameters: Coefficient   - smoothing ratio (*) Applied price Calculation: Coral = (-0.064) * B6 + 0.672 * B5 - 2.352 * B4 + 2.744 * B3
FREE
Your chart. One glance. Total clarity. Built by @Ash_TheTrader for traders who are tired of guessing, Extreme Trading Dashboard is a professional-grade heads-up display that sits quietly in the corner of your chart — dark charcoal, rounded, semi-transparent, and genuinely easy on the eyes — until the moment it matters. Dual Session Highlighter Shade up to two independent time windows directly on your chart — London, New York, or your own custom kill-zone. Each gets its own color, so overlapp
FREE
More Advanced version is available as  QuantView AnalyticsPro  at  https://www.mql5.com/en/market/product/205251 with a limited time offer of $50 for lifetime license. =========================================================================================================================================================== QuantView Analytics Master Advanced On-Chart Portfolio Diagnostics & Equity Forensics for MetaTrader 5 Standard MT5 history reports simply show you how much money was made o
FREE
手动管理持仓往往容易导致错过出场时机、情绪化犹豫以及持仓缺乏风控保护。 Trade Manager Lite 是一款专为 MetaTrader 5 设计的高效持仓管理工具,旨在全自动执行止损(Stop Loss)、止盈(Take Profit)、保本(Break-Even)、移动止损(Trailing Stop)以及分批平仓(Partial Close)。 无论您是通过电脑桌面手动下单、手机版 MT5 远程开仓,还是借助外部指标进场,Trade Manager Lite 都能即时捕捉未受保护的订单,并根据预设的点数自动施加风险防护。 核心功能特性(免费版) 全自动补齐 SL & TP: 实时扫描并检测无保护的持仓,根据您设定的点数自动添加止损与止盈。 智能自动保本(Break-Even): 当订单浮盈达到设定点数时,自动将止损移至开仓价,并支持设置额外缓冲点数以抵消点差和手续费。 动态移动止损(Trailing Stop): 随着行情朝有利方向推进,以设定的步进点数自动跟进移动止损,牢牢锁定浮动利润。 自动化分批平仓(Partial Close): 当达到指定利润目标时,自动平掉指定比
FREE
DF Fib Trader Pro DF Fib Trader Pro 是一款專為 MetaTrader 5 設計的自動交易系統。 它使用基於斐波那契的價格水平,結合趨勢和結構分析來定義入場點和出場點。此 EA 支援多頭和空頭部位,並內建風險管理參數。 核心功能: • 使用斐波那契回檔和擴展邏輯來繪製入場點、停損點和獲利點。 • 可設定交易手數和停損/獲利水平 • 可選擇 1 或 2 個入場點 • 根據市場情況支持固定或動態停損和獲利 • 適用於多種時間範圍和貨幣對 • 包含最大點差、滑點和交易頻率控制選項 • 自動交易管理:損益兩平、追蹤停損與部分平倉選項 • 如有需要,支持市價單。 輸入概覽: • 風險管理:交易手數、單筆交易風險、最大交易數量 • 入場條件:斐波那契水平選擇、趨勢過濾選項 • 出場管理:停損/停盈類型、追蹤停損設定、損益平衡參數 • 交易過濾:價差限制、滑點容忍度 基本規則 • 點擊“繪製斐波那契”,並根據您的需求繪製斐波那契框。 • 您選擇的斐波那契程度會顯示出來(完全可設定) • 點擊“執行斐波那契”,即可立即建立掛單以及停損和止盈 • 設定完畢後,讓PA
FREE
Aurum Pivot Point Breakout Free 是一款适用于 MetaTrader 5 的免费突破型 Expert Advisor。它使用止损单交易经典每日枢轴点 R1 和 S1 水平的突破,并采用基于 ATR 的止损和移动止盈退出。 仓位大小为当前余额的固定百分比,因此手数随账户资金增长或缩减。 逻辑 根据前一日数据计算经典地板枢轴点(P、R1、S1)。 在 R1 上方放置买入止损单,在 S1 下方放置卖出止损单。 每个水平仅交易一次;订单当日到期失效。 初始止损为 0.6 x 每日 ATR;随后启用 2.0 x ATR 的移动止损。 若持仓超过 240 小时仍未平仓,则强制关闭。 手数 = 风险占余额的 1%,从而实现复利效应。 默认输入参数 每笔交易风险:余额的 1.0% 水平时间框架:D1 枢轴类型:经典 R1 / S1 初始止损:0.6 x 每日 ATR 退出方式:移动止损 退出距离:2.0 x 每日 ATR 最大持仓时间:240 小时 入场偏移量:0.03 x 每日 ATR 每日 ATR 周期:14 最大点差:0.05 x 每日 ATR Magic numb
FREE
价格在区间的哪个位置——溢价区、折价区,还是在 OTE 区?本指标为您画出来、发出提醒,并在您自己的图表上检验价格之后的走势。 ICT Premium Discount OTE Honest Stats 画出当前的交易区间(dealing range),包括溢价区、折价区、平衡点(50%)以及最优交易入场区(OTE,62–79%),在价格到达 OTE 区时提醒您,并在该图表自身的历史上统计价格随后顺着该波段继续运行的频率,与随机K线对比。免费,Honest Stats 系列之一。 MT4 版本 | Order Blocks(免费) | Market Structure(免费) | Killzones(免费) | FVG(免费) | Liquidity Levels(免费) | SMT(免费) 新品(免费):反转公允价值缺口(IFVG),附回测信号和提醒 -> ICT Inversion FVG Honest Stats (被价格收盘穿越的缺口,回测箭头,同样的诚实统计表) 新品(免费):Silver Bullet 时间窗口,附扫荡 + FVG 信号和提醒 -> ICT Silver B
FREE
Daily Support and Resistance Levels 是一款专业指标,基于经典枢轴点方法自动计算并显示日内交易关键价格水平。 主要功能: 自动计算枢轴点(PP) 三个阻力位(R1, R2, R3) 三个支撑位(S1, S2, S3) 显示前一天高点/低点 实时信息面板 市场趋势方向(多头/空头)提示 显示与最近价格水平的距离 完全自定义颜色与样式 每日自动更新 支持所有周期 计算方法:基于昨日最高价、最低价、收盘价的经典枢轴点算法。 交易用途: 支撑/阻力反弹交易 突破策略 区间震荡交易 市场方向判断 盈利目标设置 使用方法: 将指标加载到图表 自动生成水平线 价格 > PP = 多头倾向 价格 < PP = 空头倾向 S1-S3 = 支撑区域 R1-R3 = 阻力区域 自定义设置: 枢轴点/支撑/阻力颜色 线条宽度与样式 显示/隐藏价格标签 显示/隐藏信息面板 面板位置与字体大小 显示/隐藏前日高低点 优点: 专业界面 无重绘 资源占用低 支持所有经纪商 适合剥头皮与日内交易 免费用于展示我的MQL5能力 如果喜欢,请留下评价。
FREE
RiskCockpit - real-time risk advisor for prop-firm and funded accounts (FundedNext, FTMO, E8, The5ers, MyFundedFX) and personal/demo accounts. It is an INDICATOR (an advisor): it shows and proposes; it never opens, modifies or closes a trade. THE PROBLEM IT SOLVES Funded accounts are rarely lost to a bad strategy - they are lost to a single careless click: one lot too big, a stop-loss left off, a trade inside a news window, a daily-loss line crossed by accident. The rules sit in a PDF; your ris
FREE
RSI abcd
Francisco Gomes Da Silva
3.75 (4)
RSI ABCD形态查找器:技术策略 1. 指标工作原理 结合 经典RSI 与自动检测 ABCD谐波形态 。 主要组件 标准RSI (可调周期) 高低点标记 (箭头) ABCD形态 (绿/红线) 超买(70)和超卖(30)过滤器 2. MT5设置 period = 14 ; // RSI周期 size = 4 ; // 最大形态尺寸 OverBought = 70 ; // 超买水平 OverSold = 30 ; // 超卖水平 Filter = USE_FILTER_ YES ; // 确认过滤器 3. 交易策略 3.1. 买入信号(看涨ABCD) 条件: RSI形成: 低点( A ) → 高点( B ) → 更高低点( C ) D 高于超卖区(30)但低于 C 确认:绿色连线A-B-C-D 目标: TP1: B-C的61.8% TP2: B-C的100% 止损: 低于 D 3.2. 卖出信号(看跌ABCD) 条件: RSI形成: 高点( A ) → 低点( B ) → 更低高点( C ) D 低于超买区(70)但高于 C 确认:红色连线A-B-C-D 目标: TP1: B-C的6
FREE
KS Fibonacci Tool
Kulvinder Singh
KS Fibonacci Tool 是一款专为 MetaTrader 5 平台设计的自定义指标,旨在自动识别当前的“聪明钱概念”(SMC)市场结构波段(leg),并实时绘制相应的斐波那契水平线。 核心用途 该指标帮助交易者基于最近一次显著的价格波动(结构波段)直观地查看斐波那契回调和扩展水平,这是 ICT/SMC 交易方法论中的常用手段。 主要功能 自动识别市场结构: 通过追踪波段高点和低点来识别看涨和看跌波段。 支持根据K线实体或K线影线(可配置)来检测结构突破。 实时记录并维护当前结构的高点和低点。 可视化元素: 绘制两条水平线,分别代表当前结构的高点和低点(默认颜色为蓝色)。 在当前波段上绘制最多 5 个可自定义的斐波那契水平线: 默认水平:-0.25、0.0、0.5、1.0、1.25 每个水平线均可独立设置颜色、线型和线宽。 动态特性: 随价格变动实时更新。 当发生结构突破时,指标会自动重置,并针对新波段重新开始绘制斐波那契水平线。 标签同时显示斐波那契比率和精确的价格水平。
FREE
Exp Assistant 5
Vladislav Andruschenko
4.77 (127)
自动设置、止损、止盈、追踪止损、盈亏平衡水平,实现 虚拟 止损和止盈。 经验助理 将帮助您组织职位维护。 该程序(EA 交易)旨在自动设置 真实或虚拟   交易时您的仓位的 止损和止盈 水平。 您可以从图表上的控制面板轻松管理 EA 交易的所有操作。 如果您在为未平仓头寸设置止损、止盈、 追踪止损 或 盈亏平衡 时遇到任何困难 ,或者如果您更喜欢手动交易,您可以使用助手。 它将自动执行必要的操作,例如为您的交易设置止损和获利、打开追踪止损以及在需要时将止损移至盈亏平衡。 该助手还具有基于 抛物线 Sar 指标的追踪止损功能。 MT4 版本 详细描述 +DEMO +PDF 如何购买 如何安装     如何获取日志文件     如何测试和优化     Expforex 的所有产品 我们的助手的9个主要功能: 打开买入卖出; 止损/止盈集; 设置追踪止损; 一套收支平衡; 抛物线追踪止损; 虚拟止损和止盈; 虚拟栏杆止损和盈亏平衡; 显示当前柱的结束时间; 显示有关帐户的有用信息; 对于实时图表上的一键交易,您可以下载实用程序 VirtualTradePad for MetaTrade
FREE
Signalator Lot Size Evaluator MT5 是一款免费的本地 MetaTrader 5 工具,专为希望在手动下单前估算交易手数的交易者设计。 您可以根据所选交易品种、BUY 或 SELL 方向、计划入场价格、Stop Loss、可选 Take Profit 以及风险百分比来规划交易。计算器结合当前账户信息和经纪商提供的交易品种规格,估算建议手数以及主要风险数据。 使用流程非常简单:定义交易参数 → 选择账户风险水平 → 查看建议手数和经纪商交易条件 → 如果交易设置合适,再手动执行交易。 Signalator Lot Size Evaluator MT5 是 Signalator Trading and Analysis Ecosystem 的一部分。这是一个不断扩展的实用 MetaTrader 工具系列,涵盖交易准备、交易品种与经纪商分析、账户监控、持仓管理以及日常交易工作流程优化。 Lot Size Evaluator 可以作为独立的专用工具使用,适合只需要在交易前进行仓位大小和风险计算的交易者。相同的功能也已经集成到功能更全面的 Signalator Tr
FREE
Binary Profit Gainer
Myo Min Aung
5 (2)
This indicator is especially for the binary trading. Time frame is 1 minutes and exp time 5 or 3 minutes only. You must be use martingale 3 step. So you must put lots size is 10 % at most. You should use Mt2 trading platform to connect with my indicator to get more signal without human working. This indicator wining rate is over 80% but you may get 100% of profit by using martingale 3 step. You should use MT2 Trading Platform to connect meta trader platform and binary platform . You can get mt2
FREE
Calculating the volume of orders every time you create an order is an extremely important thing in risk management Let this tool simplify your work! ----------------------------------------------------- How to use? Attach the indicator to the chart and set its parameters:  Risk size in %  or money and Risk Reward Ratio. Click on the ON button and locate the horizontal line to your would-be StopLoss level. Options: Click on the Pending/Instant button to locate the horizontal line  to your would-b
FREE
Session Profiles
Basharat Umar Khan
Short Description Draws rolling Time-Price-Opportunity (TPO) and footprint volume profiles for the Asia, London, and New York sessions with POC/VAH/VAL levels, delta volume bias, order flow overlays, liquidity heatmaps, developing rolling lines, Naked POC (NPOC) tracking, Initial Balance breakouts, multi-session confluence zones, and automatic broker GMT-offset detection. Full Description Plots separate market-profile and volume-profile style histograms for the three major trading sessions (Asi
FREE
Automatic fibonacci with alerts is an indicator that automatically plots a fibonacci retracement based on the number of bars you select on the BarsToScan setting in the indicator. The fibonacci is automatically updated in real time as new highest and lowest values appear amongst the selected bars. You can select which level values to be displayed in the indicator settings. You can also select the color of the levels thus enabling the trader to be able to attach the indicator several times with d
FREE
Bundle Risk Manager Pro EA "Risk Manager Pro EA is an all-in-one trading utility that combines advanced risk management tools, ensuring full control over your trading account while protecting your capital and complying with trading regulations. By bundling Limit Positions , Concurrent Risk Capital , and the newly added Limit Profit , this EA is the ultimate solution for disciplined trading and achieving evaluation goals. Key Features: 1. Limit Positions : Enforces a maximum number of open posi
FREE
SnapDraw Drawing Panel
Tamara Garcia Infantes
SnapDraw — every MT5 drawing tool in a panel under your chart Drawing in MetaTrader means hunting through menus and toolbars, and changing the colour of every line by hand. SnapDraw puts the tools you use in a slim panel docked under the chart: drag one onto the chart, or click it and draw, and it lands in your colour, snapped to the candle. What it includes • Every object in the MT5 Insert menu: lines, channels, Gann, Fibonacci, Elliott waves, shapes, arrows, text and graphical objects. • Ex
FREE
显示任何实时图表的交易/订单历史的通用指标,非常类似于策略测试器的可视化模式。它允许您检查任何特定交易品种的真实交易历史,以用于教育、改进、逆向工程或诊断目的。它可以与主密码和投资者密码一起成功使用。 [ 安装指南 | 更新指南 | 故障排除 | 常见问题 | 所有产品 ] 一些主要特点是: 方向分析 每笔交易的损益标签 可定制的颜色和尺寸 利润因子的计算 按工作日和一天中的时间划分的交易活动细分 输入参数 购买箭头:购买箭头的颜色 卖出箭头:卖出箭头的颜色 买入箭头大小:买入和卖出箭头的大小 Close Buy: 买单的关闭颜色 Close Sell:卖出订单的关闭颜色 关闭箭头大小:关闭订单箭头的大小 获胜交易线:显示盈利交易的线颜色 亏损交易线:显示亏损交易的线条颜色 买入线样式:长交易线样式 卖出线样式:短线交易线样式 买入线宽:显示多头交易的线的大小 卖线宽度:显示空头交易的线的大小 赢得贸易标签:盈利贸易标签的颜色 丢失贸易标签:丢失贸易标签的颜色 字体大小:图表标签的字体大小 支持 我很乐意提供免费产品,但鉴于我的时间有限,它们没有任何形式的支持。我很抱歉。 作
FREE
Blame The Box
Karim Abdelwahab
Blame The Box is a lightweight session range and breakout analysis indicator engineered specifically for MetaTrader 5. Built to support and enhance your personal trading strategy, it automatically identifies custom intraday consolidation ranges, maps out dynamic breakout levels, and displays real-time position sizing directly on your chart. Important Note: Blame The Box is an analytical and risk-calculation tool designed to assist your own technical analysis and discretionary trading strategy.
FREE
Level Asisstant
MIKHAIL VINOGRADOV
Level Assistant is an expert assistant for manually setting support and resistance levels. Traders often form their own levels. If there are many charts of different periods, the level will be multiplied by all charts. When placing a horizontal line on a chart, the Assistant suggests converting this line into a level. At the same time, he himself will determine the color and thickness of the line, depending on the period of the instrument and where it is relative to the price. Mark the level
FREE
该产品的买家也购买
Trade Assistant MT5
Evgeniy Kravchenko
4.43 (216)
它有助于计算每笔交易的风险,容易安装新的订单,具有部分关闭功能的订单管理, 7 种类型的追踪止损和其他有用的功能。   附加材料和说明 安装说明   -   应用程序说明 线条功能  - 在图表上显示开仓线、止损线、止盈线。 有了这个功能,就可以很容易地设置一个新的订单,并在开仓前看到它的附加特性。   风险管理  - 风险计算功能在考虑到设定的风险和止损单的大小的情况下,计算新订单的成交量。它允许你设置任何大小的止损,同时观察设定的风险。 批量计算按钮 - 启用 / 禁用风险计算。 在 " 风险 " 一栏中设置必要的风险值,从 0 到 100 的百分比或存款的货币。 在 " 设置 " 选项卡上选择风险计算的变量: $ 货币, % 余额, % 资产, % 自由保证金, % 自定义, %AB 前一天, %AB 前一周, %AB 前一个月。   R/TP 和 R/SL - 设置止盈和止损的关系。 这允许你设置相对于损失的利润大小。 例如, 1 : 1 - 这决定了 TP = SL 的大小。 2 : 1 - 这意味着 TP 是 SL 的两倍。 RR - 它禁用比率。   订单管理 该面板支
Farmed Hedge Yield Farming | All Markets (Manual - Hybrid - Semi/Automated EA) VERIFIED TRADING RESULTS - Farmed Hedge Yield Axi Copy:  https://www.mql5.com/en/signals/2356376 - Farmed Hedge Yield Exn Copy:   https://www.mql5.com/en/signals/2356404 - Farmed Hedge Yield V Copy:  https://www.mql5.com/en/signals/2357156 IMPORTANT NOTICE: FarmedHedge is a MANUAL-FOCUSED TRADING UTILITY ,not a fully automated EA. Results shown on this Signal include manual trades and overall strategic management.
欢迎来到 Trade Manager EA——这是一个终极风险管理工具,旨在使交易变得更直观、精准和高效。它不仅仅是一个下单工具,而是一个用于无缝交易计划、仓位管理和风险控制的全面解决方案。不论您是新手交易员、资深交易员,还是需要快速执行的剥头皮交易员,Trade Manager EA 都可以满足您的需求,适用于外汇、指数、大宗商品、加密货币等各种市场。 借助 Trade Manager EA,复杂的计算已成过去。只需分析市场,在图表上用水平线标记入场、止损和止盈,设置您的风险水平,Trade Manager 就会立即计算出理想的头寸规模,并实时显示以点、账户货币计价的止损和止盈。每笔交易都得以轻松管理。 主要功能: 头寸规模计算器 :根据定义的风险瞬间确定交易规模。 简单的交易计划 :在图表上用可拖动的水平线直接计划交易,设置入场、止损和止盈。 实时显示 SL 和 TP :以账户货币、点或分显示止损和止盈,便于分析。 高级保护工具 盈亏平衡选项 : 基本盈亏平衡 :当您的交易达到设定水平时自动保护利润。 多级盈亏平衡 :设置多达 4 个级别以逐步保护利润。 尾随止损选项 : 基本尾随
Telegram to MT5 Multi-Channel Copier   可将您 Telegram 和 Discord 频道中的交易信号自动复制到 MetaTrader 5。无需机器人、无需浏览器扩展、无需手动复制。信号一到 Telegram 或 Discord,EA 几秒内就在您的终端开仓。 在复制某个频道之前,内置回测器还能告诉您该频道在您的账户上会有怎样的表现。 产品包含两个组件:一个监听您 Telegram 频道的 Windows 应用程序,以及在 MT5 终端执行信号的本 EA。同时提供 MT4 版本   点此 . 购买前先试用:   应用程序可免费下载。连接您自己的频道,查看每条信号的读取结果。Backtest 选项卡和实际交易需要已购买或已租用的 EA。本页面的免费演示版只能在策略测试器中运行,而策略测试器无法读取 Telegram 和 Discord。 设置指南与应用下载:   https://www.mql5.com/zh/blogs/post/779480 了解如何 回测任何 Telegram 信号频道 。 当前价格将来会上调。 工作原理 应用通过您自己的 Te
Local Trade Copier EA MT5
Juvenille Emperor Limited
4.94 (150)
Local Trade Copier EA MT5 是一款快速、灵活的交易复制工具,用于在同一台 Windows 电脑或 Windows VPS 上的多个 MetaTrader 5 账户之间复制和管理交易。 它将本地交易同步与 Receiver 端的手数管理、风险管理、交易过滤、品种映射、交易管理和账户保护功能结合在一起。 只需约 1 分钟 即可完成 Transmitter 和 Receiver 终端的设置,并可在同一经纪商或不同经纪商的账户之间复制手动交易或 EA 交易。在合适的条件下,本地 MetaTrader 终端之间的交易信息可以在 0.5 秒以内 完成同步。实际交易执行速度取决于经纪商延迟、网络状况、电脑/VPS 性能以及终端负载。 购买前先试用免费演示版 您可以在 MT5 模拟账户上测试 功能完整的 Local Trade Copier EA MT5 免费演示版 ,每次可使用 4 小时 : 下载 Local Trade Copier EA MT5 免费演示版 将下载的文件放入: MT5 → 文件 → 打开数据文件夹 → MQL5 → Experts 然后重新启动 MT
TradePanel MT5
Alfiya Fazylova
4.88 (172)
交易面板是一款多功能交易助手。该应用包含超过50种手动交易功能,并允许您自动执行大多数交易任务。 应用程序说明 : https://www.mql5.com/zh/blogs/post/761102 用于模拟账户的应用程序试用版: https://www.mql5.com/zh/blogs/post/762579 如何安装应用程序: https://www.mql5.com/zh/blogs/post/762580 如何在可视化模式下测试应用程序: https://www.mql5.com/zh/blogs/post/770278 如何在VPS MetaTrader上安装应用程序: https://www.mql5.com/zh/blogs/post/770196 贸易. 只需单击一下即可执行交易操作: 打開掛單和頭寸,並自動計算風險。 一鍵打開多個訂單和頭寸。 打開訂單網格。 按組別關閉掛單和頭寸。 反轉頭寸方向(關閉買入>打開賣出,關閉賣出>打開買入)。 鎖定頭寸(通過開啟缺少的頭寸,使買入和賣出頭寸的數量相等)。 一鍵部分關閉所有頭寸。 將所有頭寸的止盈和止損設置在同一價格水平。
News Trade EA MT5
Konstantin Kulikov
4.55 (11)
在此向大家介绍一款我本人使用多年的机器人。该产品支持半自动和全自动交易模式。 >>> Chat <<< 本程序包含基于经济日历新闻的灵活交易设置功能。不支持策略测试器检验。仅可进行实际操作。 下載最新的設定檔: https://www.mql5.com/en/blogs/post/747929 訊號監控: https://www.mql5.com/en/signals/author/test-standart 请参考博客中各类参数说明自行实现个性化设置   : https://www.mql5.com/en/blogs/post/748545   。 主要默认设置说明 单一图表英镑/GBP(英镑美元/GBPUSD、欧元英镑/EURGBP、英镑日元/GBPJPY、英镑加拿大元/GBPCAD、英镑澳大利亚元/GBPAUD、英镑瑞士法郎/GBPCHF)货币对操作。英镑/GBP是波动性最大的货币,能够为用户顺利完成交易提供更多机会。 Use_Symbols_from_Line = true; Symbols_Line = GBPUSD, EURGBP, GBPJPY, GBPCAD, GB
按照自己的交易规则复制 Telegram 信号 Telegram to MT5 Signal Trader 可将 Telegram 公开及私密频道和群组中的文字交易信号自动复制到 MetaTrader 5。通过一个桌面应用管理多个信号提供者和 MT5 账户,并为 每个提供者单独设置风险和交易参数 。 复制信号无需 Telegram 机器人,也无需配置 API。 只需通过手机号或二维码登录您自己的 Telegram 账户,然后选择您已加入的频道或群组。您无需创建机器人,也无需提供 Telegram API 令牌、API ID 或 API hash。 自行选择仓位大小,将平仓分配到多个止盈价位,并自动执行保本止损和移动止损。在跟随信号提供者的同时,掌握信号的实际交易方式。 本产品由这款 MT5 EA 和必须配合使用的 Windows 桌面应用组成。请参阅 安装指南及应用下载 。 管理多个信号提供者和账户 为每个提供者单独设置: 为每个频道设置专属的仓位计算方式、入场规则、止损、止盈和交易管理参数。 灵活分配至不同账户: 将同一提供者的信号复制到多个已连接的 MT5 账户,并为每个账户使用不
Strategy Ledger Pro
Abdullah Uygar Tuna
5 (14)
现已支持中文。 Strategy Ledger Pro 是一款适用于 MetaTrader 5 的只读账户分析面板。它按智能交易系统(EA)、策略、品种和魔术号拆分账户结果,让您看清每一个的真实贡献。 面板支持 11 种语言:English、Français、Deutsch、Español、Italiano、Português、Русский、Türkçe、中文、日本語 和 한국어。 下载演示版之前请注意。 Market 仅在策略测试器中运行任何付费产品的演示版。本面板分析的是您自己账户上的交易,而策略测试器中没有可读取的账户历史,因此演示版会打开一个空面板并加以说明。这是演示机制的工作方式,并非产品的限制。 本描述中的视频展示了面板在真实账户上的运行效果。 详细的 使用手册 (英文)介绍了每项功能, AureusAI Trading Suite 群组欢迎交流讨论并发布公告。 MetaTrader 对整个账户只显示一个余额。当多个 EA 同时交易时,这个余额无法说明每个 EA 的贡献。Strategy Ledger Pro 读取账户历史,重建已平仓头寸,将其归入各个策略,并在一个
================================================================================ POC BREAKOUT - V20.72. Full Professional Grade Toolkit ================================================================================ POC Breakout is a full MetaTrader 5 trading dashboard for discretionary traders who want breakout signals, Point of Control (POC) context, volume profiles, order flow, market structure, news, alerts, and advanced trade planning in one professional workspace. Attached directly to you
Exp COPYLOT CLIENT for MT5
Vladislav Andruschenko
3.97 (35)
适用于 MetaTrader 5 的专业交易复制器 快速、专业、稳定可靠的 交易复制器 ,适用于 MetaTrader 。 COPYLOT 可在 MT4 和 MT5 终端之间复制 Forex 交易,并支持 Hedge 和 Netting 账户。 COPYLOT 的 MT5 版本支持: - MT5 Hedge → MT5 Hedge - MT5 Hedge → MT5 Netting - MT5 Netting → MT5 Hedge - MT5 Netting → MT5 Netting - MT4 → MT5 Hedge - MT4 → MT5 Netting MT4 版本 完整说明 + DEMO + PDF 如何购买 如何安装 如何获取日志文件 如何测试和优化 Expforex 的所有产品 您也可以将交易复制到 MT4 终端(MT4 → MT4,MT5 → MT4): COPYLOT CLIENT for MT4 COPYLOT 是一款专业的交易和持仓复制器,可同时与 2、3 甚至 10 个终端协同工作。 支持从 模拟账户和投资者账户 复制,也支持同时在多个终端上运行。 您可以使
The product will copy all telegram signal to MT5 ( which you are member) , also it can work as remote copier.  Easy to set up, copy order instant, can work with almost signal formats, image signal,  s upport to translate other language to English Work with all type of channel or group, even channel have "Restrict Saving Content", work with  multi channel, multi MT5 Work as remote copier: with signal have ticket number, it will copy exactly via ticket number. Support to backtest signal. How to s
EA Overfitter
Stephen J Martret
5 (3)
回测看起来很漂亮。但它明天、下周、下个月还能继续赚钱吗? EA Overfitter 让您的 EA 在 100 段它从未见过的价格历史上重新运行。一个分数告诉您这个优势是否真实。 回测告诉您的,是 EA 在某一段价格历史上的表现——那段恰好发生过的历史。您无法从中判断,这个结果有多少来自策略本身,又有多少只是那一条特定路径带来的。 EA Overfitter 回答的正是这个问题。它构建最多 100 段您的 EA 从未交易过的合成价格历史,让策略在全部这些历史上重新运行,并展示它所产生的完整结果区间。您得到的不再是一条幸运或不幸路径上的单个数字,而是一幅真实的图景:策略在陌生数据上多久能赚钱、典型结果是什么样(而不是最好的那一次),以及您的回测离它有多远。 这些世界是由您自己的近期历史重建而成,因此这不是预测——任何从历史数据出发的检验都不可能是预测。它告诉您的是:这个优势是否依赖于价格的某一种特定排列,以及回测数字距离典型结果有多远。在投入资金之前,这才是值得回答的问题。 三个步骤 1. 构建。在图表上选择时间区间和世界数量,然后按 Build。EA Overfitter 会
Power Candles 策略扫描器——自优化多符号设置查找器 Power Candles策略扫描器 采用与Power Candles指标相同的自优化引擎,可同时扫描您“市场观察”中的所有交易品种。一个面板即可显示当前哪些品种在统计上具备交易价值、每种策略的最佳应用方向、最优止损/止盈组合,并在新信号触发时立即向您发送提醒。 本工具是 Stein Investments 生态系统的一部分 - 18+ 款工具,加上 Max,您的一对一 AI 交易导师。  随时在线,深入了解每一款指标,在您需要梳理思路的那一刻就在那里。  立即认识他: https://stein.investments 您的全面市场监控。每个交易品种超过3,000次自动优化。2种警报类型。一键切换图表并采取行动。 为何您需要此工具 大多数多标的扫描器仅展示价格 波动 。每只股票的波动率、百分比变化、RSI。您仍需自行摸索正确的策略、合适的止损位以及理想的入场阈值。Power Candles策略扫描器针对每只股票自动解答这些问题,仅在数学验证过的交易设置中触发实际入场信号时才会向您发出提示。这就是全部卖点。 自动
Telegram To MT5 Ultra
Mirel Daniel Gheonu
5 (5)
Telegram To MT5 — 信号复制器 将您的 Telegram 频道中的交易信号变成真实的 MT5 订单 — 自动执行,可用于任意数量的账户,风险与规则完全由您掌控。 Telegram To MT5 将您已在 Telegram 关注的 VIP / 信号频道连接到您的 MetaTrader 5 终端。一个免费的配套桌面应用读取消息(即使是禁止机器人的频道),而本 EA 在您的账户上执行这些信号 — 应用您自己的风险设置、品种映射、止盈处理、交易时段与新闻过滤。 它是一个信号复制器,而非黑箱策略:由您决定信任哪些频道,以及每笔交易如何计算手数和管理。 分步设置与配套应用安装指南 工作原理 [您的 Telegram 频道] -> [配套桌面应用] -> [MT5 + 本 EA] -> 订单 配套桌面应用(免费,已包含)使用您的 Telegram 账户登录并监视您所选择的频道。即使是禁止机器人的 VIP 频道也能正常工作,它通过一个私有、加密的本地桥接转发每条消息。 本 EA 挂在一个图表上,在 MT5 接收这些信号,并按照您的规则开仓 / 管理交易。 应用与 EA 之间的连接是位于
HINN MagicEntry Extra
ALGOFLOW OÜ
4.74 (19)
HINN MAGIC ENTRY – the ultimate tool for entry and position management! SIMPLE. FASTEST. INTUITIVE. MAX AUTOMATED. Place orders by selecting a level directly on the chart! full description   ::  demo-version  :: 60-sec-video-description Key features: - Market, limit, and pending orders - Automatic lot size calculation - Automatic spread and commission accounting - Unlimited partitial take-profits  - Breakeven and trailing stop-loss and take-profit  functions - Invalidation leves - Intuitive, a
Timeless Charts
Samuel Manoel De Souza
5 (9)
Timeless Charts is an all-in-one trading utility for professional traders. It combines custom chart types such as Seconds Charts and Renko with advanced order flow analysis using Footprints , Clusters , Volume Profiles , VWAP studies, and anchored analysis tools for deeper market insight. Trading and position management are handled directly from the chart through an integrated trade management panel , while Market Replay and Virtual Accounts provide environments for practicing trading skills and

Telegram to MT5 Coppy
Sergey Batudayev
5 (10)
Telegram 到 MT5: 终极信号复制解决方案 使用 Telegram 到 MT5 简化您的交易,这款现代化工具可直接从 Telegram 频道和聊天室复制交易信号到您的 MetaTrader 5 平台,无需 DLL 文件。这款强大的解决方案可确保精准的信号执行、丰富的自定义选项,节省时间并提高您的效率。 [ Instructions and DEMO ] 主要特点 直接 Telegram API 集成 通过电话号码和安全码进行身份验证。 通过用户友好的 EXE 桥轻松管理聊天 ID。 添加、删除和刷新多个频道/聊天以同时复制信号。 使用高级过滤器进行信号解析 跳过包含异常词(例如“报告”、“结果”)的不需要的信号。 支持灵活的 SL 和 TP 格式:价格、点数或点数。 自动计算指定点而不是价格的信号的切入点。 订单定制和灵活性 使用多种模式配置订单大小:固定手数、动态手数(% 风险)或特定符号手数。 使用信号数据或自定义参数调整 SL/TP。 设置滑点限制、挂单到期时间和重试参数,以实现无缝执行。 综合符号管理 排除特定符号或映射到特定经纪人的符号。 自定义信号和经纪商符号之间
MetaTrader 5 专业交易面板 —— 图表与键盘一键交易的高效控制中心 一款面向主动交易者的专业 Trading Panel,可让您比标准 MetaTrader 操作方式更快、更直观地完成开仓、平仓、修改、管理与控制。 这不是一个普通的小工具,而是一个为高频手动操作、仓位管理、挂单控制与利润管理而设计的完整交易工作台。 通过这套面板,您可以直接在图表上一键执行交易,通过键盘快速触发核心操作,并借助自动参数计算、图形提示、信息标签以及可视化管理功能,大幅减少重复性操作,让整个交易流程更加流畅、高效且专业。 使用我们的交易面板,您可以直接从图表上一键下单,执行交易操作的速度可比标准 MetaTrader 控件快约 30 倍。 全新高级版本现已推出: 使用 VirtualTradePad PRO SE 升级您的交易流程 — 适用于 MetaTrader 5 和 MetaTrader 4 的新一代专业交易面板。 MT4 版本 | 完整说明 + DEMO + PDF | 如何购买 | 如何安装 | 如何获取日志文件 | 如何测试与优化 | Expforex 的所有产品 为什么交易者会
Anchor Trade Manager
Kalinskie Gilliam
5 (8)
Your EAs cannot see each other, but Anchor can. Anchor gives you one place to coordinate your EAs, manage risk, and decide when trading is allowed. It works alongside the trading bots you already use without any changes to them. The Problem One EA opens a trade. Then another starts trading. The next thing you know, you wake up to multiple grids built across your account. Each EA may be doing exactly what it was designed to do, but together they can place far more risk on your account than you in
下一次更新 — 版本 2.52 即将推出![全新功能] 准备迎接 4 项重大新功能,全面提升您的市场分析能力与交易流程! 我们将通过 4 项全新功能,进一步提升市场分析水平,满足您的交易需求。现为您介绍: 1. TRADE OVERVIEW DASHBOARD 2. CONFLUENCE AT ZONE 3. STRONG & WEAK HIGH/LOW 4. OTE 1. TRADE OVERVIEW DASHBOARD 一个帮助您更轻松地了解整体市场状况的仪表盘,为您的交易决策提供参考指引,帮助您系统地分析市场并规划交易,所有信息尽在一个屏幕中。 多时间周期市场概览(Multi-Timeframe Market Overview) 更清晰地了解市场方向与价格结构 快速查看市场状况 为系统化市场分析和入场规划提供指引。 2. CONFLUENCE AT ZONE 当价格进入关键区域时……您将了解有多少项支持因素相互吻合。 关键区域是交易决策至关重要的地方。但仅仅是价格进入某个区域还不够。此功能可帮助您在入场交易前,识别相互吻合的因素,包括信号及其他相关因素,从而进行更全面的分析,并
VirtualTradePad PRO SE MT5 — MetaTrader 5 专业交易控制中心 VirtualTradePad PRO SE 是一款基于图表的高级交易面板,也是适用于 MetaTrader 5 的交易管理工作区。它专为希望获得更快执行、更清晰持仓控制、结构化交易管理、可视化价位规划,以及直接在图表上完成专业交易流程的交易者而设计。 这不仅仅是一个 BUY / SELL 面板。PRO SE 将手动交易、挂单、持仓管理、部分平仓、篮子利润/亏损控制、加仓均价层级、ATM 规则、信号监控、实时市场信息、策略测试器 (Strategy Tester) 流程以及面向 VPS 的运行方式整合到一个互相关联的界面中。 MT4 版本 | 完整说明和截图 | 如何购买 | 如何安装 | 如何获取日志文件 | 如何测试与优化 | Expforex 的所有产品 为什么交易者会选择这套面板 图表一键交易 ,并支持键盘快速操作 快速完成开仓、平仓、修改、反转、锁仓与部分平仓 深度控制仓位、挂单、总利润与风控逻辑 自动参数计算,减少手动输入与重复劳动 为什么 PRO SE 比标准手动交易更高
Trade Indicator Assistant   is a powerful MT5 utility designed to turn indicators into automated trading systems. Its main feature is the ability to automatically detect an indicator’s   BUY and SELL signal buffers , without requiring you to know the buffer numbers, search through indicator settings, or modify the indicator source code. Bonus Indicator:   After purchasing Trade Indicator Assistant, contact me to receive   Trade Signal Pro   completely free as a bonus indicator. [Download Demo V
EA Auditor
Stephen J Martret
5 (7)
EA Auditor is an independent analysis tool for traders evaluating Expert Advisors and trading signals on MetaTrader 5. It audits backtest reports, reviews posted developer signals, and cross-verifies the two against each other to help traders assess strategies before committing capital. The MQL5 market offers a wide range of Expert Advisors from many developers, with varying approaches, quality, and transparency. EA Auditor provides a consistent, data-driven framework for reviewing them, answer
Trade Manager DaneTrades
Levi Dane Benjamin
4.13 (31)
交易管理器可帮助您快速进入和退出交易,同时自动计算风险。 包括帮助您防止过度交易、报复性交易和情绪化交易的功能。 交易可以自动管理,账户绩效指标可以在图表中可视化。 这些功能使该面板成为所有手动交易者的理想选择,并有助于增强 MetaTrader 5 平台。多语言支持。 MT4版本  |  用户指南+演示 交易经理在策略测试器中不起作用。 如需演示,请参阅用户指南 风险管理 根据%或$自动调整风险 可选择使用固定手数或根据交易量和点自动计算手数 使用 RR、点数或价格设置盈亏平衡止损 追踪止损设置 最大每日损失百分比,在达到目标时自动平仓所有交易。 保护账户免遭过多提款并阻止您过度交易 最大每日损失(以美元为单位)在达到目标时自动关闭所有交易。 保护账户免遭过多提款并阻止您过度交易 一键实现所有交易的盈亏平衡 自动计算从手机/电话发送的交易的风险 OCO 在设置中可用 交易和头寸管理 通过设置每月、每周、每天、每小时或每分钟的最大交易次数,停止过度交易和报复性交易。 高级挂单管理。 调整何时关闭挂单的规则 追踪挂单 支持市价订单和挂单 每日最大利润目标(以美元为单位)以确保头寸并停止
MT5 to Telegram Signal Provider 是一个易于使用且完全可自定义的工具,它允许向 Telegram 的聊天室、频道或群组发送 指定 的信号,将您的账户变为一个 信号提供商 。 与大多数竞争产品不同,它不使用 DLL 导入。 [ 演示 ] [ 手册 ] [ MT4 版本 ] [ Discord 版本 ] [ Telegram 频道 ]  New: [ Telegram To MT5 ] 设置 提供了逐步的 用户指南 。 不需要了解 Telegram API;开发者提供了您所需的一切。 关键特性 能够自定义发送给订阅者的订单详情 您可以创建分层的订阅模型,例如铜、银、金。其中金订阅获得所有信号等。 通过 id、符号或评论过滤订单 包括执行订单的图表截图 在发送的截图上绘制已关闭的订单,以便额外核实 延迟发送新订单消息的可能性,以便在发送前对位置进行调整 订单详情完全透明: 新的市场订单*带截图 订单修改(止损、获利) 已关闭的订单*带截图 部分关闭的订单** 新的挂单 修改的挂单(进场价格) 挂单激活(作为新的市场订单附加) 已删除的挂单 历史订单报告
RETAILBERG FOOTPRINT CHART PRO — Order-Flow Workspace for MetaTrader 5 Version 7.00  |  Professional System  |  31 tools  |  One chart A full 150-page illustrated User Manual is included. Please read the full manual to understand this feature packed footprint chart elements and ui. https://www.mql5.com/en/blogs/post/777982 DEMO / STRATEGY TESTER — PLEASE READ FIRST
Trader Evolution
Siarhei Vashchylka
5 (7)
" Trader Evolution " - A utility designed for traders who use wave and technical analysis in their work. One tab of the utility is capable of money management and opening orders, and the other can help in making Elliott wave and technical analysis. Manual (Be sure to read before purchasing) | Version for MT4 Advantages 1. Trading in a few clicks. Immediate and pending orders are available in the panel 2. Money management. The program automatically selects the appropriate lot size 3. Simplifies
Trade copier MT5
Alfiya Fazylova
4.61 (57)
Trade Copier 是一种专业实用程序,旨在复制和同步交易账户之间的交易。 复制发生从供应商的帐户/终端到收件人的帐户/终端,安装在同一台计算机或 vps 上。 在购买之前,您可以在演示帐户上测试演示版本。 演示 这里 。 完整说明 这里 。 主要功能和优点: 支持复制MT5>MT5、MT4>MT5、MT5>MT4,包括МТ5 netting账户。 供应商和收件人模式在同一产品中实现。 简单直观的界面,允许您直接从图表中实时控制复制。 连接中断或终端重新启动时不会丢失设置和位置。 允许您选择要复制的符号,也可以替换接收者的符号,例如 EURUSD> USDJPY。 允许为每个符号设置个性化的复制设置。 支持回拷贝。 能够仅复制某些订单。 允许您设置开仓交易价格的最大差异和最大时间延迟。 正确复制部分订单关闭的执行。 计算复制手数的几种方法。 同步止盈和止损。有几种方法可以计算它们的位置。 支持通过执行在“Market account”上工作,其中 SL / TP 仅在开仓后设置。 如何使用简单的设置复制交易 将供应商终端和接收终端安装在同一台计算机或 VPS 上。 在供应商终端上
DrawDown Limiter
Haidar Lionel Haj Ali
5 (23)
DrawDown Limiter v5.0 — 高级账户保护控制器 DrawDown Limiter v5.0 是一款运行于客户端的交易账户保护控制器,用于监控您的交易账户,并在达到您所设定的风险、盈利、新闻、时间计划、Rollover 或持仓数量限制时自动采取相应措施。 它可以通过一个独立图表监控 手动交易、自动化策略、多个 EA、挂单以及浮动持仓 。它既可以保护整个交易账户,也可以通过 Magic Number 仅监控特定 EA 或一组 EA。 DrawDown Limiter 的目的不仅仅是显示回撤,而是 主动执行您设定的交易规则 ,并在保护条件保持有效期间持续执行这些规则。 DrawDown Limiter v5.0 不仅用于监控您的亏损程度,还用于控制策略何时可以继续运行、哪些风险敞口可以保留、何时必须停止交易,以及自动化交易环境何时可以安全恢复运行。 需要帮助或有任何问题?  请查看   DrawDown Limiter 用户指南 我是  Lio ,欢迎随时联系我!  我们始终愿意为您解答问题、提供帮助并持续改进产品。 统一的保护系统 DrawDown Limiter v
作者的更多信息
Pivot Stop Gold
Vasilii Makarenko
Pivot Stop Gold 围绕黄金上的一种情况构建:价格在一个摆动点转向,然后穿过它。EA 不追这波走势。一个挂单止损单已经在摆动点附近等待,止损和止盈已经附在它上面,在价格到达那里之前。持仓很短:在下面的报告中,平均一笔持续了五分钟。 枢轴位 在其工作时间框架的每一根新柱上,EA 从最近 300 根柱构建一个 ZigZag,并取最近的两个枢轴,从不计算仍在形成的那根柱。如果两者中较旧的一个是高点,一个 Buy Stop 就放在它正下方。如果较旧的一个是低点,一个 Sell Stop 就放在它正上方。距离是一个属于该配置的固定偏移量。一旦价格处于该水平的 0.10 以内或已经越过它,就不下任何订单,并且 EA 每边最多保留一个订单或持仓(投资组合模式下按配置)。一个挂单存活设定的若干小时,EA 在该时间后的第一个 tick 自行移除它。 七个配置 一个配置固定工作时间框架、ZigZag 深度、入场偏移、止损、止盈和移动止损。距离以每盎司黄金的美元计,即每美元 100 个两位小数报价的点。 Scalp 是默认值。 Calm:M30 柱,深度 18,入场在枢轴前方 1.85,止损 4
Swept Liquidity Pools
Vasilii Makarenko
5 (1)
A liquidity sweep is a bar that pushes past a prior swing high or swing low, where protective stop orders tend to rest, and then closes back on the inner side of that level. The same event is known under several names: a stop hunt, a stop run, a liquidity grab, a false breakout, a failed breakout, or a swing failure. Swept Liquidity Pools marks those levels and those bars on the chart. The indicator tracks liquidity pools - confirmed swing levels that have not yet been taken - and marks the exac
FREE
Auto Level Map
Vasilii Makarenko
What Gets Drawn Most level tools mark every swing they can find, and a chart with forty lines answers nothing. This one keeps a level only when price came back to it, and prints the evidence next to the line: the number of touches and the age in days. Lines above current price and lines below it are drawn in different colours, so the map reads at a glance without counting. What Puts A Level On The Chart A swing high is a bar whose high is not lower than its neighbours on both sides, within the n
FREE
Session Value Desk
Vasilii Makarenko
Three Anchors On One Chart Most volume weighted average lines restart once a day. This one draws three at the same time: one anchored to the current trading session, one to the day, one to the week. Their spread tells you something a single line cannot. When the session line sits far under the weekly one, the week has been trading higher than today is; when all three sit together, the market has spent the week in one place. Why The Session Anchor Is Not Midnight The session line starts where the
FREE
Hourly Spread Map
Vasilii Makarenko
Hourly Spread Map answers one question: at which hours does this symbol cost more to enter, and by how much. It reads the spread field that the terminal stores in every closed M1 bar of your own broker feed, sorts those measurements into 24 hours by 7 days of the week, and shows the result as a grid in the indicator sub-window. What It Measures Every closed M1 bar carries one spread measurement. The indicator collects them over the period you choose, groups them by the hour and weekday of the ba
FREE
Candle Clock Desk
Vasilii Makarenko
What It Shows Candle Clock Desk puts four lines on the chart. The first is the time left until the current bar closes. The next three answer a question the clock alone cannot: is this bar unusually busy, or unusually quiet, right now. Bar closes in - the countdown, in minutes and seconds So far - volume this bar has accumulated since it opened Usual here - what this symbol had accumulated by this same minute, in the past Pace - the first divided by the second The Pace Line Pace of 1.00 means the
FREE
Swap Cost Calendar
Vasilii Makarenko
Swap is the part of the cost that is easy to forget, because it arrives once a day, quietly, and never appears in the spread. Swap Cost Calendar puts it on the chart as a number you can act on. What It Shows The panel reads what the broker publishes for the current symbol and shows four things. The cost of one night for a long position and for a short one, in your account currency or in points. The weekday line, showing how many nightly charges a position carries on each day of the week. The tri
FREE
Range Zones M30
Vasilii Makarenko
Range Zones M30 draws zones on your chart where price was pushed back hard on the 30-minute timeframe. It works on any symbol and any chart timeframe, and reads only the prices your terminal already has. It does not use any server, does not send anything out, and does not open or change orders. What It Shows A resistance zone above the market and a support zone below it, as filled rectangles that start at the open of the swing candle that formed them and run to the right. At any moment there is
Signal Confirm
Vasilii Makarenko
Signal Confirm watches one symbol and tells you when a trend setup has passed a fixed chain of checks. It works on any symbol and any chart timeframe. It reads only the M1 prices, the prices of the oscillator timeframe (M5 by default) and the daily prices your terminal already has, does not use any server, does not send anything out, and does not open, change or close orders. It shows what happened and when; the decision stays with you. What It Does When the chain below is complete, the indicato
Volatility Dots
Vasilii Makarenko
Volatility Dots puts a trailing line of dots on your chart. In an uptrend the dots sit under the price, in a downtrend above it, and they flip when price closes through the opposite band. It works on any symbol and any timeframe. It reads only the prices your terminal already has, does not use any server, does not send anything out, and does not open or change orders. What It Shows One dot per bar. White dots under the candles mark a rising trend, red dots above the candles mark a falling trend.
Daily Range Ladder
Vasilii Makarenko
Daily Range Ladder draws six horizontal levels across the current trading day. The distances come from how far the symbol usually travels in a day, so the levels adapt to every symbol without any setting. It works on any symbol and any chart timeframe. It reads only the daily bars your terminal already has, does not use any server, does not send anything out, and does not open or change orders. What It Shows Three resistance levels above the day's low and three support levels below the day's hig
流动性池是尚未被触及的已确认的摆动高点或摆动低点。流动性扫荡是价格交易至该水平之外随后收盘回到区间内的那一根K线 - 交易者也将同一事件称为止损猎杀、止损扫荡、流动性抓取或假突破。Liquidity Sweep Pools MTF 在当前图表以及你选择的更高时间周期上标记流动性池以及在其上发生的流动性扫荡,并添加一个活跃流动性池的实时面板、流动性池形成时的成交量过滤器,以及检测到的扫荡的 CSV 导出。 此处多时间周期确认意味着每个流动性扫荡都可以对照更高时间周期的流动性池来解读,而无需离开你面前的图表,两组水平以各自的颜色并排绘制。 它标记什么 一件事,精确地说:流动性池的几何形态。它绘制的每个流动性池都带有价格水平、方向、距离和存在时长,同样的四个值会进入面板和 CSV 文件。这就是全部词汇,因此输出易于逐根K线验证,也易于输入到你自己的规则中,无论你是手动交易它们还是从智能交易系统读取缓冲区。 多时间周期流动性池确认 该指标可以将更高时间周期上按相同规则形成的流动性池直接绘制在当前图表上,使用单独的颜色和线宽,因此两个时间周期都可见而无需切换图表。更高时间周期的流动性池绝不会在确
Structure Desk
Vasilii Makarenko
一个用于 MetaTrader 5 上 XAUUSD 的专家顾问。它一次只操作一个篮子:它在固定的服务器小时数内开仓,在价格对其不利时加仓,并将整个篮子一起平仓。单个持仓没有止损,也没有止盈。 它如何交易 一个品种,XAUUSD,一次一个篮子,同一方向最多 5 个订单。 只允许在固定的服务器小时内入场,并且只有当价格位于其四小时区间的边缘时。服务器时间 14:00 至 22:00 之间禁止入场。 当价格对篮子不利时,专家以固定的美元距离加订单,订单之间至少暂停 60 秒。 篮子作为整体平仓:通过账户货币的目标,通过取决于入场小时的价格目标,或在目标被激活后通过移动回吐。 订单量随账户余额缩放。加仓的订单保持相同的量:没有乘数。 专家开箱即可运行:默认输入正是下文每一个数字所依据的设置,包括每小时目标和步长。无需从设置文件加载任何内容。 内置保护 三个限制开箱即启用,每一个都可以关闭。 WeekendFlatHour = 21 - 在周五服务器时间 21:00 平掉篮子并停止入场,这样不会有任何东西被持仓过周末。黄金在周末跳空:在最近 1100 个交易日中,40 美元或以上的跳空发生了
Sarveon
Vasilii Makarenko
Sarveon 是 MetaTrader 5 上用于 XAUUSD 的专家顾问。九个独立策略在同一个图表上并行运行。每个策略都有自己的魔术编号、自己的入场时间周期和自己的一组距离,任何一个策略都不会对另一个策略开出的仓位加仓。 如何交易 每个策略在自己的入场时间周期上扫描最近的 K 线,寻找一个摆动水平位:一个之后没有任何 K 线超过的高点,或者一个之后没有任何 K 线跌破的低点。该水平位必须与当前价格保持最小距离,否则会被忽略。 入场是在该水平位放置的挂单止损单,带有以美元计的固定偏移。买入止损单位于阻力水平位下方而不是上方,因此订单是在价格仍在接近该水平位时成交,而不是在它被突破之后。止损和止盈在订单放置时附加到订单上,并从订单价格而不是成交价格起算。 每个策略限制它同时可以持有多少个挂单和多少个持仓,并拒绝在离自己已经挂出的某个订单太近的地方放置新订单。挂单有自己的生命周期,根据策略不同从几小时到几天不等,到期时会被移除。 一个产品中的九个策略 这九个策略在入场时间周期、摆动水平位的确认方式、订单距离水平位的远近以及止损和目标的大小上各不相同。入场从日线、四小时和一小时图表读取;
Ridgeline
Vasilii Makarenko
Ridgeline 等待在黄金未曾触及的价格水平上。它读取日线柱,标记出此后没有任何柱突破的高点和低点,并在那里挂出一个挂单止损订单。七套规则在不同的历史深度上搜索,因此其中一套可能正等待在上周形成的水平上,而另一套则关注三个月前的水平。 一套规则在承受亏损后会停手两天,然后才再次下单。每套规则都有自己的魔术编号和自己的距离,任何一套规则都不会加仓到另一套规则开立的仓位。亏损的交易由其止损平仓,从不摊平,从不加倍。 它如何找到一个水平 每套规则读取日线柱,只寻找一件事:一个自形成以来市场未曾突破的水平。阻力是一个日线高点,它高于其后的每一根柱,也高于其紧邻之前的柱。支撑是其镜像。价格已经越过的水平不再是水平,规则会转向下一个。 该水平还必须与当前价格保持最小距离。如果最近的未突破水平太近,规则会等待,而不是交易一个市场已经坐落在其上的水平。 入场是一个挂单止损订单,以固定偏移量放置在该水平附近。买入止损位于阻力略下方而非上方,因此当价格仍在接近该水平时订单就会被成交。止损和止盈在订单下达的那一刻就附加到订单上,而不是在成交之后。 每个挂单都有自己的生命周期,根据规则不同,从三天到十九天
Sixfold Gold
Vasilii Makarenko
Sixfold Gold trades XAUUSD on the hourly chart. It looks for the points where the market turned and left an extreme behind, places a pending stop order a little inside that level, and attaches a stop loss and a take profit before the order is ever filled. Six zones do this independently, each with its own search depth, and between them they read three timeframes and four sessions, so the advisor is rarely committed to a single view of the market. A trade that goes wrong is closed by its stop. No
GhBreak
Vasilii Makarenko
GhBreak 建立在一个关于黄金的想法之上:一个自形成以来一直守住的高点或低点的突破,可以走得足够远,以支付那些失败的突破。EA 不追突破。在价格到达之前,挂单止损单已经在该水平等待,并附带其止损和止盈。持仓时间很短:在下面的报告中,平均一笔持续了 22 分钟。 摆动水平 每组规则从小时数据构建自己的 K 线 - H2、H4 或 D1 - 并寻找最新的摆动:一个高点,其左侧高于设定数量的 K 线,其右侧由设定数量的 K 线确认,并且此后没有任何 K 线突破它。价格上方最近的此类高点成为买入水平,价格下方最近的此类低点成为卖出水平。当新的摆动形成或旧的被突破时,挂单被移动到新水平,而不是等待到期日。 订单位于水平稍前一点,因此当价格到达时就会成交,而不是在价格穿过之后。 四组规则 默认开启四组:两组在 H2 K 线上读取摆动,确认方式不同,一组在 H4 上,一组在 D1 上。第五组可用但已关闭。每组每侧最多保留一个挂单,并且当它自己在该侧有持仓时不会在该侧下新单。每组带有自己的魔术编号,因此不同组的持仓从不混合。 止损和止盈是入场价格的分数:止损为 0.28% 到 1.00%,止盈为
Signal Compass Desk
Vasilii Makarenko
一个面板代替五个窗口 解读市场通常意味着同时打开好几个窗口:一个移动平均线看方向,一个振荡指标看动量,一个强度指标区分趋势与区间,还要再来一个看水平位。每一个都在屏幕的自己的角落里回答自己的问题。 Signal Compass Desk 把这些读数放进图表角落里的一个区块中。看一眼就能知道市场偏向哪一边,这波走势的动量是在增强还是在减弱,背后有没有强度,一笔交易设置会把止损和目标放在哪里,以及当前正在运行的是哪个交易时段。 面板在图表上绘制对象,不计算指标缓冲区,因此它不触碰图表本身。它随着新柱的到来而更新。 面板显示什么 方向。分析时间周期上移动平均线的斜率,按波动率归一化,使读数在不同品种和周期之间保持可比。 动量。随机振荡指标的状态,压缩为五个可读状态。 趋势强度。ADX 读数附带一个简单的标签,以免把区间误认为趋势。 交易设置。由 ATR 值推导出的一个止损水平和三个目标,既可以基于信号柱构建,也可以基于最近的回测水平构建。 时段。悉尼、东京、伦敦和纽约,按服务器时间。 质量过滤器。三个严格程度级别,决定面板多容易呈现一个设置。 方向,以及为什么更高的时间周期会确认它 方向读数
Tessera Footprint
Vasilii Makarenko
Tessera builds a footprint (cluster) chart from the trade ticks that your MetaTrader 5 terminal already receives from your broker. Prices, volumes and sides come from your own data feed; the indicator does not use any external server, does not send anything out and does not read or store your account details. What It Shows Buy and sell volume inside each bar, price by price, with numbers when they fit. Delta of the bar (the difference between buy and sell volume), cumulative delta and a delta st
What You See On The Chart Swing Percentile Desk places one table on one chart. Each row is a symbol from your watchlist and each column is a pullback size. A cell tells you what share of that symbol's earlier moves the current move has already outdone. A low number means a young move; a high number means the move is stretched compared with the history of the same symbol. Every symbol is compared only with itself, so a quiet pair and a restless pair are read on the same scale and no manual measur
Session Open Carry
Vasilii Makarenko
Session Open Carry is built on one idea: the side on which a session opened shows which way to hold a position until the next day. Once a day, at a set minute, the EA compares the last price with the open of the session. Price above the open - it buys. Price below the open - it sells. Price at the open - it stays out. The stop is placed at the extreme of the session, the position is carried overnight and it is closed at a set minute on a later day. The EA tests this idea on every session and doe
Gold Brackets
Vasilii Makarenko
Gold Brackets 建立在一个关于黄金的想法之上:价格回到一个一直未被突破的摆动高点或低点,往往会带着力量穿过它,而在这个水平上等待的止损单会捕捉到这一走势,而不去追它。EA 提前放置挂单,止损和止盈已经附加,并在该水平不再有效时取消它。 摆动水平 每一套规则都查看小时图上的最近摆动高点和摆动低点:一根K线的高点(或低点)高于(或低于)其之前设定数量的K线,并且之后没有K线突破它。摆动还必须足够旧,也不能太旧;一套规则会忽略最新的几个小时和最旧的几个小时,因此它处理的是市场已经有时间测试过的水平。 订单放在水平稍前的位置,距离随价格增长,因此它在价格到达时成交,而不是在价格已经穿过之后。买入止损属于市场上方的摆动高点,卖出止损属于市场下方的摆动低点。如果某个摆动被一笔交易使用,该规则会转向下一个仍然有效的摆动,并且不会在同一水平上放置第二个订单。 五套规则 五套规则在一个图表上运行,在订单注释中标记为 A 到 E。每一套都有自己的魔术号,由基础号码构成,有自己的查看市场频率的时机、订单存活多久以及读取历史的深度。每套规则每边最多保留一个挂单,并且在自己持仓已开的一边不放置任何东
筛选:
无评论
回复评论