Session Open Carry

Session Open Carry is built on one idea: the side on which a session opened shows which way to hold a position until the next day. Once a day, at a set minute, the EA compares the last price with the open of the session. Price above the open - it buys. Price below the open - it sells. Price at the open - it stays out. The stop is placed at the extreme of the session, the position is carried overnight and it is closed at a set minute on a later day. The EA tests this idea on every session and does not claim that it holds in every market.

The Idea

The session is one day on the EA's own clock. Its open is the open of the first minute bar of the day, and its high and low are updated from minute bars as the day goes on. The EA makes at most one entry per day and holds at most one position. It never adds to a position and never doubles a lot. Saturday and Sunday are skipped.

The stop is the low of the session for a long position and the high of the session for a short one. On the next day it moves to the extreme of the new session as that session develops. A position whose stop level is touched is closed at the market.

Three Modes

  • Hold: entry, session stop, exit at the set minute on a later day. This is the default mode and the mode the figures below were made in.
  • Take: Hold plus a partial take-profit. Half of the position is closed when price moves a set number of points in its favour. At the exit minute the position is closed only if its result is negative or lower than it was at the last evening snapshot; otherwise it is carried on.
  • Take and Trail: Take plus a trailing level. The level starts at a set percentage below the entry price for a long position (above it for a short one). After the price has moved a set percentage in favour of the position, the level follows the most favourable price reached so far at a set distance in percent. Reaching the level closes half of the position.

A partial close needs a position of at least two lot steps. With one lot the two partial modes change only the exit rule.

Session Clock

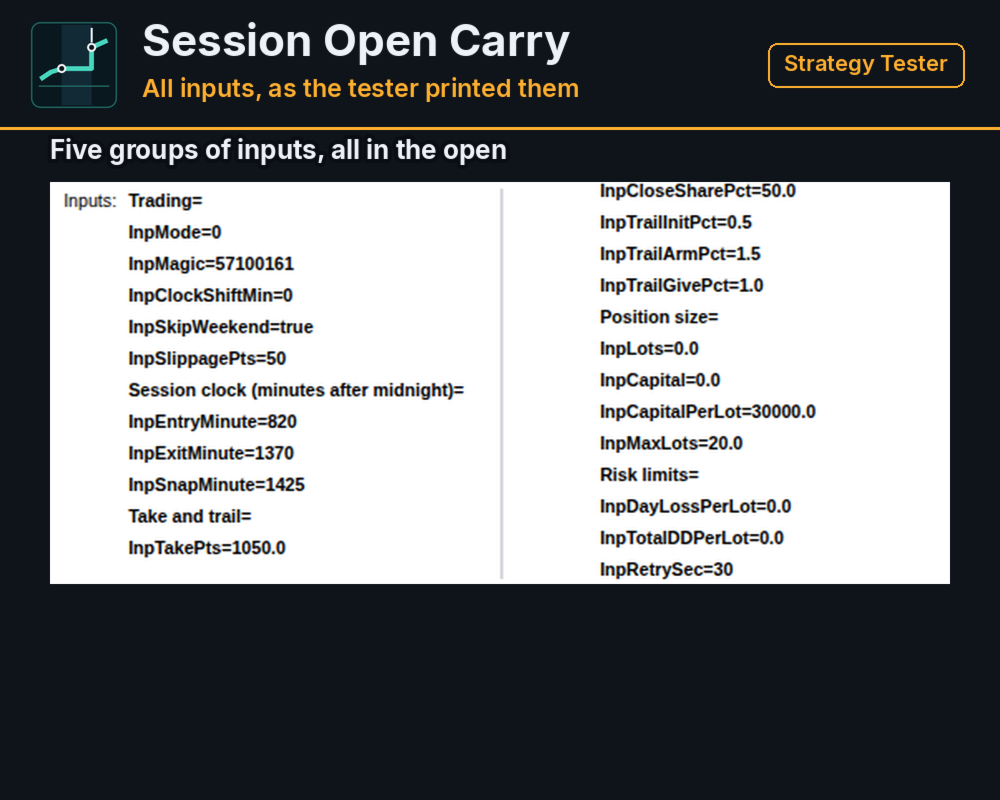
The entry, the exit check and the evening snapshot are set as minutes after midnight on the EA clock: 820 (13:40), 1370 (22:50) and 1425 (23:45) by default. The clock is the server time moved by InpClockShiftMin, so a broker whose day does not start at the session open can still be matched. A position opened on one day is never closed on the same day: the exit check works from the next day on.

Managing A Position

The stop reaches the broker with the order and follows the session extreme afterwards. If the stop cannot be sent because it is too close to the price, the EA places it at the nearest allowed distance and closes the position at the market when price has already passed the level.

  • an entry declined for a temporary reason (requote, price change, timeout, lost connection) is repeated once a second for up to 30 seconds;
  • an exit that was declined is repeated until the position is closed;
  • the EA restores its state after a restart from the open position and from its own records.

Risk Controls

  • The lot is the minimum lot of the symbol by default. A fixed lot or a lot by capital can be set; the lot ceiling is 20 by default.
  • Before each entry the EA checks the free margin and reduces the lot to the part of it that fits. If not even the minimum lot fits, it does not trade that day.
  • A loss limit per lot for one day and a drawdown limit per lot from the peak are available. Both are off by default.
  • Before each request the EA checks the trade mode of the symbol, the trading session, the stop and freeze levels and the volume limits, and does not send a request the broker would reject.
  • No grid, no martingale, no averaging.

Strategy Tester Figures

Read the figures with one fact in mind: in each period two single trades make up almost the whole net result, and with so few trades the result cannot be told apart from chance. The amounts are given below, in the section on what the figures do not show.

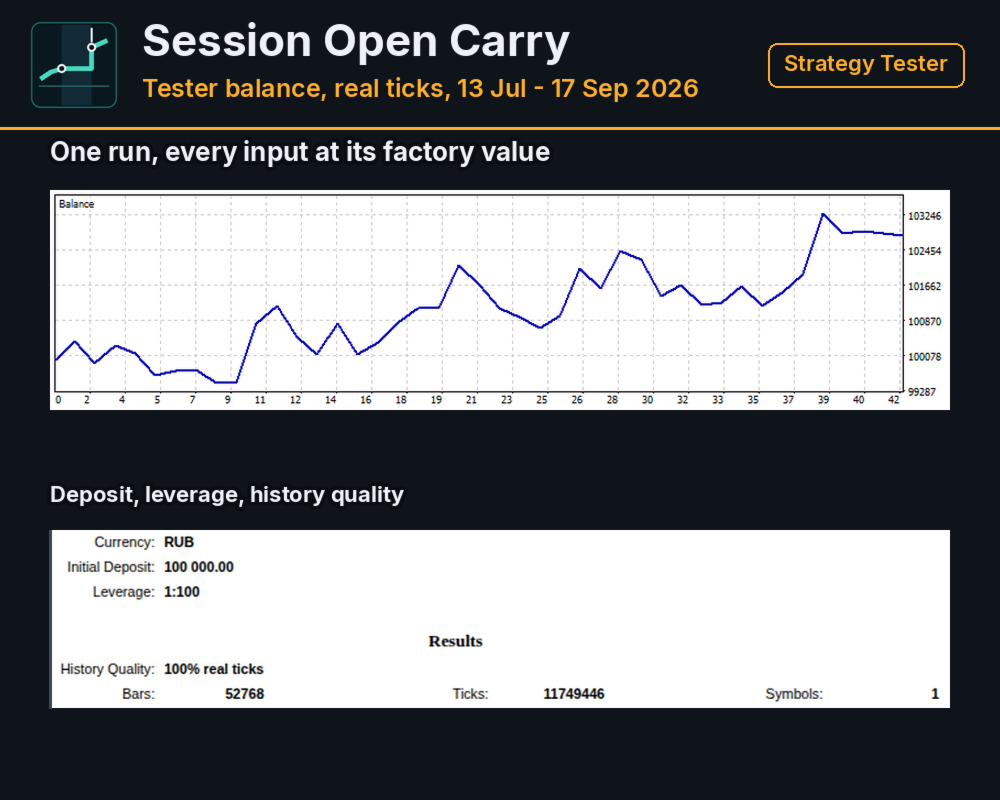
The figures come from the Strategy Tester on the Si futures, 100% real ticks, one lot, starting deposit 100000 RUB, leverage 1:100, mode Hold, every input at the value it ships with. The entry and exit minutes were not searched for on these periods: they were fixed before the periods began. Each period is run three times: with no delay, and with the tester delaying the EA's actions by 300 ms and by 1000 ms. Commission was set to zero in these runs and the slippage of market entries is not modelled, so both costs are left out of every figure below. All amounts are in RUB.

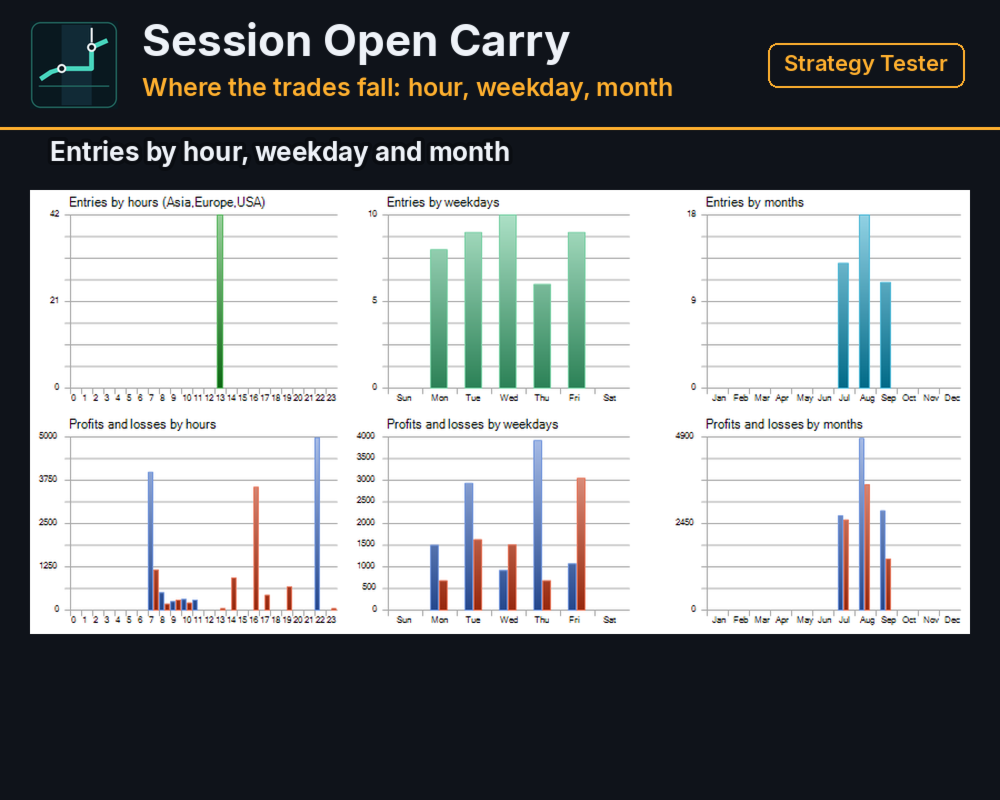
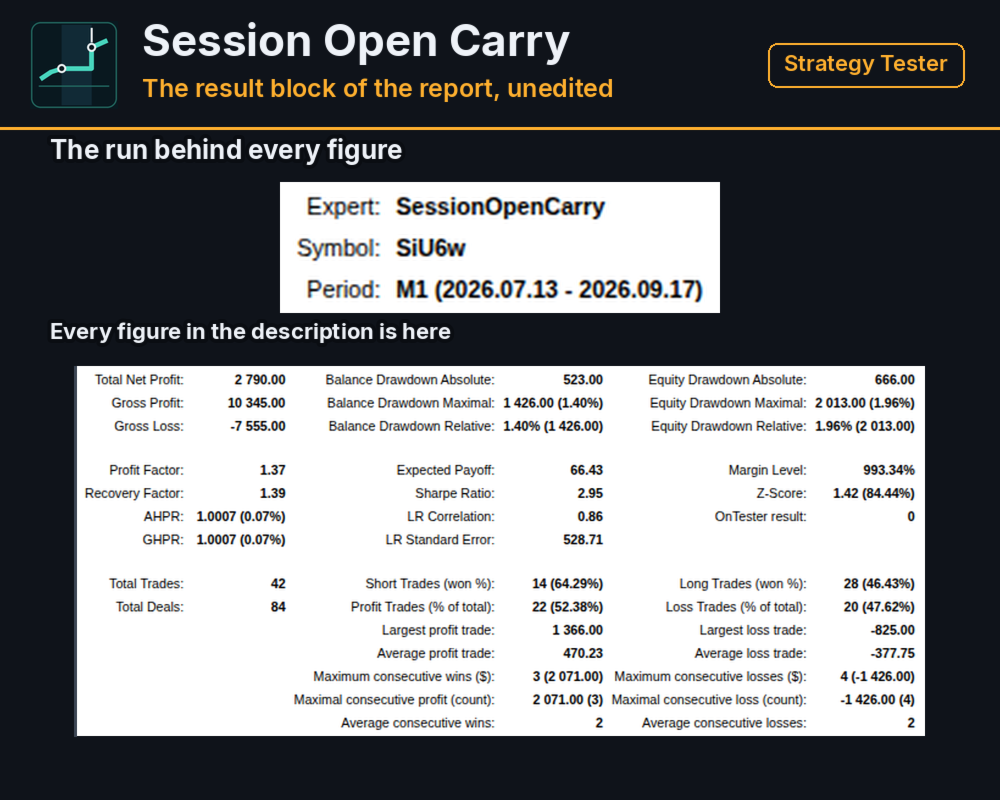
Si-9.26, 2026.07.13 - 2026.09.17, 42 trades, 52.38% of them positive:

  • no delay: net result 2790.00, ratio of gross positive to gross negative 1.37, largest balance drawdown 1426.00 (1.40%), largest equity drawdown 2013.00 (1.96%)
  • 300 ms: net result 2739.00, ratio 1.36, balance drawdown 1436.00 (1.41%), equity drawdown 2030.00 (1.97%)
  • 1000 ms: net result 2693.00, ratio 1.35, balance drawdown 1439.00 (1.41%), equity drawdown 2049.00 (1.99%)

Si-12.26, 2026.09.18 - 2026.10.10, 14 trades, 57.14% of them positive:

  • no delay: net result 2877.00, ratio of gross positive to gross negative 2.60, largest balance drawdown 866.00 (0.84%), largest equity drawdown 1038.00 (1.01%)
  • 300 ms: net result 2860.00, ratio 2.59, balance drawdown 870.00 (0.84%), equity drawdown 1042.00 (1.01%)
  • 1000 ms: net result 2851.00, ratio 2.58, balance drawdown 867.00 (0.84%), equity drawdown 1039.00 (1.01%)

What The Figures Do Not Show

Both periods are short: 42 trades in about ten weeks and 14 trades in about three weeks. They are not a test of the idea over several market regimes, and the second period is too short for its ratio of 2.60 to say anything about the next one.

In each period two single trades, the two with the largest result, make up almost the whole net result. Without them the first period ends at 91.00 with no delay and at -6.00 with the 1000 ms delay, and the second period at 170.00 and 149.00. With so few trades the result cannot be told apart from chance.

The delay in the tester postpones the actions of the EA, such as an exit or a stop move. It does not add slippage to a market entry, and on a live account an entry at the market often fills away from the price at the moment of the signal. There has been no run of this EA on a live or demo account, so the slippage of the entries is not measured and the figures above leave that cost out.

The tester ran on custom symbols built from recorded real ticks of the Si futures, loaded by the author. Your broker's own history, spread, commission and clearing breaks will give different figures. The runs use the minimum lot. A larger lot changes the result and the drawdown in proportion, and the margin of your broker limits the lot you can use.

What It Needs

A futures symbol with regular trading sessions on a netting account. The EA is built for netting: on a hedging account it manages only the first position it finds for its symbol and magic number. The EA was measured on the Si futures of the Moscow Exchange and has no logic that is specific to one symbol, but only Si was measured. It reads minute bars, so the chart timeframe does not matter, and it needs minute history for the current day: the EA rebuilds the session from minute bars when it starts. Keep the terminal connected during the session; after a disconnect the EA continues from the open position.

Settings

Trading: the mode, the magic number, the clock shift, the weekend switch and the allowed slippage in points. Session clock: the entry minute, the exit check minute and the evening snapshot minute. Take and trail: the take distance in points, the share of the position that is closed, and the three percentages of the trailing level. Position size: a fixed lot or a lot by capital, and the lot ceiling. Risk limits: the day loss limit, the drawdown limit and the retry window for a declined entry.

Questions

If something does not work as described, send a private message on mql5.com. Please include your broker, the symbol, the server time shown in the terminal and the settings you use.
作者的更多信息
Swept Liquidity Pools
Vasilii Makarenko
5 (1)
A liquidity sweep is a bar that pushes past a prior swing high or swing low, where protective stop orders tend to rest, and then closes back on the inner side of that level. The same event is known under several names: a stop hunt, a stop run, a liquidity grab, a false breakout, a failed breakout, or a swing failure. Swept Liquidity Pools marks those levels and those bars on the chart. The indicator tracks liquidity pools - confirmed swing levels that have not yet been taken - and marks the exac
FREE
Auto Level Map
Vasilii Makarenko
What Gets Drawn Most level tools mark every swing they can find, and a chart with forty lines answers nothing. This one keeps a level only when price came back to it, and prints the evidence next to the line: the number of touches and the age in days. Lines above current price and lines below it are drawn in different colours, so the map reads at a glance without counting. What Puts A Level On The Chart A swing high is a bar whose high is not lower than its neighbours on both sides, within the n
FREE
Session Value Desk
Vasilii Makarenko
Three Anchors On One Chart Most volume weighted average lines restart once a day. This one draws three at the same time: one anchored to the current trading session, one to the day, one to the week. Their spread tells you something a single line cannot. When the session line sits far under the weekly one, the week has been trading higher than today is; when all three sit together, the market has spent the week in one place. Why The Session Anchor Is Not Midnight The session line starts where the
FREE
Candle Clock Desk
Vasilii Makarenko
What It Shows Candle Clock Desk puts four lines on the chart. The first is the time left until the current bar closes. The next three answer a question the clock alone cannot: is this bar unusually busy, or unusually quiet, right now. Bar closes in - the countdown, in minutes and seconds So far - volume this bar has accumulated since it opened Usual here - what this symbol had accumulated by this same minute, in the past Pace - the first divided by the second The Pace Line Pace of 1.00 means the
FREE
Hourly Spread Map
Vasilii Makarenko
Hourly Spread Map answers one question: at which hours does this symbol cost more to enter, and by how much. It reads the spread field that the terminal stores in every closed M1 bar of your own broker feed, sorts those measurements into 24 hours by 7 days of the week, and shows the result as a grid in the indicator sub-window. What It Measures Every closed M1 bar carries one spread measurement. The indicator collects them over the period you choose, groups them by the hour and weekday of the ba
FREE
Trade Risk Desk answers one question at the moment you need it answered: what volume makes this stop cost exactly what you decided to risk. Drag the stop line to where it belongs on the chart and the panel prints the volume, the money behind it, and the margin the position will hold. What It Answers Set the risk as a percent of balance or as a fixed amount in account currency. Put the stop where your idea says it belongs. The panel reads the symbol settings your broker publishes and prints: the
FREE
Swap Cost Calendar
Vasilii Makarenko
Swap is the part of the cost that is easy to forget, because it arrives once a day, quietly, and never appears in the spread. Swap Cost Calendar puts it on the chart as a number you can act on. What It Shows The panel reads what the broker publishes for the current symbol and shows four things. The cost of one night for a long position and for a short one, in your account currency or in points. The weekday line, showing how many nightly charges a position carries on each day of the week. The tri
FREE
Range Zones M30
Vasilii Makarenko
Range Zones M30 draws zones on your chart where price was pushed back hard on the 30-minute timeframe. It works on any symbol and any chart timeframe, and reads only the prices your terminal already has. It does not use any server, does not send anything out, and does not open or change orders. What It Shows A resistance zone above the market and a support zone below it, as filled rectangles that start at the open of the swing candle that formed them and run to the right. At any moment there is
Signal Confirm
Vasilii Makarenko
Signal Confirm watches one symbol and tells you when a trend setup has passed a fixed chain of checks. It works on any symbol and any chart timeframe. It reads only the M1 prices, the prices of the oscillator timeframe (M5 by default) and the daily prices your terminal already has, does not use any server, does not send anything out, and does not open, change or close orders. It shows what happened and when; the decision stays with you. What It Does When the chain below is complete, the indicato
流动性池是尚未被触及的已确认的摆动高点或摆动低点。流动性扫荡是价格交易至该水平之外随后收盘回到区间内的那一根K线 - 交易者也将同一事件称为止损猎杀、止损扫荡、流动性抓取或假突破。Liquidity Sweep Pools MTF 在当前图表以及你选择的更高时间周期上标记流动性池以及在其上发生的流动性扫荡,并添加一个活跃流动性池的实时面板、流动性池形成时的成交量过滤器,以及检测到的扫荡的 CSV 导出。 此处多时间周期确认意味着每个流动性扫荡都可以对照更高时间周期的流动性池来解读,而无需离开你面前的图表,两组水平以各自的颜色并排绘制。 它标记什么 一件事,精确地说:流动性池的几何形态。它绘制的每个流动性池都带有价格水平、方向、距离和存在时长,同样的四个值会进入面板和 CSV 文件。这就是全部词汇,因此输出易于逐根K线验证,也易于输入到你自己的规则中,无论你是手动交易它们还是从智能交易系统读取缓冲区。 多时间周期流动性池确认 该指标可以将更高时间周期上按相同规则形成的流动性池直接绘制在当前图表上,使用单独的颜色和线宽,因此两个时间周期都可见而无需切换图表。更高时间周期的流动性池绝不会在确
Structure Desk
Vasilii Makarenko
一个用于 MetaTrader 5 上 XAUUSD 的专家顾问。它一次只操作一个篮子:它在固定的服务器小时数内开仓,在价格对其不利时加仓,并将整个篮子一起平仓。单个持仓没有止损,也没有止盈。 它如何交易 一个品种,XAUUSD,一次一个篮子,同一方向最多 5 个订单。 只允许在固定的服务器小时内入场,并且只有当价格位于其四小时区间的边缘时。服务器时间 14:00 至 22:00 之间禁止入场。 当价格对篮子不利时,专家以固定的美元距离加订单,订单之间至少暂停 60 秒。 篮子作为整体平仓:通过账户货币的目标,通过取决于入场小时的价格目标,或在目标被激活后通过移动回吐。 订单量随账户余额缩放。加仓的订单保持相同的量:没有乘数。 专家开箱即可运行:默认输入正是下文每一个数字所依据的设置,包括每小时目标和步长。无需从设置文件加载任何内容。 内置保护 三个限制开箱即启用,每一个都可以关闭。 WeekendFlatHour = 21 - 在周五服务器时间 21:00 平掉篮子并停止入场,这样不会有任何东西被持仓过周末。黄金在周末跳空:在最近 1100 个交易日中,40 美元或以上的跳空发生了
Sarveon
Vasilii Makarenko
Sarveon 是 MetaTrader 5 上用于 XAUUSD 的专家顾问。九个独立策略在同一个图表上并行运行。每个策略都有自己的魔术编号、自己的入场时间周期和自己的一组距离,任何一个策略都不会对另一个策略开出的仓位加仓。 如何交易 每个策略在自己的入场时间周期上扫描最近的 K 线,寻找一个摆动水平位:一个之后没有任何 K 线超过的高点,或者一个之后没有任何 K 线跌破的低点。该水平位必须与当前价格保持最小距离,否则会被忽略。 入场是在该水平位放置的挂单止损单,带有以美元计的固定偏移。买入止损单位于阻力水平位下方而不是上方,因此订单是在价格仍在接近该水平位时成交,而不是在它被突破之后。止损和止盈在订单放置时附加到订单上,并从订单价格而不是成交价格起算。 每个策略限制它同时可以持有多少个挂单和多少个持仓,并拒绝在离自己已经挂出的某个订单太近的地方放置新订单。挂单有自己的生命周期,根据策略不同从几小时到几天不等,到期时会被移除。 一个产品中的九个策略 这九个策略在入场时间周期、摆动水平位的确认方式、订单距离水平位的远近以及止损和目标的大小上各不相同。入场从日线、四小时和一小时图表读取;
Ridgeline
Vasilii Makarenko
Ridgeline 等待在黄金未曾触及的价格水平上。它读取日线柱,标记出此后没有任何柱突破的高点和低点,并在那里挂出一个挂单止损订单。七套规则在不同的历史深度上搜索,因此其中一套可能正等待在上周形成的水平上,而另一套则关注三个月前的水平。 一套规则在承受亏损后会停手两天,然后才再次下单。每套规则都有自己的魔术编号和自己的距离,任何一套规则都不会加仓到另一套规则开立的仓位。亏损的交易由其止损平仓,从不摊平,从不加倍。 它如何找到一个水平 每套规则读取日线柱,只寻找一件事:一个自形成以来市场未曾突破的水平。阻力是一个日线高点,它高于其后的每一根柱,也高于其紧邻之前的柱。支撑是其镜像。价格已经越过的水平不再是水平,规则会转向下一个。 该水平还必须与当前价格保持最小距离。如果最近的未突破水平太近,规则会等待,而不是交易一个市场已经坐落在其上的水平。 入场是一个挂单止损订单,以固定偏移量放置在该水平附近。买入止损位于阻力略下方而非上方,因此当价格仍在接近该水平时订单就会被成交。止损和止盈在订单下达的那一刻就附加到订单上,而不是在成交之后。 每个挂单都有自己的生命周期,根据规则不同,从三天到十九天
Sixfold Gold
Vasilii Makarenko
Sixfold Gold trades XAUUSD on the hourly chart. It looks for the points where the market turned and left an extreme behind, places a pending stop order a little inside that level, and attaches a stop loss and a take profit before the order is ever filled. Six zones do this independently, each with its own search depth, and between them they read three timeframes and four sessions, so the advisor is rarely committed to a single view of the market. A trade that goes wrong is closed by its stop. No
GhBreak
Vasilii Makarenko
GhBreak 建立在一个关于黄金的想法之上:一个自形成以来一直守住的高点或低点的突破,可以走得足够远,以支付那些失败的突破。EA 不追突破。在价格到达之前,挂单止损单已经在该水平等待,并附带其止损和止盈。持仓时间很短:在下面的报告中,平均一笔持续了 22 分钟。 摆动水平 每组规则从小时数据构建自己的 K 线 - H2、H4 或 D1 - 并寻找最新的摆动:一个高点,其左侧高于设定数量的 K 线,其右侧由设定数量的 K 线确认,并且此后没有任何 K 线突破它。价格上方最近的此类高点成为买入水平,价格下方最近的此类低点成为卖出水平。当新的摆动形成或旧的被突破时,挂单被移动到新水平,而不是等待到期日。 订单位于水平稍前一点,因此当价格到达时就会成交,而不是在价格穿过之后。 四组规则 默认开启四组:两组在 H2 K 线上读取摆动,确认方式不同,一组在 H4 上,一组在 D1 上。第五组可用但已关闭。每组每侧最多保留一个挂单,并且当它自己在该侧有持仓时不会在该侧下新单。每组带有自己的魔术编号,因此不同组的持仓从不混合。 止损和止盈是入场价格的分数:止损为 0.28% 到 1.00%,止盈为
Signal Compass Desk
Vasilii Makarenko
一个面板代替五个窗口 解读市场通常意味着同时打开好几个窗口:一个移动平均线看方向,一个振荡指标看动量,一个强度指标区分趋势与区间,还要再来一个看水平位。每一个都在屏幕的自己的角落里回答自己的问题。 Signal Compass Desk 把这些读数放进图表角落里的一个区块中。看一眼就能知道市场偏向哪一边,这波走势的动量是在增强还是在减弱,背后有没有强度,一笔交易设置会把止损和目标放在哪里,以及当前正在运行的是哪个交易时段。 面板在图表上绘制对象,不计算指标缓冲区,因此它不触碰图表本身。它随着新柱的到来而更新。 面板显示什么 方向。分析时间周期上移动平均线的斜率,按波动率归一化,使读数在不同品种和周期之间保持可比。 动量。随机振荡指标的状态,压缩为五个可读状态。 趋势强度。ADX 读数附带一个简单的标签,以免把区间误认为趋势。 交易设置。由 ATR 值推导出的一个止损水平和三个目标,既可以基于信号柱构建,也可以基于最近的回测水平构建。 时段。悉尼、东京、伦敦和纽约,按服务器时间。 质量过滤器。三个严格程度级别,决定面板多容易呈现一个设置。 方向,以及为什么更高的时间周期会确认它 方向读数
Pivot Stop Gold
Vasilii Makarenko
Pivot Stop Gold 围绕黄金上的一种情况构建:价格在一个摆动点转向,然后穿过它。EA 不追这波走势。一个挂单止损单已经在摆动点附近等待,止损和止盈已经附在它上面,在价格到达那里之前。持仓很短:在下面的报告中,平均一笔持续了五分钟。 枢轴位 在其工作时间框架的每一根新柱上,EA 从最近 300 根柱构建一个 ZigZag,并取最近的两个枢轴,从不计算仍在形成的那根柱。 如果两者中较旧的一个是高点,一个 Buy Stop 就放在它正下方。如果较旧的一个是低点,一个 Sell Stop 就放在它正上方。距离是一个属于该配置的固定偏移量。 一旦价格处于该水平的 0.10 以内或已经越过它,就不下任何订单,并且 EA 每边最多保留一个订单或持仓。一个挂单存活 设定的若干小时,EA 在该时间后的第一个 tick 自行移除它。 七个配置 一个配置固定工作时间框架、ZigZag 深度、入场偏移、止损、止盈和移动止损。距离以每盎司黄金的美元计,即每美元 100 个两位小数报价的点。 Scalp 是默认值。 Calm:M30 柱,深度 18,入场在枢轴前方 1.85,止损 4.25,止盈 17
Tessera Footprint
Vasilii Makarenko
Tessera builds a footprint (cluster) chart from the trade ticks that your MetaTrader 5 terminal already receives from your broker. Prices, volumes and sides come from your own data feed; the indicator does not use any external server, does not send anything out and does not read or store your account details. What It Shows Buy and sell volume inside each bar, price by price, with numbers when they fit. Delta of the bar (the difference between buy and sell volume), cumulative delta and a delta st
What You See On The Chart Swing Percentile Desk places one table on one chart. Each row is a symbol from your watchlist and each column is a pullback size. A cell tells you what share of that symbol's earlier moves the current move has already outdone. A low number means a young move; a high number means the move is stretched compared with the history of the same symbol. Every symbol is compared only with itself, so a quiet pair and a restless pair are read on the same scale and no manual measur
筛选:
无评论
回复评论