PinMetrics MT4
- 指标
-
Liam Alex Thomas Webb
 嘿,我是Liam——是的,我不小心把我的中间名填进了名字框里(我知道,这是个经典失误)。
我是一名交易者、程序员和数据爱好者,过去几年我一直在设计自己的工具来提升我的交易优势。经过在真实市场中的测试后,我决定与其他认真对待交易的交易者分享一些最有用的指标。我的交易方法结合了价格行为、统计概率和市场结构,因此我发布的指标也反映了这种组合。无论是基于模式的概率还是数据支持的预期统计,我关注的是真正有效的东西——而不是炒作或过于花哨的视觉效果。
这里所有的指标都是100%原创——没有重新打包的代码或回收的脚本。
这些都是我为自己的策略打造并不断完善的真实工具。 - 版本: 1.0
- 激活: 10
别再猜测哪些 pin bar 有效了。让数据揭示优势。
概述
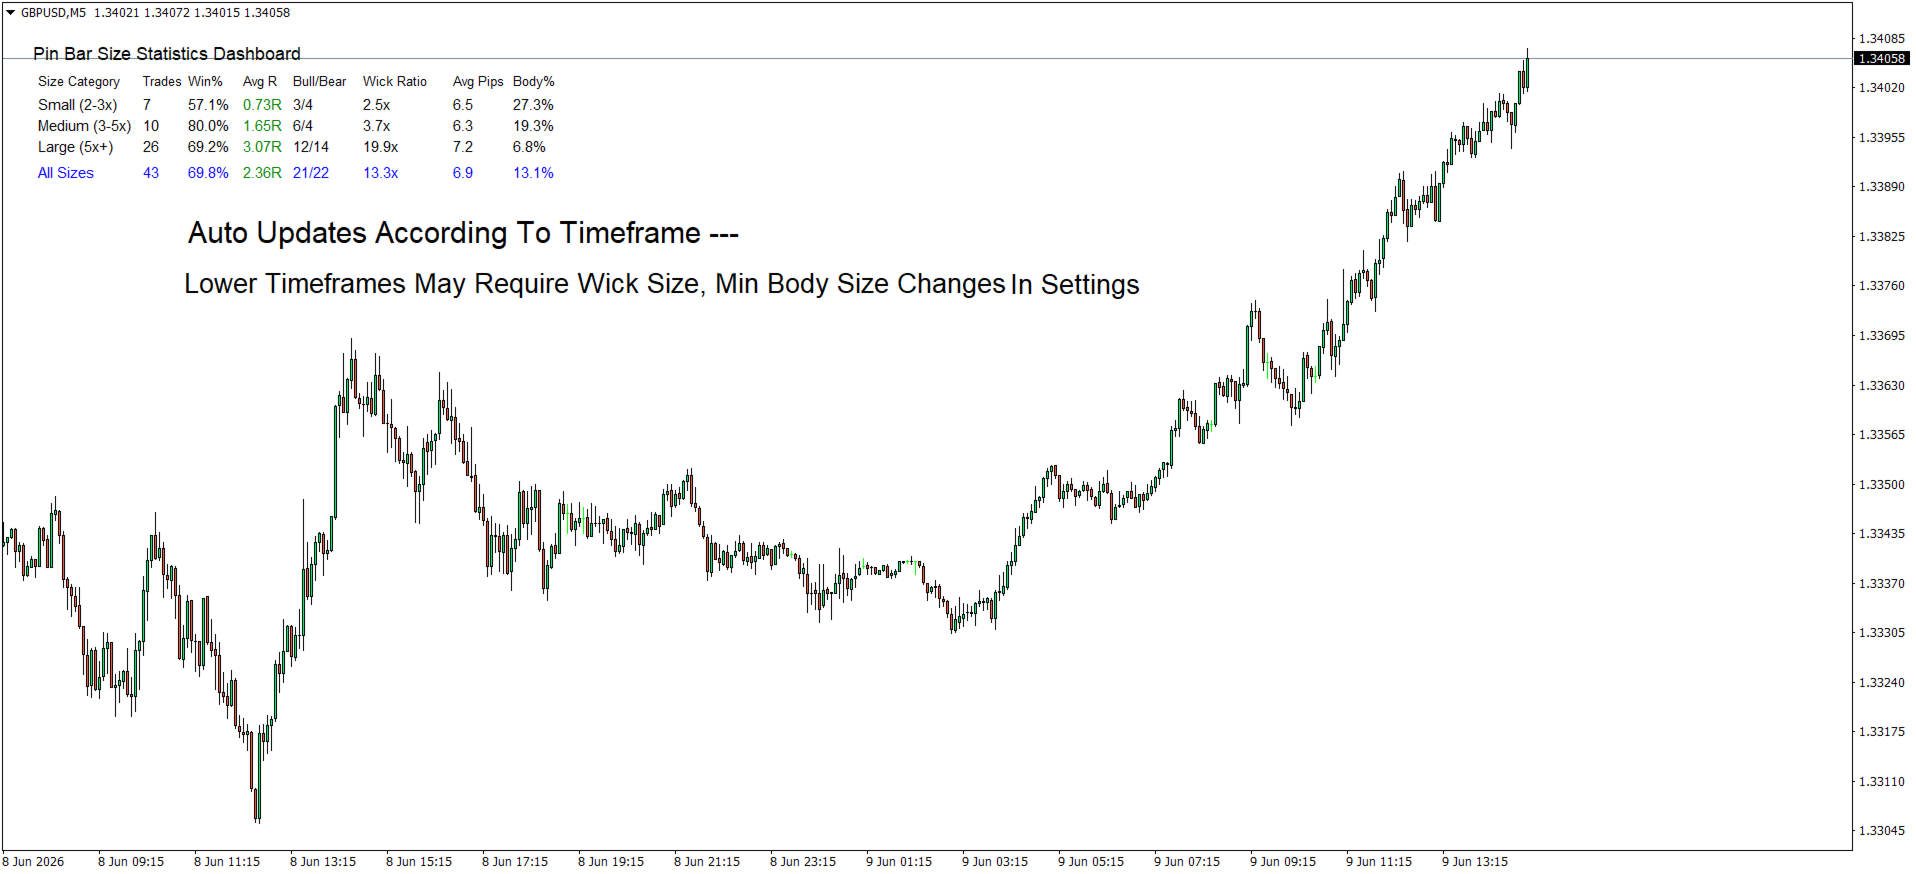
PinMetrics 是一款专业的 MetaTrader 4 指标,可自动检测和分析 pin bar 形态,并根据影线与实体的比率对其进行分类。它为每个尺寸类别提供全面的绩效统计数据,帮助交易者识别哪些 pin bar 形态能提供最可靠的交易机会。
并非所有 pin bar 都是一样的。PinMetrics 会准确告诉您,在当前交易品种和时间框架上,哪个尺寸类别具有最高的胜率和最佳的 R 倍数。
主要功能
| 功能 | 优势 |
|---|---|
| 基于尺寸的分类 | 根据影线与实体的比率,自动将 pin bar 分为小(2-3倍)、中(3-5倍)和大(5倍以上)三类 |
| 实时统计面板 | 为每个类别显示交易次数、胜率、平均 R、多空比率、影线比率、平均点数和实体百分比 |
| 方向检测 | 自动识别看涨(锤子线)和看跌(射击之星)pin bar |
| 成交量确认选项 | 可选择要求 pin bar 具有更高的成交量 —— 更强的拒绝信号 |
| 风险管理整合 | 配置每笔交易的风险百分比,用于仓位大小计算 |
| 可调整阈值 | 自定义影线比率边界、最小 K 线尺寸和检测灵敏度 |
| 简洁面板布局 | 专业表格格式,R 倍数采用颜色编码(绿色为正,红色为负) |
| "所有尺寸"汇总行 | 所有检测到的形态的整体表现 |
| 自动检测 | 扫描多达 1000 根 K 线,并在每根新 K 线出现时自动更新 |
面板结构
| 列 | 描述 |
|---|---|
| 尺寸类别 | 小(2-3倍)/ 中(3-5倍)/ 大(5倍以上) |
| 交易次数 | 该类别中检测到的 pin bar 数量 |
| 胜率 | 产生盈利走势的形态百分比 |
| 平均 R | 平均风险倍数(绿色为正,红色为负) |
| 多/空 | 看涨 pin bar vs 看跌 pin bar |
| 影线比率 | 影线相对于实体的平均长度(例如 4.2倍) |
| 平均点数 | 平均 K 线总大小(点数) |
| 实体百分比 | 实体占总体范围的百分比(越低 = 拒绝越干净) |
Pin Bar 检测标准
| 条件 | 要求 |
|---|---|
| 小实体 | 实体不超过 K 线总体范围的 33% |
| 长影线 | 主导影线不少于总体范围的 60% |
| 方向 | 长下影线 = 看涨(锤子线)/ 长上影线 = 看跌(射击之星) |
| 最小尺寸 | 可配置的 K 线最小尺寸(点数),默认 10 点 |
| 成交量确认 | 可选 —— 要求成交量高于前一根 K 线 |
尺寸分类系统
| 类别 | 影线比率 | 描述 | 典型表现 |
|---|---|---|---|
| 小 | 2-3倍 | 中等影线延伸 | 基准胜率 |
| 中 | 3-5倍 | 显著影线延伸 | 更高胜率和 R |
| 大 | 5倍以上 | 极端影线延伸 | 最高胜率和 R 倍数 |
为什么较大影线比率表现更好
| 因素 | 小(2-3倍) | 中(3-5倍) | 大(5倍以上) |
|---|---|---|---|
| 拒绝力度 | 中等 | 强 | 极端 |
| 止损距离 | 较紧 | 中等 | 较宽 |
| 风险回报潜力 | 1.5-2.5R | 2-4R | 3-6R |
| 典型胜率 | 50-60% | 55-65% | 60-70% |
| 最佳时间框架 | 较低(M15-H1) | 较高(H1-H4) | 最高(H4-日线) |
输入参数(MT4)
面板设置
| 参数 | 默认值 | 描述 |
|---|---|---|
| DashboardX | 20 | 水平位置(距左边缘像素数) |
| DashboardY | 30 | 垂直位置(距上边缘像素数) |
| DashboardColor | White | 面板背景色 |
| TextColor | Black | 面板文字颜色 |
| FontSize | 9 | 基础字体大小 |
Pin Bar 形态设置
| 参数 | 默认值 | 描述 |
|---|---|---|
| SmallWickRatio | 2.0 | 小 pin bar 阈值(影线 ≥ 2倍实体) |
| MediumWickRatio | 3.0 | 中 pin bar 阈值(影线 ≥ 3倍实体) |
| LargeWickRatio | 5.0 | 大 pin bar 阈值(影线 ≥ 5倍实体) |
| MaxBodyRatio | 0.33 | 实体占总体范围的最大百分比(33%) |
| MinWickPercentage | 0.60 | 主导影线占总体范围的最小百分比(60%) |
| RequireVolumeConfirmation | false | 要求 pin bar 具有更高成交量 |
| MinPinBarSizePips | 10.0 | pin bar 最小总大小(点数) |
风险管理
| 参数 | 默认值 | 描述 |
|---|---|---|
| RiskPercentage | 1.0 | 每笔交易风险占账户余额的百分比 |
| MaxHistoryBars | 1000 | 要分析的最大 K 线数量 |
如何使用 PinMetrics
第 1 步:附加到图表
将 PinMetrics 拖放到任何 MT4 图表上(推荐:H1、H4 或日线)。
第 2 步:让它扫描
该指标自动扫描多达 1000 根 K 线,并对找到的每个 pin bar 进行分类。
第 3 步:阅读面板
寻找胜率最高和平均 R 最佳的类别:
-
大(5倍以上)类别显示 66% 胜率和 +2.10R?→ 优先考虑这些形态。
-
小(2-3倍)类别显示 45% 胜率?→ 有选择性地交易或避免。
第 4 步:结合背景交易
最强的 pin bar 出现在以下情况:
-
在关键支撑/阻力位形成
-
跟随强趋势(逆势 pin bar)
-
与更高时间框架的偏好一致
-
伴随成交量激增
实际交易应用
入场
-
支撑位的看涨 pin bar -> 在 pin bar 高点被突破时买入
-
阻力位的看跌 pin bar -> 在 pin bar 低点被突破时卖出
止损
将止损设在 pin bar 极值之外(影线末端)。
获利目标
-
第一目标 —— 近期波段高点/低点
-
第二目标 —— 下一个支撑/阻力位
-
第三目标 —— 2倍风险金额(有效形态的最低要求)
仓位计算
风险金额 = 账户余额 ×(RiskPercentage / 100)
仓位规模 = 风险金额 ÷ 止损距离(点数 × 点值)
假信号警示标志
| 信号 | 为什么弱 |
|---|---|
| pin bar 在区间中部 | 没有明确的拒绝水平 |
| 总体范围非常小(<10 点) | 动量不足 |
| 两侧影线相等 | 犹豫不决,而非拒绝 |
| 成交量低(如启用确认) | 可能是随机噪音 |
| 逆更高时间框架趋势 | 延续概率较低 |
故障排除
| 问题 | 解决方案 |
|---|---|
| 未检测到 pin bar | 降低 MinPinBarSizePips 或检查图表时间框架(推荐 H1 以上) |
| 面板不显示 | 调整 DashboardX / DashboardY 值 |
| 成交量确认过于严格 | 设置 RequireVolumeConfirmation = false |
| 形态过多或过少 | 调整 MaxBodyRatio 或 MinWickPercentage |
| 较小时间框架的噪音 | 切换到 H1、H4 或日线以获得更清晰的形态 |
安装(MT4)
-
下载 PinMetrics.mq4 或 .ex4
-
在 MT4 中:文件 -> 打开数据文件夹 -> MQL4 -> Indicators
-
将文件复制到 Indicators 文件夹中
-
重启 MT4 或在导航器中右键单击 -> 刷新
-
将 PinMetrics 拖放到图表上
许可证
本指标仅供教育和个人交易使用。未经许可禁止再分发或商业使用。
PinMetrics —— 测量。分析。基于数据交易。